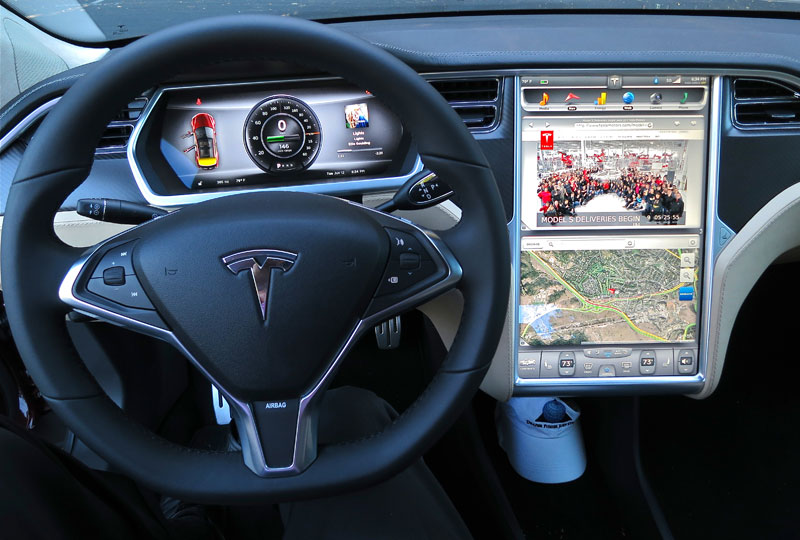
The interior of a Tesla Model S. Flickr Image.
Most companies incur some sort of operating expenses, such as research and development, rentals, property maintenance, payroll, marketing, advertising, and administrative costs. It’s no exception for Tesla (NASDAQ: TSLA).
Over the past several years, Tesla’s operating expenses have grown tremendously, reaching record figures in 2024.
This article delves into several statistics of the automaker’s operating costs, including the operating expense figures, the breakdown of operating costs, several ratios, and growth rates. This article does not cover costs of sales.
Let’s look at the numbers.
Investors interested in Tesla’s marketing, advertising, and promotional costs may find more resources on this page: Tesla advertising and marketing expenses versus Ford and General Motors.
Please use the table of contents to navigate this page.
Table Of Contents
Definitions And Overview
O2. How Does Tesla Spend Its Expenses?
Consolidated Results
B1. Operating Expenses By Year
B2. Operating Expenses By Quarter
B3. Operating Expenses By TTM
Growth Rates
B4. YoY Growth Rates Of Operating Expenses By TTM
Results By Category
C1. Breakdown Of Quarterly Operating Expenses
C2. Breakdown Of TTM Operating Expenses
Comparison With Revenue
D1. Operating Costs Versus Total Revenue
D2. Operating Costs Versus Total Revenue In Growth Rates
Margin Decline
Ratios
F1. Operating Expenses To Revenue Ratio
F2. R&D And SGA To Revenue Ratio
F3. R&D And SGA To Total Expenses Ratio
Summary And Reference
S1. Summary
S2. References and Credits
S3. Disclosure
Definitions
To help readers understand the content better, the following terms and glossaries have been provided.
R&D Expense: Tesla’s R&D expense primarily consist of personnel costs for teams in engineering and research, manufacturing engineering and manufacturing test organizations, prototyping expenses, contract and professional services, and amortized equipment expenses.
SGA Expense: Tesla’s SGA expense primarily consists of personnel and facilities costs related to stores, marketing and advertising, sales, executive, finances, human resources, information technology, legal organizations, and fees for professional and contract services and litigation settlements.
Tesla’s marketing promotional and advertising costs are part of the SGA expense. In the annual reports, Tesla stated that its marketing, promotional, and advertising costs was immaterial.
Restructuring and Other Expense: Tesla’s restructuring and other expenses are related to the following items:
1. Employee termination expenses
2. Losses from sub-leasing a facility
3. Disposal of tangible assets
4. Shortening of the useful life of a trade name intangible asset
5. Impairment losses
6. Court settlement fees
Restructuring only appeared in certain quarters in 2018 and 2019 when Tesla carried out specific restructuring actions, such as closing certain stores to reduce costs and improve efficiency.
How Does Tesla Spend Its Expenses?
Tesla, Inc., as a leading player in the electric vehicle (EV) and clean energy sector, allocates its expenses across several key areas to support its operations and growth strategies. These expenses can be broadly categorized into the following:
1. **Research and Development (R&D):** A significant portion of Tesla’s expenses goes into research and development. This includes the development of new vehicles, like the Cybertruck and Roadster, improvements in battery technology, and advancements in autonomous driving capabilities. R&D is crucial for Tesla to maintain its competitive edge in technology and innovation.
2. **Manufacturing and Production Costs:** Another major expense for Tesla is the cost associated with manufacturing and production. This includes the costs of materials, labor, and the operation of its factories, like the Gigafactories in Nevada, Shanghai, Berlin, and Texas. Tesla has been continuously expanding its manufacturing capabilities to meet growing demand and reduce production costs through economies of scale.
3. **Sales and Marketing:** Unlike traditional automakers, Tesla spends relatively less on marketing, relying heavily on word-of-mouth and free media coverage. However, the company still incurs expenses related to sales, including the operation of its showrooms, service centers, and the Supercharger network. These expenses are essential for customer acquisition, support, and retention.
4. **Administrative Expenses:** These include general and administrative costs, such as salaries for employees not directly involved in manufacturing or R&D, legal expenses, and other overhead costs. As Tesla grows, so does its administrative expenditure, although the company aims to optimize these costs through efficient operations.
5. **Capital Expenditures (CapEx):** Tesla invests heavily in capital expenditures to expand its production capacity, develop new products, and build infrastructure, such as the charging network and energy storage solutions. These investments are critical for long-term growth but require significant upfront spending.
6. **Operating Expenses:** This includes a wide range of costs associated with the business’s day-to-day operations, from shipping and logistics to warranty service and repairs.
Tesla’s approach to spending and investment is closely tied to its mission to accelerate the world’s transition to sustainable energy. The company focuses on scaling up its production capabilities, advancing technology, and expanding its global presence, all while managing its operational costs to strive for profitability and long-term sustainability.
Operating Expenses By Year
tesla-operating-expenses-by-year
(click image to expand)
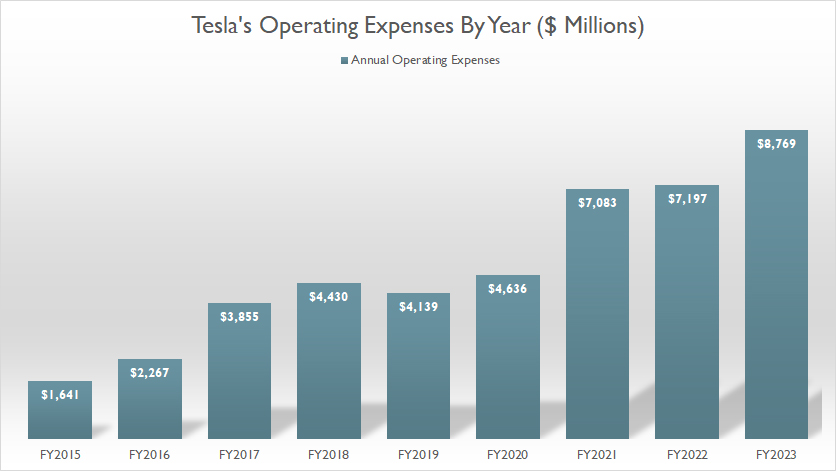
Tesla incurred a record figure of $8.8 billion in total operating expenses in fiscal year 2023, up 22% or $1.6 billion from 2022.
Compared to fiscal 2021, Tesla’s $8.8 billion operating expenses reported in 2023 rose 24%. Since 2015, Tesla’s operating expenses have risen by 434% or 54% annually on average over the past eight years.
Is Tesla’s record figure of operating expenses a cause for concern for investors? Read on.
Operating Expenses By Quarter
Tesla’s quarterly operating expenses
(click image to expand)
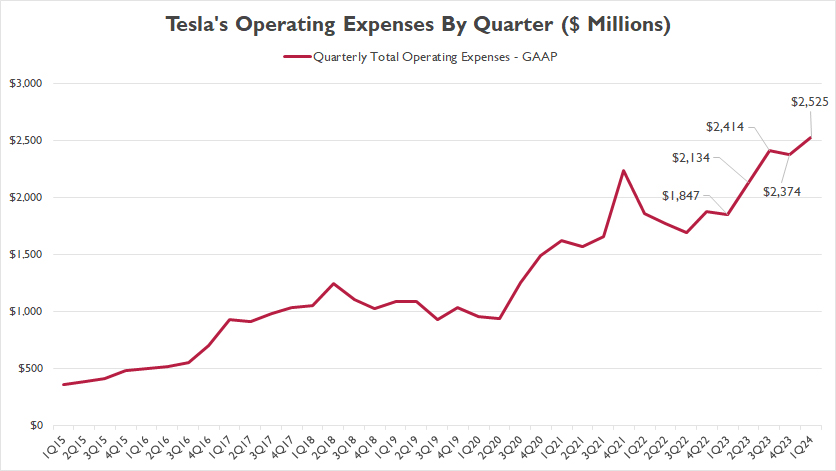
Tesla’s quarterly operating expenses averaged $2.3 billion between 1Q 2023 and 1Q 2024, and reached $2.5 billion as of 1Q 2024, up 37% from last year.
Operating Expenses By TTM
Tesla’s TTM operating expenses
(click image to expand)
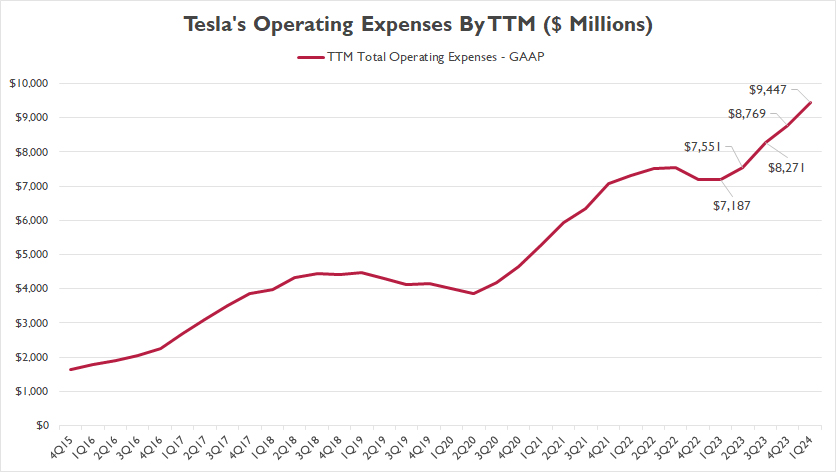
The TTM plot above depicts the significant rise in Tesla’s operating expenses on a long-term basis. As seen, Tesla’s operating expenses reached a record figure of $9.4 billion as of 1Q 2024 on a TTM basis, up 31% year-on-year.
YoY Growth Rates Of Operating Expenses By TTM
tesla-operating-expenses-growth-rates
(click image to expand)
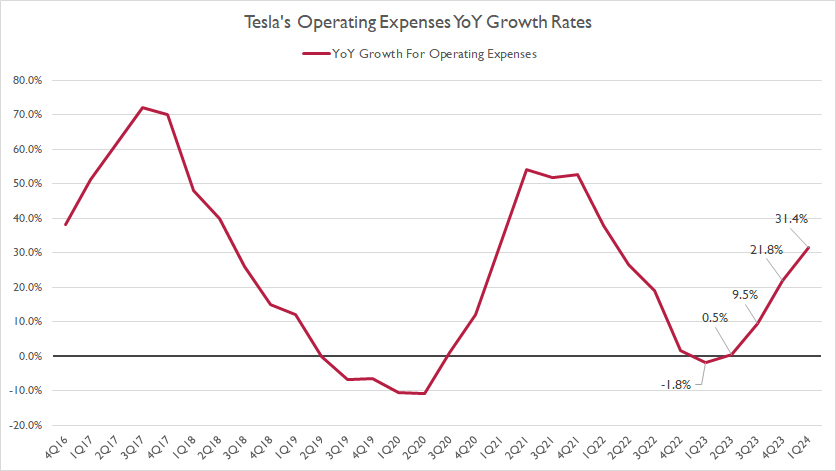
Tesla’s operating expenses have experienced a significant increase in the last several quarters. The average growth rate was 16% for the last four quarters.
As of 1Q 2024, Tesla’s operating expenses grew 31.4%, the highest figure ever measured since 2023.
Breakdown Of Quarterly Operating Expenses
Tesla’s operating expenses by quarter breakdown
(click image to expand)
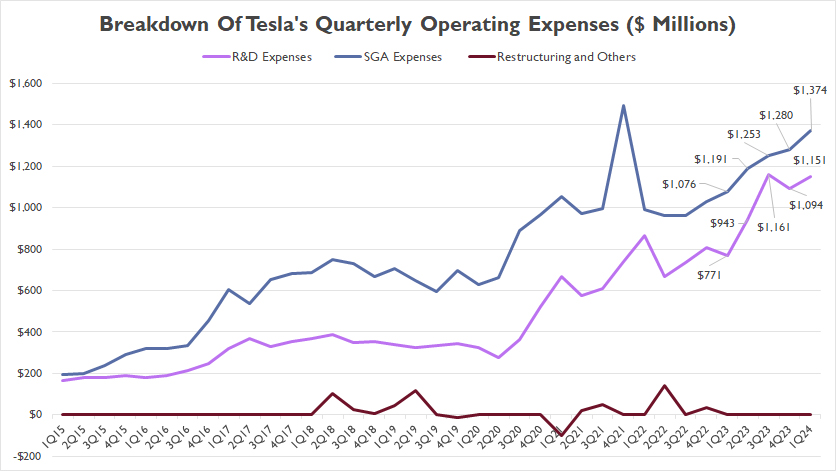
The definitions of the breakdown of Tesla’s operating expenses are available here: R&D expense, SGA expense, and restructuring expense.
Tesla’s restructuring costs have been insignificant. On the other hand, Tesla’s SGA expense has formed the biggest portion, averaging $1.2 billion per quarter between 1Q 2023 and 1Q 2024. This figure rose to $1.4 billion as of 1Q 2024.
Tesla’s R&D spending has averaged $1.0 billion per quarter during the same period. As of 1Q 2024, this figure increased to $1.2 billion.
Breakdown Of Operating Expenses By TTM
Tesla Operating Expenses By TTM Breakdown
(click image to expand)
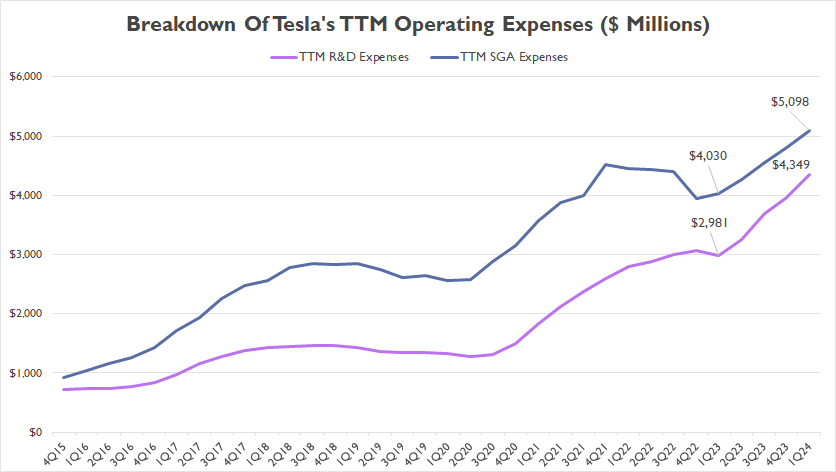
The TTM plot looks much smoother than the quarterly plot. The definitions of the breakdown of Tesla’s operating expenses are available here: R&D expense, SGA expense, and restructuring expense.
As seen, Tesla’s SGA expense has been significantly higher than R&D expense. As of 1Q 2024, Tesla’s SGA expense reached a record figure of $5.1 billion, while R&D expense was $4.3 billion. These figures were significantly higher than a year ago.
On average, the TTM SGA expense totaled $4.5 billion per quarter between 1Q 2023 and 1Q 2024, while R&D reached $3.6 billion during the same period, a much lower figure than SGA.
Operating Costs Versus Total Revenue
Tesla’s operating costs vs total revenue
(click image to expand)
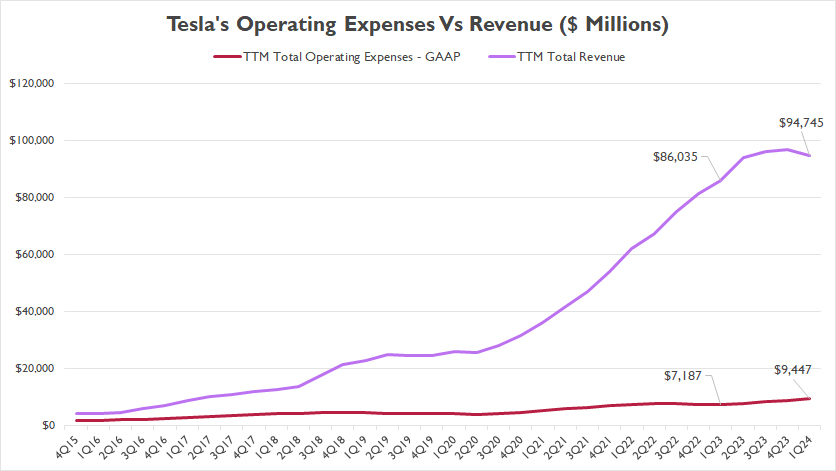
Fortunately, Tesla’s revenue has grown much faster than operating expenses, as depicted in the chart above.
What started out in 2015 was that revenue and operating expenses were nearly at the same starting point. Going forward, Tesla’s revenue has grown much faster, while operating expenses has grown moderately.
As of 1Q 2024, Tesla’s revenue was about 10X higher than operating expenses. The difference was about 12X a year ago. The lower ratio recently has implied that either revenue growth has slowed or operating expenses growth has grown faster or both.
Operating Costs Versus Total Revenue In Growth Rates
tesla-operating-expenses-vs-total-revenue-in-growth-rates
(click image to expand)
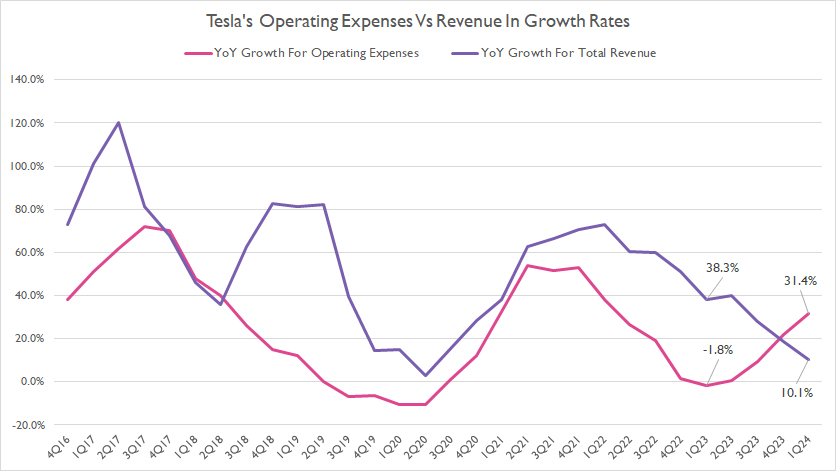
Tesla’s revenue growth has always been much better than the growth of operating expenses.
However, Tesla’s operating expenses growth has outpaced the revenue growth in 2024 for the first time since 2016. As seen, the growth of operating expenses increased to 31.4% as of 1Q 2024, while revenue growth measured just 10.1% in the same period.
If the growth of Tesla’s operating expenses keeps on outpacing revenue growth, this trend is a concern and a big problem for the company and shareholders.
Operating Margin – GAAP
Tesla Operating Margin
(click image to expand)
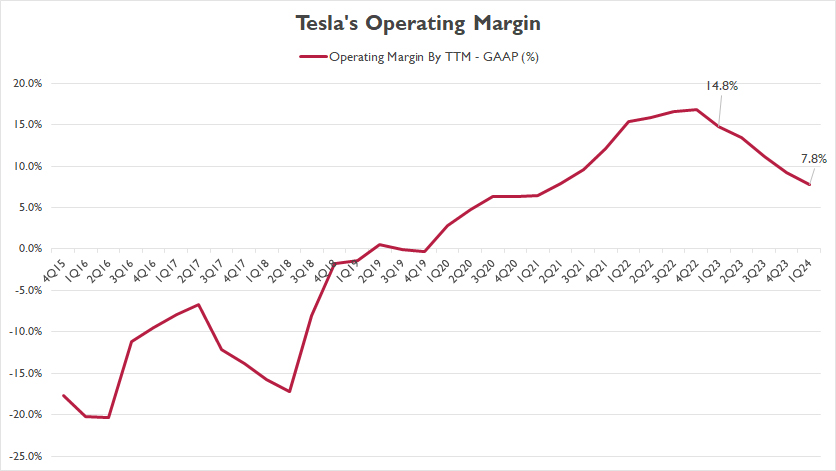
Tesla’s slowing revenue, coupled with the rising operating expenses, has negatively impacted the operating margin.
As seen, Tesla’s operating margin tumbled to 7.8% as of 1Q 2024, only half of last year result. The decreasing margin is a concern and a problem for the company, as profitability is shrinking.
Operating Expenses To Revenue Ratio
Tesla’s operating expense to revenue ratia
(click image to expand)
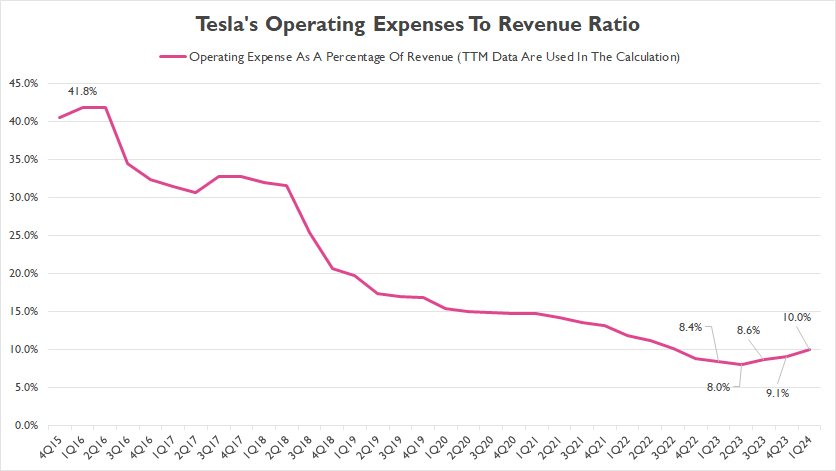
Although operating expenses have significantly risen, the ratio to revenue has decreased, reaching just 10% as of 1Q 2024.
Due to the slowing revenue growth and the rising operating expenses in recent periods, the ratio to revenue has slightly ticked up recently, as depicted in the chart above.
However, the ratio has been at record lows in the last several quarter compared to historical highs. If the rising trend of the ratio continues, shareholders should be worried.
R&D And SGA To Revenue Ratio
R&D and SGA expense to revenue ratio
(click image to expand)
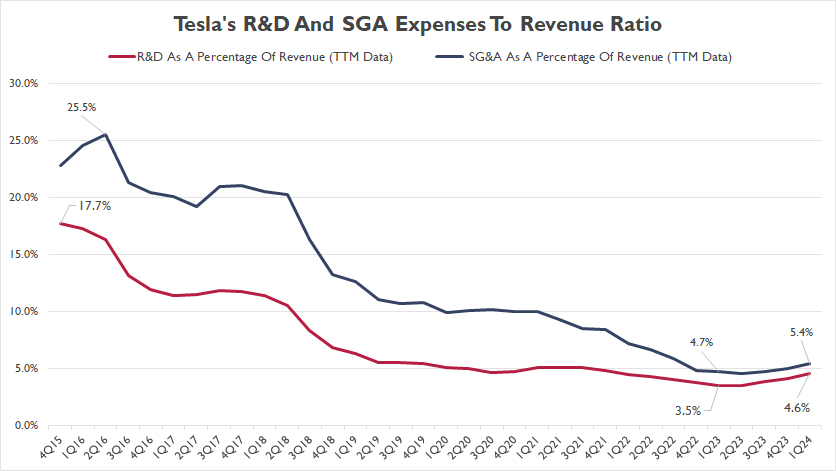
This chart shows that Tesla’s R&D and SGA expenses have risen against revenue in recent periods, aligned with the rising ratio to revenue we saw earlier. R&D ratio seems to be rising slightly faster than SGA expense.
Again, if the rising trend of both ratios continues, it is a concern and a problem for Tesla and shareholders.
R&D And SGA To Total Operating Expenses Ratio
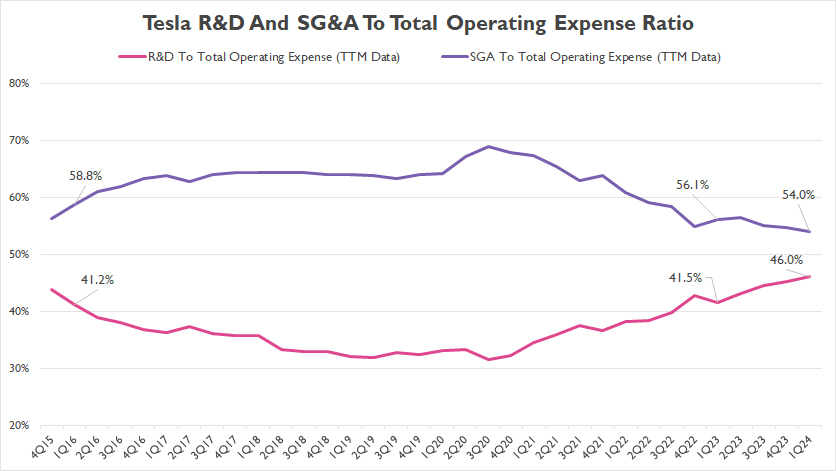
Tesla R&D and SGA To Total Operating Expenses Ratio
(click image to expand)
This chart shows that Tesla’s SGA forms a higher portion of expense than R&D does. As of 1Q 2024, Tesla’s SGA represented 54% of the total operating expenses, while R&D made up 46%.
A noticeable trend is the decreasing percentage of the SGA expense and the rising percentage of the R&D expense since 2021. This trend confirms the much faster growth of R&D expense than SGA expense that we saw earlier.
Conclusion
Tesla’s growing operating expenses are negatively impacting the operating margin. Operating margin tumbled to a record low as of 2024.
Although the operating costs of Tesla are rising, the company’s revenue growth remains significantly higher.
However, recently, the trend has reversed. Tesla’s operating expenses growth has outpaced revenue growth for the first time in 2024 since 2015.
Investors should keep an eye on the rising operating expenses and slowing revenue. If this trend continues, Tesla can be negatively impacted, as profit can shrink. It is a concern for shareholders.
References and Credits
1. All financial figures presented in this article were obtained and referenced from Tesla’s SEC filings, investor update letters, quarterly and annual reports, earnings calls, etc., which are available in Tesla Investor Relations.
2. Featured images in this article are used under the Creative Commons License and sourced from the following websites: Maurizio Pesce and Steve Jurvetson
Disclosure
References and examples such as tables, charts, and diagrams are constantly reviewed to avoid errors, but we cannot warrant the total correctness of all content.
The content in this article is for informational purposes only and is neither a recommendation nor a piece of financial advice to purchase a stock.
If you find the information in this article helpful, please consider sharing it on social media and also provide a link back to this article from any website so that more articles like this one can be created in the future.
Thank you!

Hello, thank you for your article. Is it possible to exhibit your graphs in an article I’m writing with proper credit?
Sure, no problem. Please go ahead.
How much of the operating expenses is TRANSPORTATION;
delivery of resources and customer delivery? Any idea what Tesla pays for ‘contract-commercial -trucking’? Yeah, Tesla-Semi is a platform to lower ‘cost-of-transportation’ for delivery of resources and production. Mr. Musk is producing his own trucking empire, …not a truck for delivering @Pepsi snacks