1st Part: Ford’s Stock Valuation
2nd Part: Ford’s Dividend Safety Check
Ford Motor (NYSE:F) is a dividend-paying company and the stock pays a quarterly dividend that yields nearly 4% on an annual basis.
If you are looking to accumulate Ford Motor in your portfolio for a good dividend income, Ford Motor may probably be a good bet as it is the only few automobile companies that have never filed for bankruptcy.
Apart from that, Ford Motor is in the midst of transitioning to a full electric vehicle (EV) player and this act alone warrants much upside in the stock as EV is the way forward in the automotive industry.
For your information, Ford Motor has already rolled out several new EV models in 2022, including the popular F-150 Lightning.
That said, when this article was published, Ford Motor’s stock price was traded at $15.
Before going ahead to buy the stock, how do you know if $15 is a good entry price for Ford’s stock?
In this aspect, you want to purchase the stock at a valuation that is below the historical average because that is what the market has been saying about the value of the stock on average.
And, you want to buy the stock at a much cheaper valuation in order to price in as much downside as possible.
Aside from the historical data, you also want to look at the forward valuation ratio because this ratio indicates future growth.
In addition, you also want to make sure that the most pessimistic forward ratio is near the historical average or better yet, near the 6-month, 1-year or even 2-year lows.
This is the time you strike when the stock hit these levels, a level that has most likely priced in all pessimism.
All of the above steps can be performed in the Ford Motor Valuation Spreadsheet here.
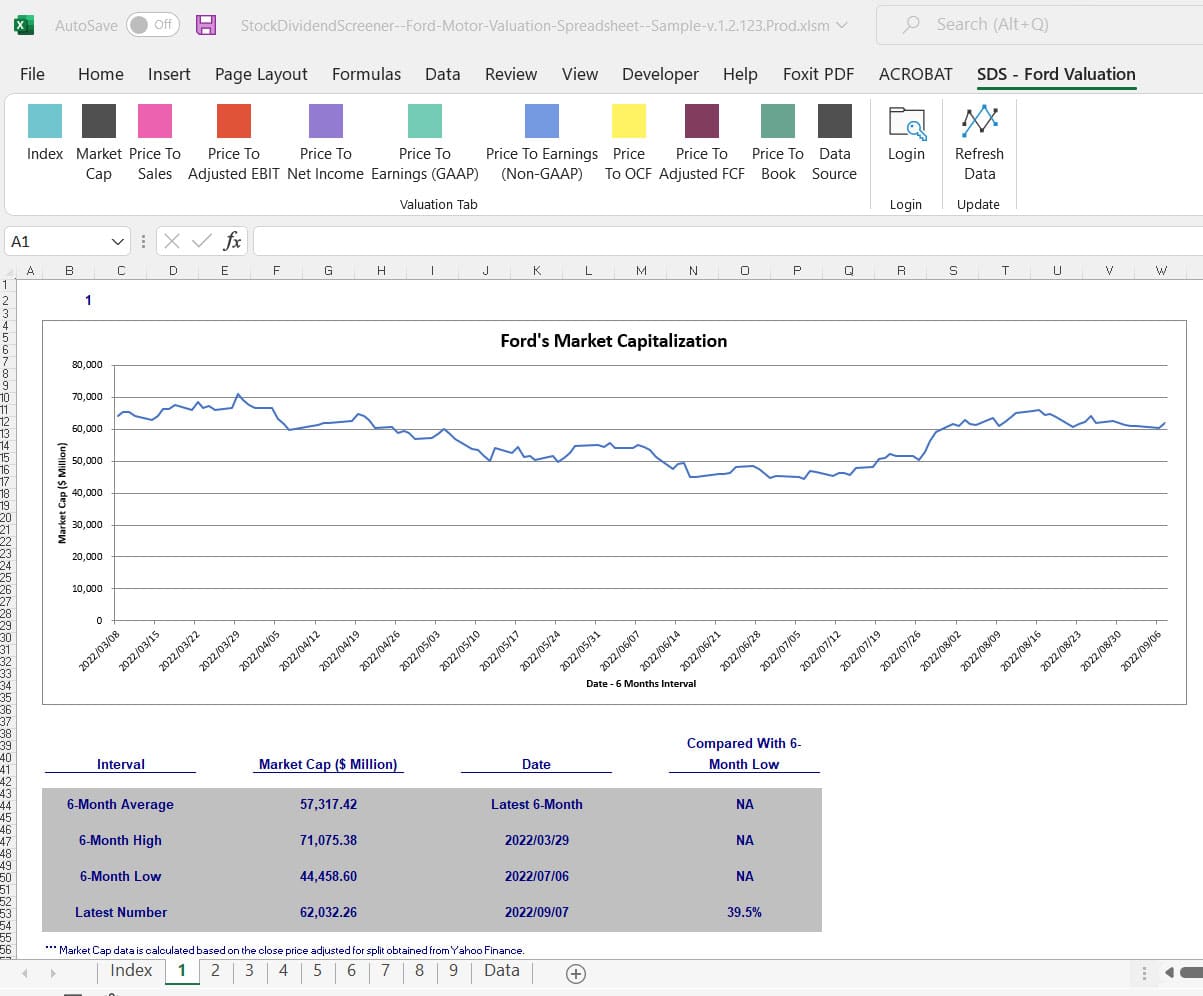
The Ford Motor Valuation & Dividend Spreadsheet tool provides the following valuation ratios for the stock on a historical (6-month, 1-year, and 2-year), and forward basis:
1. Market Cap
2. Price To Revenue/Sales
3. Price To Adjusted EBIT (Company Adjusted)
4. Price To Net Profit
5. Price To Earnings (GAAP and Non-GAAP)
6. Price To Operating Cash Flow
7. Price To Adjusted Free Cash Flow (Company Adjusted)
8. Price To Book Value
2 critical metrics worth mentioning are the adjusted EBIT (Non-GAAP) and the Adjusted Free Cash Flow (Non-GAAP) which is provided by Ford Motor during every single earnings call as shown in the following snapshot.

Ford’s 2022 outlook
This fundamental data takes out all of the one-time and non-recurring expenses and is adjusted by Ford Motor itself.
In that sense, the adjusted EBIT measures the core earnings of Ford and is a good metric to evaluate the strength of the company’s core businesses, aka the automotive segment.
On the other hand, the adjusted Free Cash Flow measures Ford’s adjusted free cash flow based on the automotive business of the company.
Therefore, these 2 critical metrics measure Ford’s profitability and cash flow based on the company’s core businesses, and this has to be the automotive segment.
As such, the valuation ratio that takes into account the 2 fundamental metrics is critical to Ford’s shareholders because they measure the strength of the core segment of the company.
And, the best thing is that Ford Motor provides guidance on these 2 fundamental metrics in every single earnings call.
From the Ford Valuation Spreadsheet, you can see how the market reacts to the changes in these 2 metrics on a historical basis and what the current valuation is with respect to the guidance provided by the company (this is the forward ratio).
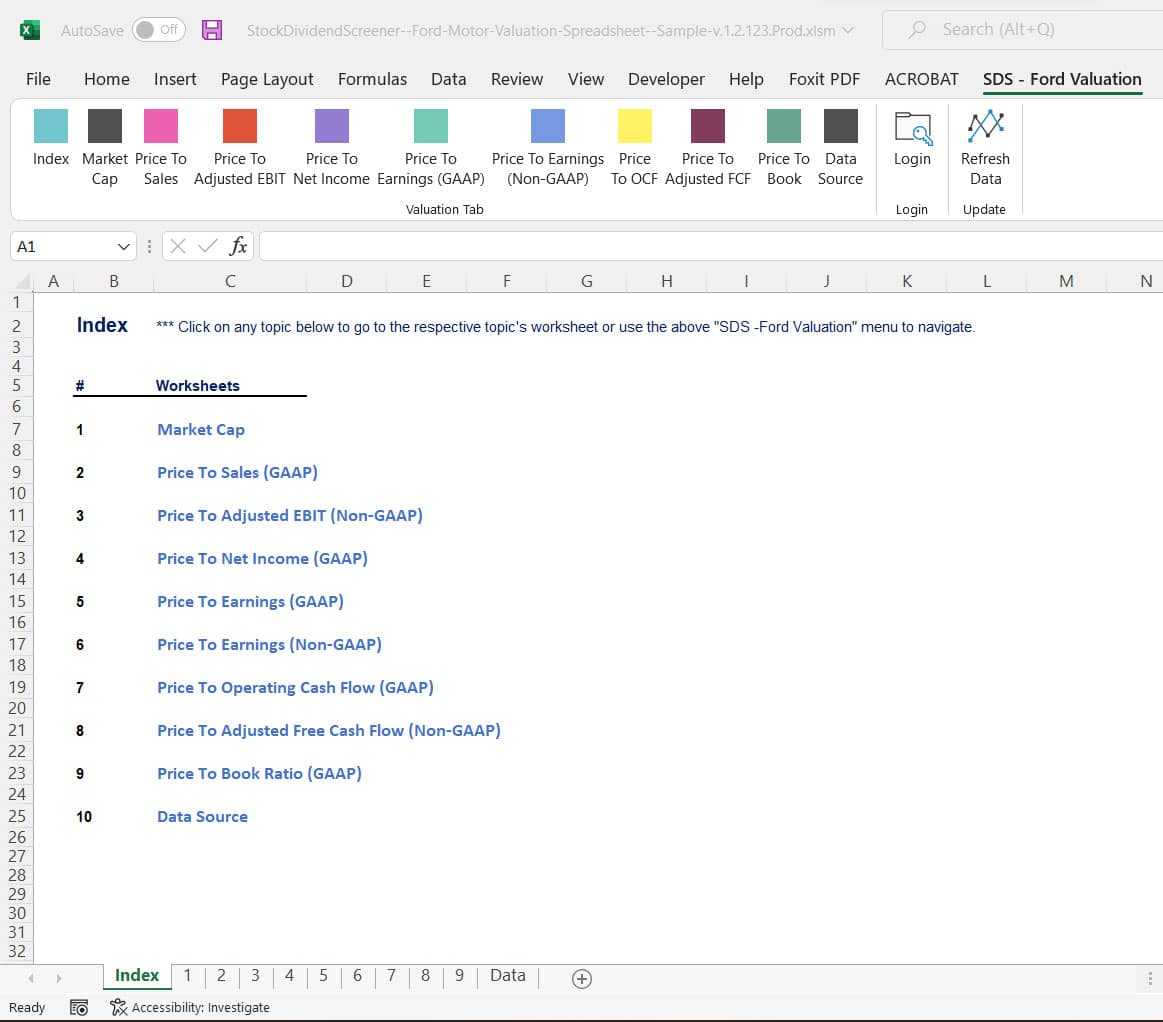
To see how the spreadsheet works, please download a sample of the Ford Valuation & Dividend Spreadsheet here.
SDS – Ford Motor Valuation & Dividend Spreadsheet Sample
For the full version, it costs only $9.90 for 1-year of support and re-downloads. If you decide not to renew, you can still use the tool for a lifetime without any restrictions.
Go ahead to get the tool here:
It uses market prices, both current and historical figure, to see how the stock has been valued with respect to various fundamental data such as revenue, earnings, cash flow, etc.
Aside from the GAAP metrics, the tool also measures valuation with respect to Non-GAAP metrics, including the company-adjusted EBIT and Free Cash Flow.
The dividend safety part checks Ford's forward dividend with respect to the company-guided EBIT and FCF.
$9.90 for 1 year of customer support and re-download.
Unlimited query and lifetime usage.
Get the Ford Valuation & Dividend Safety Spreadsheet for only $9.90 now!
Read Here About The T&Cs Before Making The Purchase
- You need to have Microsoft Excel (Version 2007 and onward) installed on your PC to use this spreadsheet.
- The Excel spreadsheet has ONLY been tested on Windows. NOT sure if the Mac version will work.
- The Ford Motor Valuation Excel Spreadsheet requires an internet connection to work.
- Also, you need to enable Macro (a set of automation) in the Excel spreadsheet as it relies on Macro to fetch stock prices and fundamental data over the internet.
- Do note that there is NO refund for the purchase as the product is a digital product in which it cannot be refunded.
- Please provide a valid email as the download link will be sent to your email.
- For any inquiries, you can send an email to support@stockdividendscreener.com.