Ford River Rouge Complex, Dearborn, MI. Image source: Flickr
Cash is the lifeline of a business.
It is no exception for Ford Motor (NYSE: F), an automaker that specializes in the design and manufacture of cars, trucks, and SUVs.
Cash is even more critical for Ford Motor because the company runs a capital-intensive operation and returns a large amount of cash to shareholders in the forms of dividends and stock buybacks.
Ford spends tonnes of cash on factories, equipment, offices, warehouses, and workers every quarter. At the same time, the company also generates a massive amount of operating and free cash flow.
Ford’s operating cash flow can come in at tens of billions of dollars while free cash flow is in the billions. Ford produced an even higher operating cash flow during the COVID-19 crisis, illustrating how incredible the company is in generating cash flow.
Therefore, it is an understatement to say that Ford is a cash cow.
In this article, we are covering several of Ford’s cash metrics, which include cash on hand, operating cash flow, free cash flow, and net cash from financing activities to see how the company’s cash positions have changed over the years.
Let’s take a look!
Investors interested in Ford’s liquidity and debt may find more information on these pages: Ford liquidity and Ford debt.
Please use the table of contents to navigate this page.
Table Of Contents
Definitions And Overview
O2. How Does Ford Spend Its Cash?
Consolidated Results
A1. Cash On Hand
Type Of Cash
Ratio
C1. Cash On Hand To Current Assets Ratio
Cash Flow
D1. Net Cash From Operations
D2. Free Cash Flow
D3. Adjusted Free Cash Flow
Cash Flow Margins
E1. Operating Cash Flow Margin
E2. Free Cash Flow Margin
E3. Adjusted Free Cash Flow Margin
Cash From Debt Borrowing And For Debt Repayment
F1. Net Cash From Financing Activities
Conclusion And Reference
S1. Conclusion
S2. References and Credits
S3. Disclosure
Definitions
To help readers understand the content better, the following terms and glossaries have been provided.
Free Cash Flow: Free cash flow (FCF) is a financial metric representing a company’s cash generated after accounting for the cash outflows needed to support operations and maintain its capital assets.
Essentially, it’s the excess cash the company produces after paying for its operating expenses and capital expenditures.
Free cash flow is a crucial indicator of a company’s financial health and its ability to generate sufficient cash to support its business, invest in growth opportunities, pay dividends to shareholders, and reduce debt. It is calculated as:
[ {Free Cash Flow} = {Net Cash from Operating Activities} – {Capital Expenditures} ]
Investors and analysts often use this metric to assess a company’s profitability, efficiency, and potential for growth and expansion.
Cash Flow Margin: The cash flow margin is a financial metric measuring the efficiency of a company in converting its sales into cash.
It’s expressed as a percentage and calculated by dividing the cash flow from operating activities by the net sales or revenue of the company.
This ratio provides insights into the company’s ability to generate cash from its sales. It is crucial for covering its expenses, paying down debt, and funding new investments without relying on external financing.
A higher cash flow margin indicates that the company is efficiently managing its operations to produce more cash, which is a positive sign for investors and creditors. It’s a useful indicator of the company’s financial health and operational efficiency.
Net Cash From Financing Activities: Net Cash from Financing Activities refers to the section of a company’s cash flow statement showing the net cash flows used to fund the company.
This includes transactions involving equity, debt, and dividends. Specifically, it captures the inflow of cash from investors or banks and the outflow of cash to shareholders as dividends or to repay debt obligations.
The calculation of net cash from financing activities includes issuing stock, debt issuance, dividend payments, and debt repayment. It is a crucial component for understanding how a company finances its operations and growth, indicating whether it generates more cash than it uses or vice versa.
This metric is essential to a company’s financial health and provides investors with insight into its financial strategy and ability to manage its capital structure effectively.
How Does Ford Spend Its Cash?
Ford Motor Company allocates its cash in several key areas to ensure sustainable growth, operational efficiency, and shareholder value. These areas include:
1. **Research and Development (R&D):** A significant portion of Ford’s cash is invested in research and development to innovate and improve their vehicle lineup, including developing electric vehicles (EVs), autonomous vehicles, and other cutting-edge technologies.
2. **Capital Expenditure (CapEx):** This includes investments in property, plants, and equipment to expand manufacturing capabilities, improve production efficiencies, and maintain the competitiveness of their facilities worldwide.
3. **Debt Repayment:** Ford manages its cash flow to meet debt obligations, reducing interest expenses and improving its credit rating, which can lower future borrowing costs.
4. **Dividends:** To reward shareholders, Ford allocates a portion of its cash to pay dividends, which can help attract and retain investors.
5. **Share Buybacks:** Ford may sometimes use its cash to buy back shares of its own stock, aiming to boost shareholder value by increasing earnings per share and reducing the total share count.
6. **Strategic Acquisitions:** Ford occasionally uses cash to acquire companies that can complement its existing business lines, drive growth, or enhance technological capabilities.
7. **Liquidity Reserves:** Maintaining a healthy cash reserve is crucial for Ford to navigate economic downturns, unexpected expenses, or investment opportunities without needing immediate external financing.
By strategically managing its cash across these areas, Ford aims to stay competitive, drive innovation, and create long-term value for its stakeholders.
Cash On Hand
Ford Motor’s cash on hand
(click image to expand)
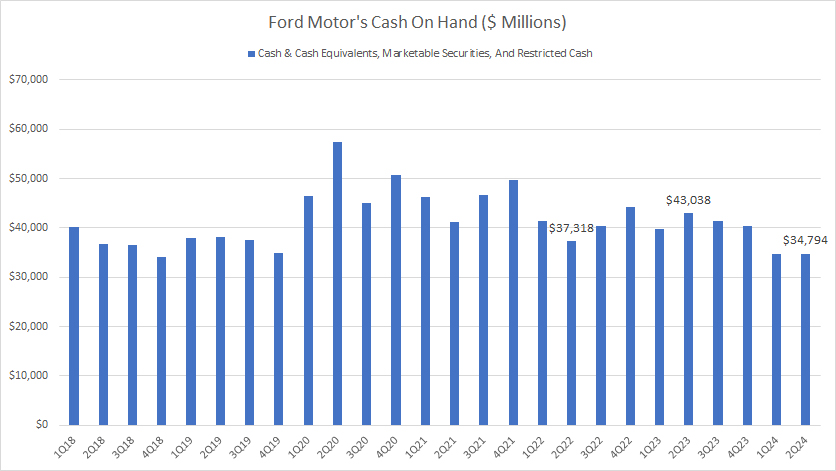
Ford’s cash on hand presented in the chart above consists of cash and cash equivalents, restricted cash, and marketable securities.
Liquid assets such as cash and cash equivalents can be deployed instantly while marketable securities are available for deployment within a year.
Ford’s cash on hand has appeared to be stable over the years and has stayed between $30 billion and $40 billion in most quarters.
However, in fiscal 2020, Ford’s cash on hand temporarily soared beyond $40 billion and even exceeded $50 billion in 2Q 2020, most likely driven by the COVID-19 disruption during the onset of the pandemic.
In subsequent quarters, Ford’s cash on hand has declined below its pre-COVID levels, which is roughly $35 billion.
Cash On Hand Breakdown
Ford Motor’s cash on hand breakdown
(click image to expand)
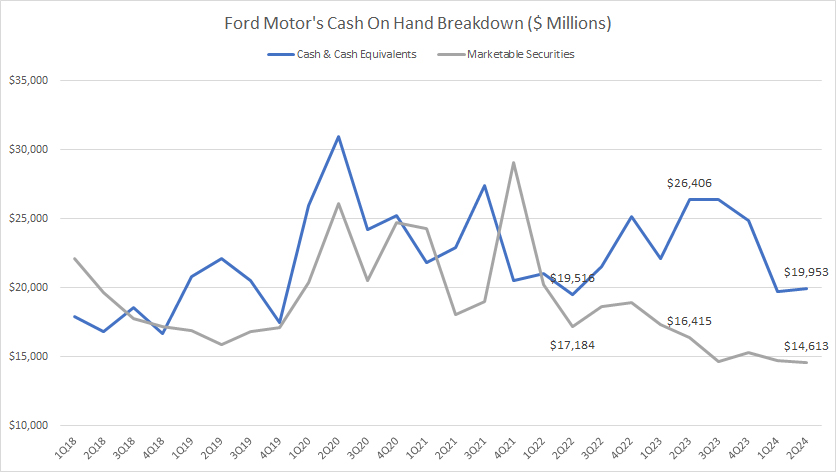
Ford’s cash on hand comes primarily from 2 components and they are cash and cash equivalents and marketable securities.
Ford’s restricted cash is negligible and is not shown in the chart above.
Accordingly, the amount of Ford’s cash and cash equivalents is slightly above marketable securities in most quarters.
Since 2018, Ford’s cash and cash equivalents have been steadily on the rise, topping $20 billion as of 2Q 2024 which was quite a significant number compared to historical results.
On the other hand, Ford’s marketable securities have remained roughly the same in the periods shown.
As of 2Q 2024, Ford’s marketable securities topped $14.6 billion, one of the record lows ever reported.
Cash On Hand To Current Assets Ratio
Ford Motor’s cash on hand to current assets ratio
(click image to expand)
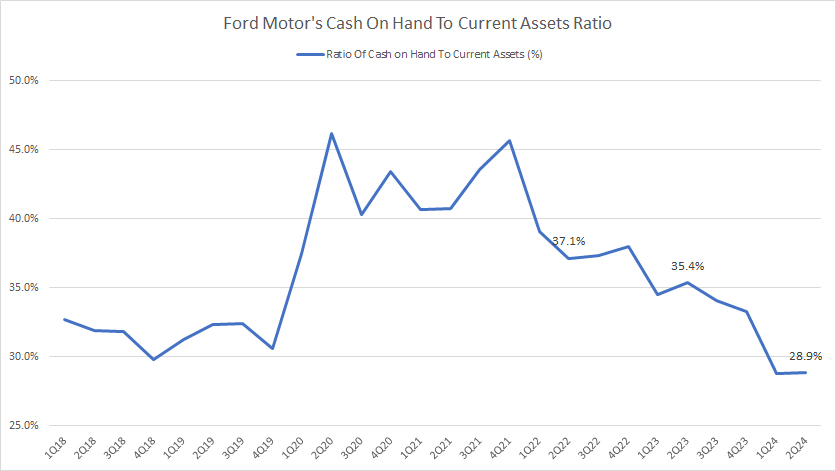
To find out the magnitude of Ford’s cash on hand, we have to inspect it from the perspective of the company’s current assets.
As of 2Q 2024, Ford’s cash on hand to current assets ratio remained high at 29%, a significantly low ratio.
Although the ratio has been considerably low in recent periods, it is approaching the pre-COVID level which is roughly at 30%.
In other words, Ford’s total cash made up only about 30% of its current assets in fiscal year 2024.
Net Cash From Operations
Ford’s operating cash flow
(click image to expand)
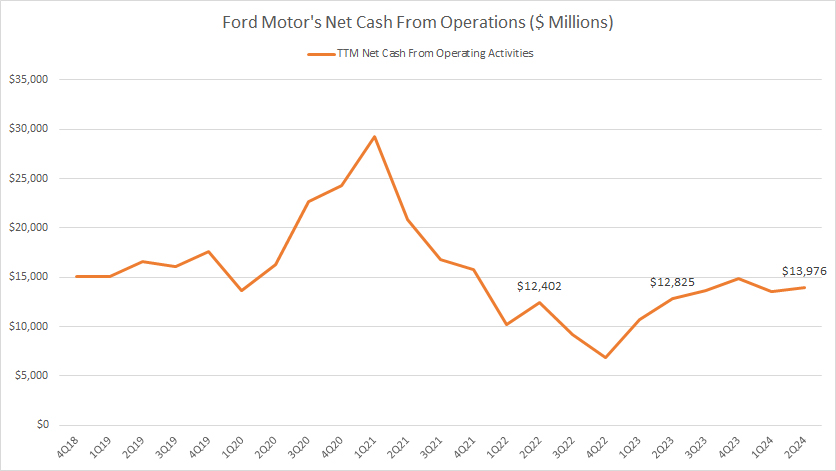
Ford produces positive net cash from operations in all quarters irrespective of any disruptions, including the COVID-19 crisis, material shortages, an inflationary environment, etc.
Ford produced an even higher net cash from operations during the pandemic which topped nearly $30 billion at one time.
Ford’s solid operating cash flow is certainly a factor that most investors want to see.
As of 2Q 2024, Ford generated as much as $14 billion of net cash from operations, though significantly lower than those measured during the pandemic, it was still an incredible feat by all measures.
In short, Ford Motor has been positive in operating cash flow generation and is a solid cash flow provider.
Free Cash Flow
Ford Motor’s free cash flow
(click image to expand)
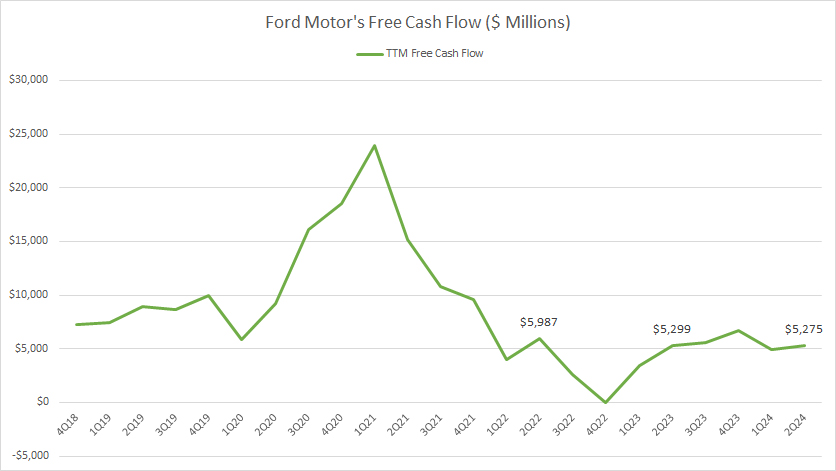
Free cash flow is operating cash flow net of capital expenditures. The definition of free cash flow is available here: free cash flow.
Ford’s free cash flow has a similar trend as that of the net cash from operations.
More importantly, Ford produces positive free cash flow in all quarters, the same factor that all shareholders want the company to have.
As of 2Q 2024, Ford’s free cash flow came in at over $5 billion, still a significant figure by all measures.
In short, Ford is a solid free cash flow producer.
Adjusted Free Cash Flow
Ford Motor’s adjusted free cash flow
(click image to expand)
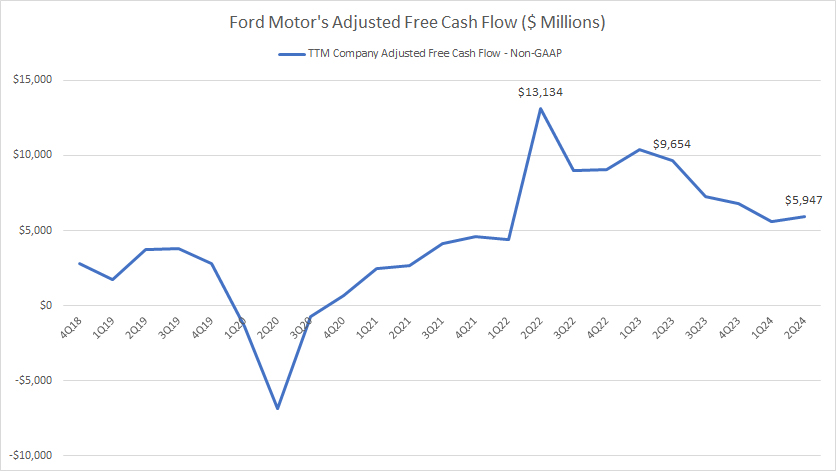
Ford’s adjusted free cash flow is primarily the cash flow from the automotive segment and is provided in all quarterly earnings releases.
Here is the equation for Ford’s adjusted free cash flow:
Adjusted free cash flow = Consolidated net cash from operations – Net cash from operations by Ford Credit – Capital spending + Ford Credit cash dividends payable to the company
Ford’s adjusted free cash flow differs from those we saw in prior discussions.
For example, Ford’s adjusted free cash flow nearly dried up during the pandemic but recovered tremendously during post-pandemic times.
The destruction of Ford’s adjusted free cash flow during the pandemic indicates that Ford’s automotive segment was deeply impacted by the COVID-19 crisis.
Nevertheless, Ford’s adjusted free cash flow has slowly recovered and reached record highs when the automotive business improved in post-pandemic periods.
As of 2Q 2024, Ford produced an adjusted free cash flow of nearly $6 billion, a record figure over the past 5 years.
Although the adjusted free cash flow result has recovered, it is highly cyclical and relies mainly on the automotive sector.
If automotive sales were to be negatively impacted, like how it happened in 2020, Ford’s adjusted free cash flow also would succumb.
Operating Cash Flow Margin
Ford’s operating cash flow margin
(click image to expand)
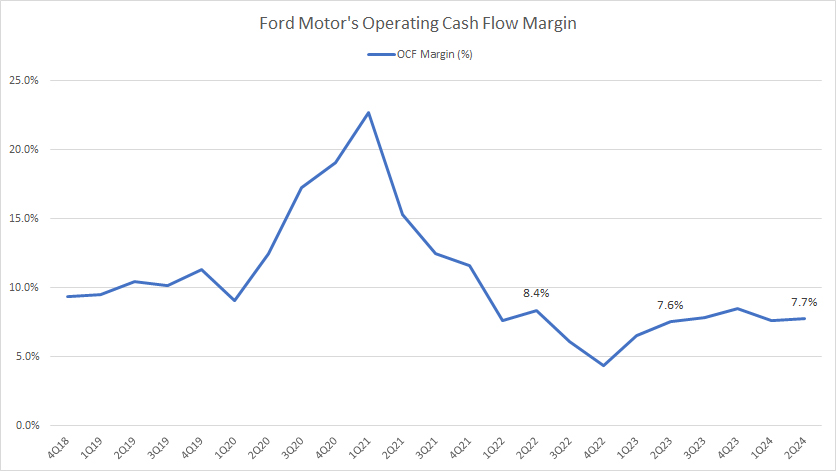
* Operating cash flow margin is the ratio of operating net cash to TTM revenue.
The operating cash flow margin measures Ford’s efficiency in turning revenue into operating cash flow. The definition of cash flow margin is available here: cash flow margin.
The ratio came in at 7.7% as of 2Q 2024 and was much lower than GM’s cash margin and Tesla’s cash margin.
Free Cash Flow Margin
Ford’s free cash flow margin
(click image to expand)
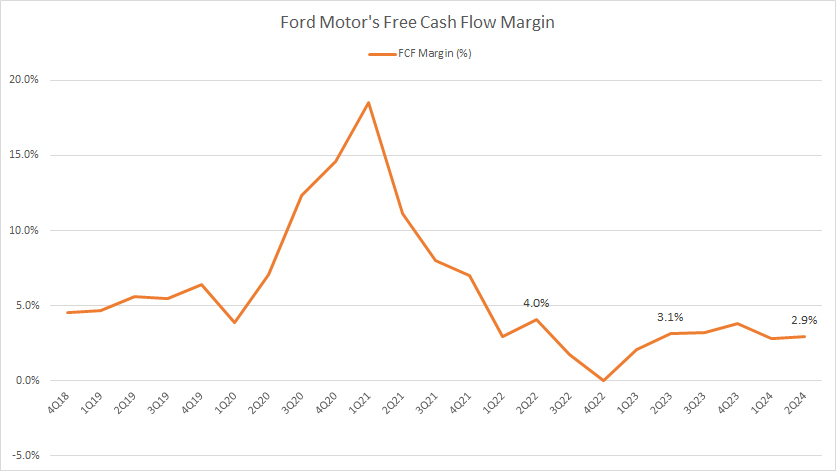
* Free cash flow margin is the ratio of free cash flow to TTM revenue.
Similarly, the free cash flow margin measures Ford’s ability to turn revenue into free cash flow. The definition of cash flow margin is available here: cash flow margin.
At a ratio of less than 5%, it seems that Ford Motor is not very good at converting revenue into free cash flow.
The ratio also is much lower than those of Tesla and General Motors (results can be found in prior discussions).
Adjusted Free Cash Flow Margin
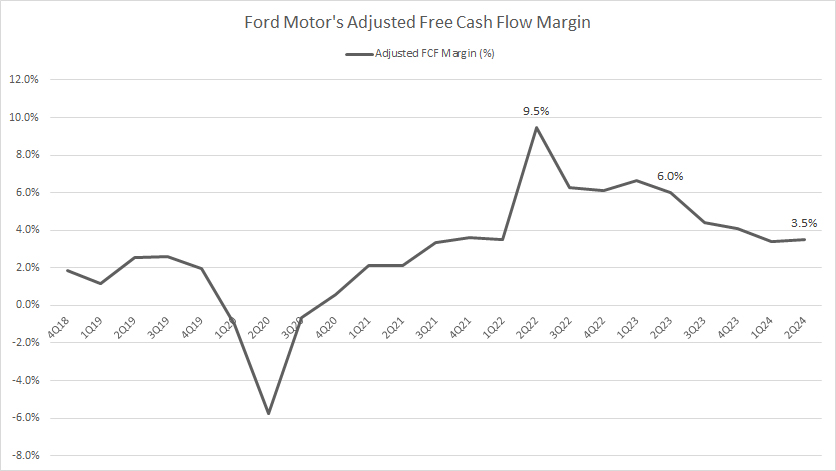
Ford’s adjusted free cash flow margin
(click image to expand)
* Adjusted free cash flow margin is the ratio of adjusted free cash flow to TTM automotive revenue.
The definition of cash flow margin is available here: cash flow margin. Although the ratio is only modest, it has significantly improved after the pandemic.
The rising margin indicates Ford’s recovering automotive business.
Net Cash from Financing Activities
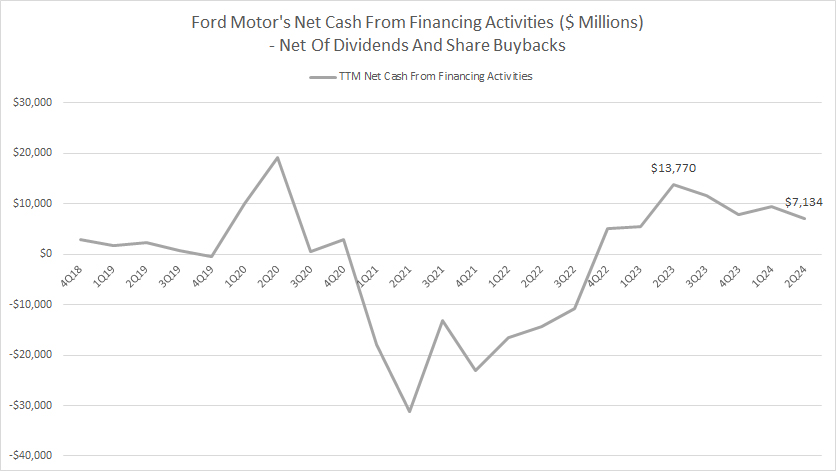
Ford Motor’s net cash from financing activities
(click image to expand)
The net cash from financing activities depicts whether cash is taken for debt repayment (negative numbers) or cash is added from borrowings (positive numbers). The definition of net cash from financing activities is available here: net cash from financing activities.
Keep in mind that the data presented in the plot above is net of cash arising from capital returns such as dividend payments and share buyback to rule out the effect of capital returns.
That said, Ford’s net cash from financing activities is mostly positive in most quarters, implying that the company is taking on more debt.
However, Ford paid down a large chuck of its debt during the pandemic between 2021 and 2022.
Ford has started to incur debt again since the start of 2023, as reflected by the positive net cash from financing activities.
Conclusion
Ford produces good cash flow but lacks the efficiency in converting cash from revenue.
References and Credits
1. All financial figures presented in this article were obtained and referenced from Ford’s SEC filings, earnings reports, news releases, shareholder presentations, quarterly and annual reports, etc., which are available in Ford’s Financials and Filings.
2. Featured images in this article are used under a Creative Commons license and sourced from the following websites: Thomas Hawk and Stefan Kellner.
Disclosure
References and examples such as tables, charts, and diagrams are constantly reviewed to avoid errors, but we cannot warrant the full correctness of all content.
The content in this article is for informational purposes only and is neither a recommendation nor a piece of financial advice to purchase a stock.
If you find the information in this article helpful, please consider sharing it on social media and also provide a link back to this article from any website so that more articles like this one can be created in the future.
Thank you!

