
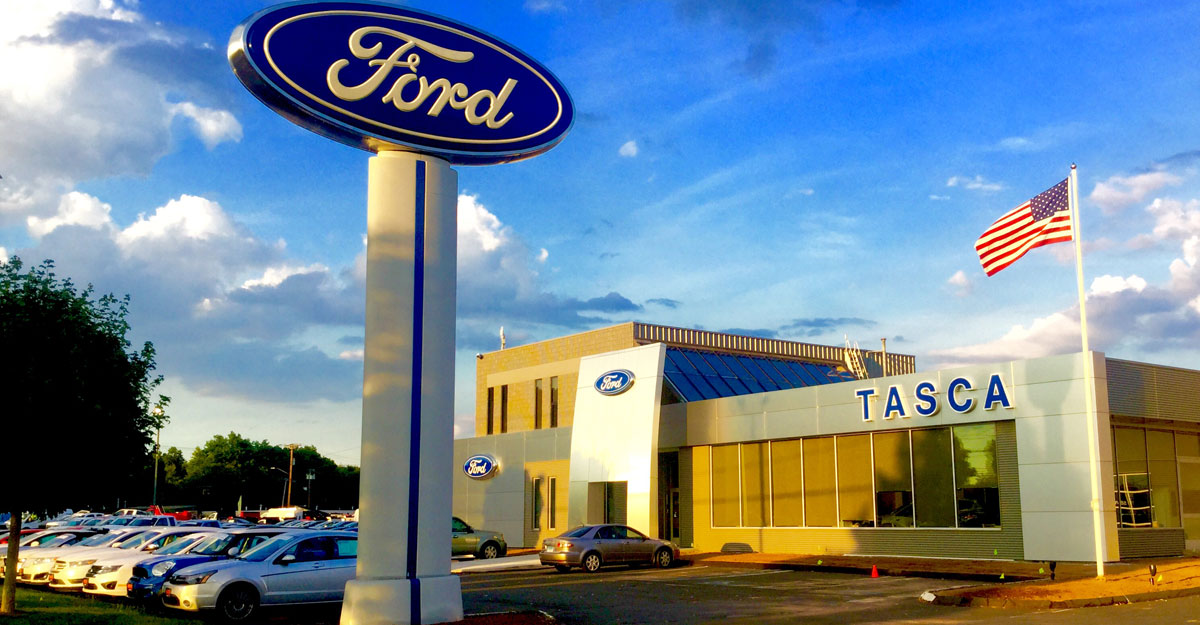
Ford dealership. Source: Flickr
This page covers Ford Motor’s capital returns, consisting of repurchases of common stocks and dividends paid.
Let’s check out the results!
For other key statistics of Ford Motor, you may find more resources on this page: Ford Motor key stats.
Please use the table of contents to navigate this page.
Table Of Contents
Definitions And Overview
Insight & Summary of Observed Trends
Z1. Insight & Summary of Ford Motor’s Capital Returns Analysis
Capital Returns Results
A1. Stock buyback, dividends paid, and cash flow numbers
A2. Stock buyback, dividends paid, and cash flow growth
Payout Ratio
B1. Stock buyback and dividends paid as % of free cash flow
B2. Stock buyback and dividends paid as % of company-adjusted free cash flow
Reference, Credits, and Disclosure
S1. References and Credits
S2. Disclosure
Definitions
To help readers understand the content better, the following terms and glossaries have been provided.
Free Cash Flow Payout Ratio:
The FCF payout ratio is a capital-return coverage metric that measures what percentage of a company’s free cash flow is being returned to shareholders through dividends, expressed as a formula:
Free Cash Flow Payout Ratio = Dividends Paid ÷ Free Cash Flow
What it measures
The ratio shows how much of the cash a company generates after covering its operating expenses and capital expenditures is being paid out as dividends, versus how much is being retained for other uses (debt paydown, buybacks, acquisitions, reinvestment, or simply building cash reserves).
How to interpret it
A low ratio (e.g., 20-40%) suggests dividends are well-covered by cash flow, with substantial room remaining for the company to increase the dividend, pursue buybacks, or absorb a temporary cash flow downturn without endangering the payout.
A ratio approaching or exceeding 100% signals the company is paying out most or all of its free cash flow as dividends — leaving little cushion. A ratio above 100% means the company is paying more in dividends than it’s generating in free cash flow, which is unsustainable over the long run unless funded by debt, asset sales, or existing cash reserves.
A negative or undefined ratio occurs when free cash flow itself is negative (the company isn’t generating positive cash flow at all), which is a red flag regardless of dividend policy, since any dividend in that scenario is effectively being funded from the balance sheet rather than organic cash generation.
Why it matters for dividend safety analysis
This metric is one of the more direct ways to assess dividend sustainability, because it uses free cash flow — actual cash generated after both operating costs and the capital investment needed to maintain and grow the business — rather than net income, which can be distorted by non-cash items like depreciation, stock-based compensation, or one-time charges. A company can show healthy net income while still straining to cover its dividend in cash terms, so the free cash flow payout ratio often gives a more conservative and realistic read on whether a dividend is safe, at risk, or has room to grow.
Company-Adjusted Free Cash Flow: Company Adjusted Free Cash Flow (FCF) is Ford’s non-GAAP measure of operating cash flow performance, most closely comparable to the GAAP measure “Net Cash Provided By/(Used In) Operating Activities.”
How it’s defined: it measures the Company’s operating cash flow excluding Ford Credit’s operating cash flows. It includes elements management considers core operating activities — Company excluding Ford Credit capital spending, Ford Credit distributions to its parent, and settlement of derivatives — while excluding cash outflows for funded pension contributions, restructuring actions, and other items that are considered operating cash flows under GAAP but that management doesn’t view as reflective of underlying operating performance.
Why Ford uses it: the company considers this measure more useful to investors than the raw GAAP operating cash flow figure because it strips out Ford Credit’s financing-driven cash flows (which behave very differently from the Automotive business) and smooths out lumpy, non-operating items like pension funding and restructuring charges — giving a cleaner read on how much cash the core auto business is actually generating.
Insight & Summary of Ford Motor’s Capital Returns Analysis
The following analysis consolidates the trends observed across Ford Motor’s capital returns for the 2014–2025 period.
-
Cash Flow Foundation: A Volatile but Generally Growing Base Operating cash flow grew unevenly from $14.5 billion in 2014 to a period high of $24.3 billion in 2020 — boosted by pandemic-era working-capital dynamics — before falling sharply to $6.9 billion in 2022, its lowest point in the dataset, and recovering to $21.3 billion by 2025. Free cash flow followed an even more extreme path: it swung from a healthy $18.5 billion in 2020 to essentially breakeven at -$13 million in 2022, before rebounding to $12.5 billion by 2025. This 2022 near-zero FCF print is a critical data point, because it distorts the 2023 FCF growth calculation (a mathematically correct but practically meaningless -51,500%, since dividing by a near-zero base produces an extreme result) — the underlying $6.7 billion 2023 FCF recovery is the meaningful takeaway, not the percentage.
-
Two Different Cash Flow Lenses Tell Different Stories Company-Adjusted Free Cash Flow — which strips out Ford Credit’s operating cash flows — tells a notably different story than headline FCF. It peaked early, at $7.3 billion in 2015, declined through most of the following years to a low of $1.3 billion in 2020 (the opposite direction of headline FCF that same year, reflecting Ford Credit’s cash flow swings), then rebounded to $9.1 billion in 2022 — again diverging sharply from headline FCF’s near-zero print that same year. This divergence underscores that Ford Credit’s financing-driven cash flows can move independently of, and sometimes opposite to, the Automotive business’s cash generation.
-
Stock Buybacks: Effectively Paused for Half the Period Share repurchases were substantial only in 2014 ($2.0 billion), then collapsed by 93.4% in 2015 and stayed minimal (under $250 million annually) through 2019. Buybacks were suspended entirely in 2020–2021, resumed modestly in 2022–2024 (peaking at $484 million in 2022), and were suspended again in 2025. Across the full period, buybacks were a consistently minor use of cash relative to dividends — never exceeding 6.4% of Company-Adjusted FCF in any year with a governed program, and 0% in four separate years.
-
Dividends: The Dominant and More Volatile Capital Return Dividends paid ranged from a low of $403 million (2021, still recovering from pandemic-era suspension) to a high of $5.0 billion (2023), and represented the clear majority of capital returned to shareholders throughout the period. As a share of Company-Adjusted FCF, dividend payout ratios were often striking — exceeding 100% in 2018 (104.5%) and approaching it in 2019 (83.5%) and 2025 (85.1%), meaning Ford returned more in dividends than its adjusted free cash flow generated in those years, funded by balance sheet flexibility rather than in-year cash generation alone.
-
Cross-Metric Comparison: FCF vs. Company-Adjusted FCF as the Denominator The choice of cash flow denominator materially changes the payout-ratio narrative. Using headline FCF, Total Capital Returns as a percentage of FCF ranged from a low of 3.2% (2020) to a high of 79.8% (2023) — with 2022 undefined given the near-zero FCF base. Using Company-Adjusted FCF instead, the same relationship swings far more dramatically, from 8.8% (2021) to 110.4% (2018), reflecting how much smaller and more volatile the adjusted FCF base is relative to headline FCF in most years. Executives and investors should treat the two payout ratios as answering different questions: FCF-based ratios show sustainability against total company cash generation (including Ford Credit), while Company-Adjusted FCF-based ratios show sustainability against the Automotive-driven cash flow base management itself targets.
-
Structural Takeaway: Ford’s capital return policy has been dividend-led throughout the period, with buybacks serving as a secondary, frequently-suspended lever rather than a consistent return mechanism. The dividend has repeatedly been sized above what Company-Adjusted FCF alone would support in a given year (2018, 2019, 2025), signaling management’s willingness to smooth shareholder distributions across the cycle rather than tie them strictly to single-year adjusted cash generation. Given 2025’s Company-Adjusted FCF of $3.5 billion against $3.0 billion in dividends (an 85.1% payout ratio) and zero buybacks, the sustainability of the current dividend level — rather than any near-term return of buyback activity — is the key capital-allocation variable to watch into 2026.
The table below combines all key Ford Motor’s capital returns metrics – stock buyback and dividends – into a single view for the latest three fiscal years.
Ford Motor’s Capital Returns — Averages (FY2023–FY2025)
| Metric | 3-Year Average (FY2023–FY2025) |
|---|---|
| Capital Returns and Cash Flow Numbers | |
| Purchases of Common Stock | $254M |
| Dividends Paid | $3,701M |
| Net Cash from Operating Activities | $17,208M |
| Capital Expenditures | $8,578M |
| Free Cash Flow | $8,629M |
| Company-Adjusted Free Cash Flow | $5,662M |
| Capital Returns and Cash Flow Growth | |
| Purchases of Common Stock | -34.5% |
| Dividends Paid | 35.6% |
| Net Cash from Operating Activities | 53.0% |
| Capital Expenditures | 9.0% |
| Free Cash Flow | 43.0% |
| Company-Adjusted Free Cash Flow | -24.8% |
| Payout Ratio (as % of FCF) | |
| Stock Buyback as % of FCF | 3.8% |
| Dividends Paid as % of FCF | 48.4% |
| Total Capital Returns as % of FCF | 52.1% |
| Payout Ratio (as % of Company-Adjusted FCF) | |
| Stock Buyback as % of Company-Adjusted FCF | 3.8% |
| Dividends Paid as % of Company-Adjusted FCF | 68.4% |
| Total Capital Returns as % of Company-Adjusted FCF | 72.2% |
Averages cover FY2023–FY2025. Growth rounded to one decimal place. Free Cash Flow growth for FY2023 is treated as N/A, since FY2022’s near-zero FCF base (-$13M) makes a percentage change mathematically meaningless; the Free Cash Flow growth average above therefore reflects only FY2024–FY2025.
Stock buyback, dividends paid, and cash flow numbers
Capital Returns and Cash Flow Numbers — Averages (FY2023–FY2025)
| Metric | 3-Year Average (FY2023–FY2025) |
|---|---|
| Purchases of Common Stock | $254M |
| Dividends Paid | $3,701M |
| Net Cash from Operating Activities | $17,208M |
| Capital Expenditures | $8,578M |
| Free Cash Flow | $8,629M |
| Company-Adjusted Free Cash Flow | $5,662M |
Averages cover FY2023–FY2025. Currency figures rounded to nearest whole unit.
Stock buyback, dividends paid, and cash flow growth
Capital Returns and Cash Flow Growth — Averages (FY2023–FY2025)
| Metric | 3-Year Average (FY2023–FY2025) |
|---|---|
| Purchases of Common Stock | -34.5% |
| Dividends Paid | 35.6% |
| Net Cash from Operating Activities | 53.0% |
| Capital Expenditures | 9.0% |
| Free Cash Flow | 43.0% |
| Company-Adjusted Free Cash Flow | -24.8% |
Averages cover FY2023–FY2025. Growth rounded to one decimal place. Free Cash Flow growth for FY2023 is treated as N/A, since FY2022’s near-zero FCF base (-$13M) makes a percentage change mathematically meaningless; the Free Cash Flow growth average above therefore reflects only FY2024–FY2025.
Stock buyback and dividends paid as % of free cash flow
The definition of Ford’s payout ratio is available here : free cash flow payout ratio.
Payout Ratio (as % of FCF) — Averages (FY2023–FY2025)
| Metric | 3-Year Average (FY2023–FY2025) |
|---|---|
| Stock Buyback as % of FCF | 3.8% |
| Dividends Paid as % of FCF | 48.4% |
| Total Capital Returns as % of FCF | 52.1% |
Averages cover FY2023–FY2025. Ratios rounded to one decimal place.
Stock buyback and dividends paid as % of company-adjusted free cash flow
The definition of Ford’s company-adjusted free cash flow is available here : company-adjusted-free cash flow.
Payout Ratio (as % of Company-Adjusted FCF) — Averages (FY2023–FY2025)
| Metric | 3-Year Average (FY2023–FY2025) |
|---|---|
| Stock Buyback as % of Company-Adjusted FCF | 3.8% |
| Dividends Paid as % of Company-Adjusted FCF | 68.4% |
| Total Capital Returns as % of Company-Adjusted FCF | 72.2% |
Averages cover FY2023–FY2025. Ratios rounded to one decimal place.
References and Credits
1. All financial figures presented in this article were obtained and referenced from Ford Motor’s quarterly and annual reports, investor presentations, press releases, earnings reports, news, etc., which are available in the following link: Ford’s Financials and Filings.
2. Pexels Images.
Back To Table Of Contents
Disclosure
We may use artificial intelligence (AI) tools to assist us in writing some of the text in this article. However, the data is directly obtained from original sources (usually the quarterly and annual reports) and meticulously cross-checked by our editors multiple times to ensure its accuracy and reliability.
If you find the information in this article helpful, please consider sharing it on social media. Additionally, providing a link back to this article from any website can help us create more content like this in the future.
Thank you for your support and engagement! Your involvement helps us continue to provide high-quality, reliable content.
Thank you!
I stuck with Ford, but share dilution, a treading water stock price, and now no dividend has been a body blow. Very, very disappointed in Ford. Compared to Tesla, a company Ford wishes to challenge, one share of Ford is 13.90 compared to 722 for Tesla, a paltry 1.925 percent of Tesla’s stock price. Lots of talk, betrayal of investors.