Curved road. Pexels Image.
This article presents BYD’s sales revenue by country or region.
For your information, BYD derives its revenue primarily from China. However, its revenue stream outside of China has significantly increased, contributing close to 29% of the total as of 2024.
Let’s get into the details!
For other key statistics of BYD, you may find more information on these pages:
Sales
- BYD global car sales,
- BYD commercial vehicle sales,
- BYD sales breakdown of nev,
- BYD electric and hybrid vehicle sales
Revenue
Profit Margin
- BYD profitability, vehicle margin, and profit per car,
- BYD vs Tesla: vehicle profit and margin analysis
R&D Budget
Please use the table of contents to navigate this page.
Table Of Contents
Definitions And Overview
Revenue By Country/Region
A1. Revenue from China and Overseas
A2. Revenue from China and Overseas In Percentage
Growth Rates
B1. Growth Rates of Revenue from China and Overseas
Conclusion And Reference
S1. Insight
S2. References and Credits
S3. Disclosure
Definitions
To help readers understand the content better, the following terms and glossaries have been provided.
Renminbi (RMB): Renminbi or RMB is the official currency of the People’s Republic of China. The primary unit of the renminbi is the yuan. The symbol for the Chinese Yuan Renminbi is CN¥ or simply ¥.
BYD Company uses the Renminbi (RMB) for its financial transactions and reporting. The current exchange rate for the Chinese Yuan (CN¥) to the US Dollar (USD) is approximately 7.22 CN¥ for 1 USD.
Revenue from China and Overseas
BYD-revenue-from-China-and-overseas
(click image to expand)
BYD uses the Renminbi (RMB), also known as the Yuan (CNY), for its financial transactions and reporting. The exchange rate that I used for converting the RMB to USD is available here: Renminbi (RMB).
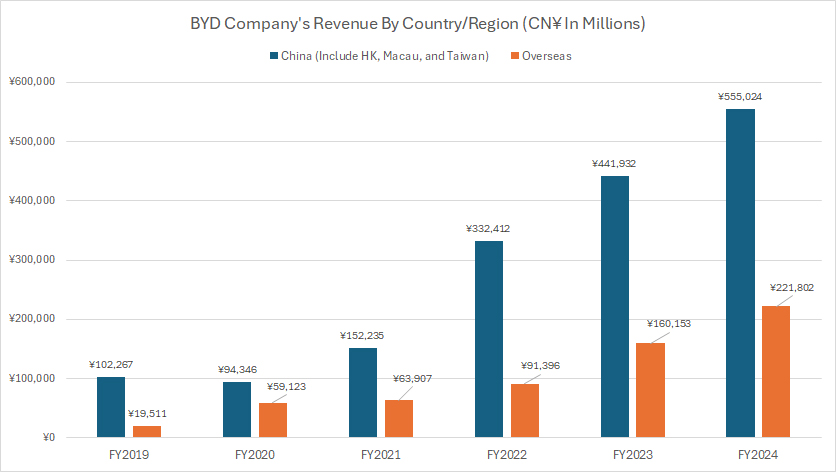
BYD generates a significant portion of its revenue from China, which includes Hong Kong, Macau, and Taiwan, as shown in the chart above.
BYD also earns significant revenue outside of China and this portion of revenue from overseas has been on the rise over the past several years.
The following shows a detailed result:
Revenue in FY2024:
| Region | Revenue |
|---|---|
| (CN¥ Billions) | |
| China | CN¥555.0 (US$76.9) |
| Overseas | CN¥221.8 (US$30.8) |
3-Year Trend from FY2021 to FY2024:
| Region | Revenue | % Changes |
|---|---|---|
| (CN¥ Billions) | ||
| China | CN¥152.2 to CN¥555.0 | +264.6% |
| Overseas | CN¥63.9 to CN¥221.8 | +247.1% |
5-Year Trend from FY2019 to FY2024:
| Region | Revenue | % Changes |
|---|---|---|
| (CN¥ Billions) | ||
| China | CN¥102.3 to CN¥555.0 | +442.7% |
| Overseas | CN¥19.5 to CN¥221.8 | +1036.8% |
Revenue from China and Overseas In Percentage
BYD-revenue-from-China-and-overseas-in-percentage
(click image to expand)
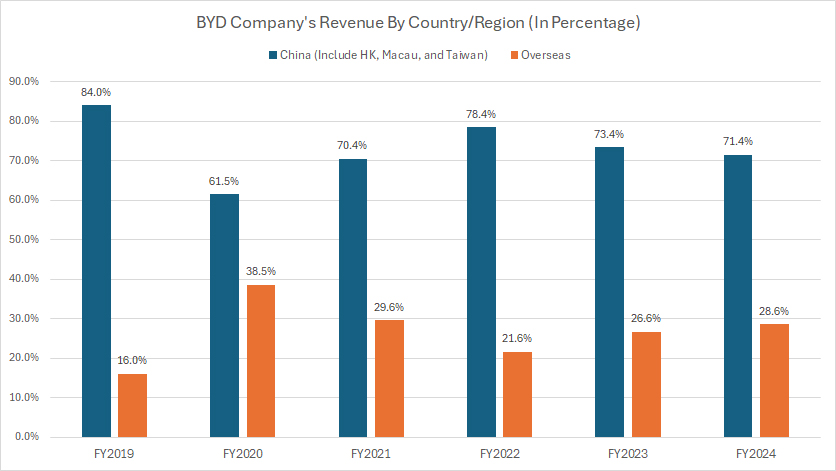
BYD’s China revenue accounts for the majority of its total revenue, as presented in the graph above. However, the revenue share from Overseas has been on the rise, reaching a record figure in the past three years.
The following shows a detailed result:
Revenue Share in FY2024:
| Region | Revenue Share (%) |
|---|---|
| China | 71.4% |
| Overseas | 28.6% |
3-Year Trend from FY2021 to FY2024:
| Region | Revenue Share (%) | % Point Changes |
|---|---|---|
| China | 70.4% to 71.4% | +1.0% |
| Overseas | 29.6% to 28.6% | -1.0% |
5-Year Trend from FY2019 to FY2024:
| Region | Revenue Share (%) | % Point Changes |
|---|---|---|
| China | 84.0% to 71.4% | -12.5% |
| Overseas | 16.0% to 28.6% | +12.5% |
Growth Rates of Revenue from China and Overseas
BYD-growth-rates-of-revenue-from-China-and-overseas
(click image to expand)
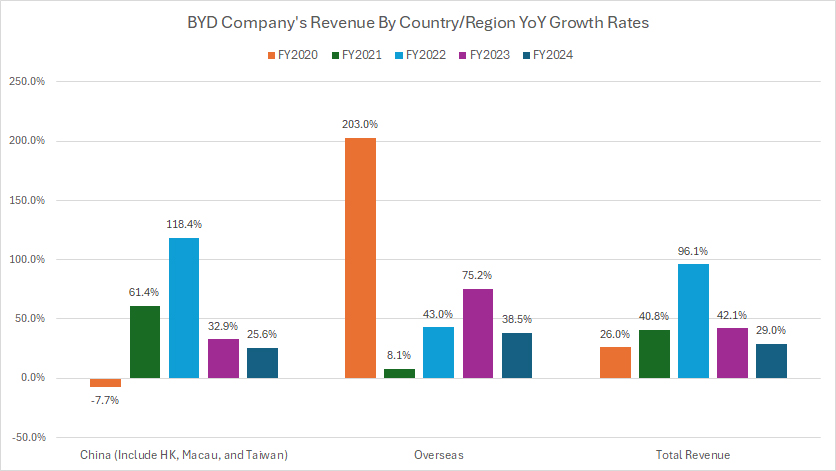
BYD has experienced significant revenue growth across all countries and regions, China in particular, as shown in the chart above.
The following shows a detailed result:
Growth Rates in FY2024:
| Region | Growth Rates (%) |
|---|---|
| China | +25.6% |
| Overseas | +38.5% |
| Consolidated | +29.0% |
3-Year Average Growth Rate from FY2022 to FY2024:
| Region | Growth Rates (%) |
|---|---|
| China | +59.0% |
| Overseas | +52.2% |
| Consolidated | +55.7% |
5-Year Average Growth Rates from FY2020 to FY2024:
| Region | Growth Rates (%) |
|---|---|
| China | +46.1% |
| Overseas | +73.6% |
| Consolidated | +46.8% |
Insight
BYD’s revenue composition has undergone a substantial transformation in recent years, with overseas markets playing an increasingly pivotal role. While China remains the dominant contributor to its financial performance, international revenue has surged significantly.
BYD’s expansion beyond China reflects its strategic emphasis on diversifying revenue streams and capitalizing on the global adoption of electric vehicles.
The company’s accelerated revenue growth in overseas markets suggests it is successfully penetrating international markets and gaining traction among global consumers.
However, China remains the backbone of its financial strength, indicating that domestic performance is still critical to sustaining its overall profitability
Essentially, BYD’s international business is becoming increasingly significant, with strong growth momentum outside China.
While the domestic market continues to drive the bulk of its financial results, the company’s global expansion efforts are yielding substantial returns, reinforcing its position as a leading player in the electric vehicle industry worldwide.
References and Credits
1. All financial figures presented were obtained and referenced from BYD’s quarterly and annual reprots published on the company’s investor relations page: BYD Latest Announcement.
2. Pexels Images.
Disclosure
We may use artificial intelligence (AI) tools to assist us in writing some of the text in this article. However, the data is directly obtained from original sources and meticulously cross-checked by our editors multiple times to ensure its accuracy and reliability.
If you find the information in this article helpful, please consider sharing it on social media. Additionally, providing a link back to this article from any website can help us create more content like this in the future.
Thank you for your support and engagement! Your involvement helps us continue to provide high-quality, reliable content.


