Our Mission
Let’s face it. The financial statements are ugly and complicated. They are difficult to read because they are long and full of jargons. Nobody wants to read them, let alone deal with them.
For this reason, our organization is set up to transform these ugly and complex financial statements into simplified contents such as charts, graphs, diagrams, etc that can be easily understood and digested.
About Our Organization
Often times when we want to analyze a company financial health, we will most likely visit popular financial websites such as Yahoo Finance, MorningStar, MarketWatch, MacroTrends and so on to get the financial data provided to do the analysis of the companies that we are interested to invest in the stocks.
We will look at the financial data such as the revenue, profit, cash flow and so on. Besides, we may also look at the financial ratio such as the current ratio, gross margin, profit margin, inventory turnover ratio, return on invested capital, etc.
But how often do we think about the accuracy and reliability of these data provided by Yahoo Finance, MorningStar, MarketWatch, etc. The other way of asking is are we using the correct financial data provided by these websites. Do you trust these data?
For example, let’s look at the Ford Motor(F) quarterly data provided by MorningStar: MorningStar Ford Motor Quarterly Balance Sheet Data. I have provided a snapshot of the data below:
Ford quarterly balance sheet data provided by MorningStar
From the snapshot, when you look at the receivables in the current asset of the balance sheet, you will notice that there is a discrepancy in the data provided. For example, for the 2018-09 quarter, the number provided is $62 billion ($62,062 million) whereas the rest of the quarters (2018-06, 2018-03, 2017-12 and 2017-09) show that the receivables are in the range of $10 billion to $12 billion. As a result, they are way less than the $62 billion reported in 2018-09 data.
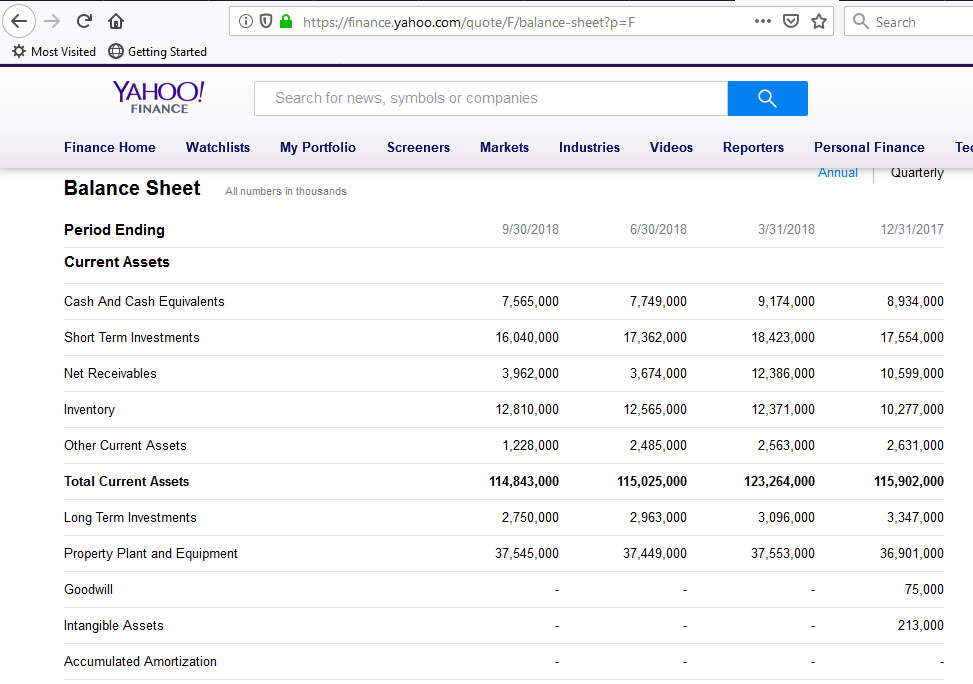
Compare these data with Yahoo Finance. Here is the link to Ford Motor Balance Sheet in Yahoo Finance: Yahoo Finance Ford Motor Balance Sheet Data. I have provided a snapshot of the data below:
Ford quarterly balance sheet data provided by Yahoo Finance
Let’s look at the Net Receivables in Yahoo Finance. You can see that the data provided is very different (except for the period 2018-03 and 2017-12) from the one provided by MorningStar that we looked at above. Which one is correct, MorningStar or Yahoo Finance?
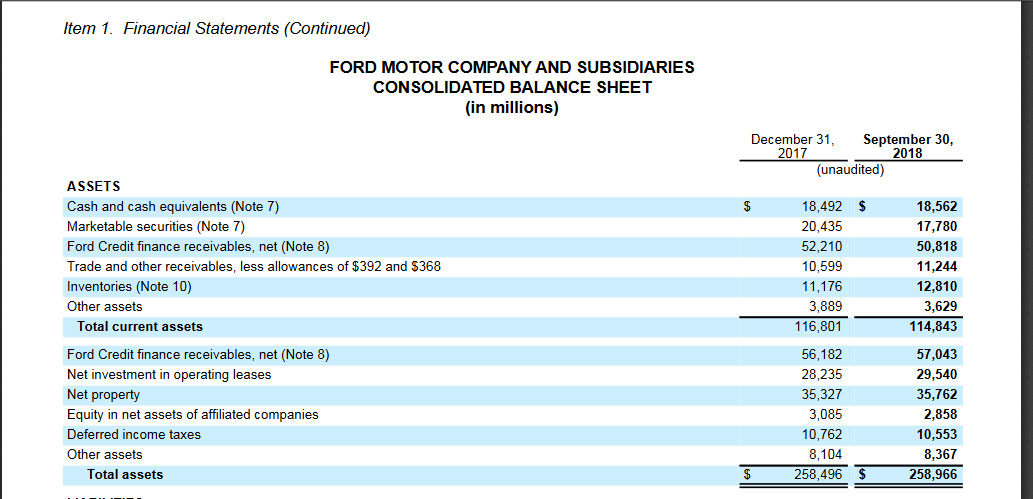
When I dig into the SEC filing by Ford Motor, the numbers are very different from the one provided by both MorningStar and Yahoo Finance. Here is a snapshot of the Ford Motor balance sheet:
Ford quarterly balance sheet data provided by Ford Motor Sec Filing
In the balance sheet above and let’s look at the Sept 30, 2018 financial data, we can see that there are two receivables in the current asset, one is the financial receivable ($50,818 billion) and the other one is the trade receivable ($11,244 billion).
Compare the numbers with the one provided by MorningStar, it looks like MorningStar has added up both receivables ($50,818 billion + $11,244 billion = $62,062 billion ) in its website for the 2018-09 financial data. But for other periods such as 2017-09, 2017-12, 2018-03 and 2018-06, MorningStar did not add up both receivables and only took the trade receivable numbers from the balance sheet and put on its website. But why did MorningStar exclude the financial receivables in its website?
In short, there is inconsistency in the data provided by both MorningStar and Yahoo Finance. If we use these data for financial analysis, we will surely get inaccurate results.
There is a gap exists where free financial data on most major websites are inaccurate and unreliable.
To fill this gap, our team has created this website. Our goal is to provide accurate and reliable data about the financial health of a publicly listed company. We differentiate ourselves with others by further breaking down the data into smaller segments for users analysis.
Take Ford Motor as an example, the revenue provided by major financial websites only show one aggregate figure which sums up all revenue segments. This makes the analysis of the company incomparable and meaningless if we look at only the total revenue without knowing what makes up this figure and how the company came up with this figure.
Our website will show you the dis-aggregated revenue figures and how each individual revenue segments contributes to total revenue. In Ford Motor example, you will find out from our website that the total revenue is divided into 3 major segments: automotive, mobility and Ford credit.
In addition, investors will also find that there are tables and charts provided to show the historical trend of the data.
This is just one example of what we do.
In short, our goal is to provide a one-stop location where investors can find reliable, accurate and detailed financial data for analysis.
About Our Stock Dividend Screener
We believe in the exceptional power of stock dividend. Stocks that pay dividends on a regular basis and on an increasing rate offer investors the most exceptional return. The power of stock dividend lies in the fact that the dividends paid are re-invested to generate enormous return. The following is an except from About.com Investment Guide.
“Between 1950 and 2003, IBM grew revenue at 12.19% per share, dividends at 9.19% per share, earnings per share 10.94%, and sector growth of 14.65%. At the same time, Standard Oil of New Jersey (now part of Exxon Mobile) had revenue per share growth of only 8.04%, dividend per share growth of 7.11%, earnings per share growth of 7.47%, and sector growth of negative 14.22%.
Knowing these facts, which of these two firms would you have rather owned? The answer may surprise you. A mere $1,000 invested in IBM would have grown to $961,000 while the same amount invested in Standard Oil would have amounted to $1,260,000 – or nearly $300,000 more – even though the oil company’s stock only increased by 120-fold during this time period and IBM, in contrast, increased by 300-fold, or nearly triple the profit per share. The performance differences comes from those seemingly paltry dividends: Despite the much better per share results of IBM, the shareholders who bought Standard Oil and reinvested their cash dividends would have over 15-times the number of shares they started with while IBM stockholders had only 3-times their original amount. This also goes to prove Benjamin Graham’s assertion that although the operating performance of a business is important, Price is Paramount.”
As a result, we created the Stock Dividend Screener application to not only screen but also compare stocks that pays exceptional dividends within an industry. The Stock Dividend Screener is capable of screening for companies that pay dividends on a regular basis and in a sustainable way so that the dividend will not be terminated when things go south.
For more information about the Stock Dividend application, please visit the Tour Page for detail explanation.
About the Team
Stock Dividend Screener Founder — Kenny Frontman
Frontman is currently working and living oversea. He is extremely passionate about investing in good dividend stocks. He has invested in a basket of dividend stocks that give him an annual average return of as much as 10%. His portfolio of dividend stocks consists of companies such as JNJ, INTC, AAPL, etc. Before the birth of Stock Dividend Screener, he had tried to look for a screener or any software tool that could screen and compare stocks as powerful as the Stock Dividend Screener spreadsheet.
As a result, he is determined to create the Stock Dividend Screener spreadsheet that is able to identify undervalued companies that not only have huge upward potential but also pay good dividends in the long haul.
You can contact him through the email address, kenny@stockdividendscreener.com
Stock Dividend Screener Architect — CK Chan
Chan is the architect of the webpage of Stock Dividend Screener. He handles all the technical aspect of constructing the page and writing programming codes for the screener spreadsheet. Chan is also passionate about investing in dividend stocks in the long haul as he believes in the power of compounding interest of investment. His passion in investment lies in investing in stocks that not only appreciate in terms of prices but also pay dividend continuously.


