
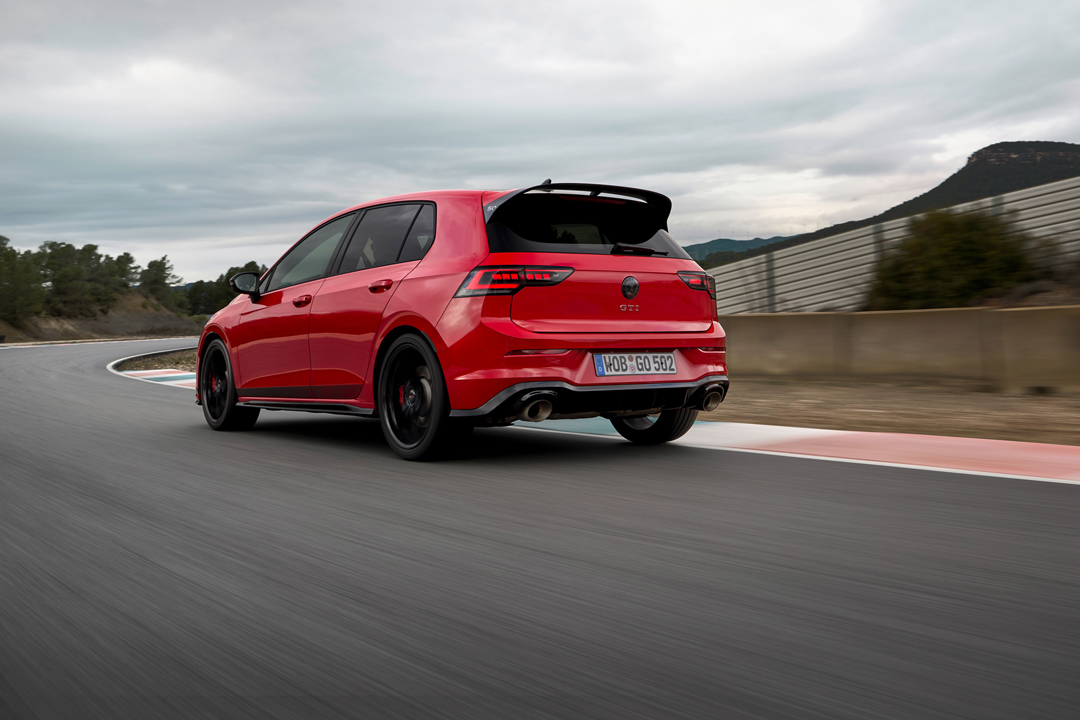
Volkswagen.
This article presents Volkwagen’s vehicle deliveries (retail), vehicle sales (wholesales), and production volumes.
Let’s get into the details!
For other key statistics of Volkswagen, you may find more resources on this page: Volkswagen key stats.
Please use the table of contents to navigate this page.
Table Of Contents
Definitions And Overview
Insight & Summary of Observed Trends
Z1. Insight & Summary of Volkswagen Group’s Sales and Production Numbers
Volkswagen Group’s Consolidated Results
A1. Deliveries, Sales, and Production Numbers
A2. Deliveries, Sales, and Production Growth
Conclusion And Reference
S1. References and Credits
S2. Disclosure
Definitions
To help readers understand the content better, the following terms and glossaries have been provided.
Deliveries vs Sales: Volkswagen distinguishes between “vehicle deliveries to customers” and “vehicle sales”:
-
Deliveries represent the number of vehicles physically handed over to end customers worldwide, while sales refer to the number of vehicles sold to or by dealers/importers (wholesale transactions).
-
Deliveries are the key measure of market demand, whereas sales reflect distribution into the retail network.
-
Deliveries are the most relevant metric for comparing Volkswagen’s performance against competitors (e.g., Toyota, Stellantis), since they show how many cars actually reached customers.
-
Sales can be influenced by dealer stocking strategies, logistics, or supply chain constraints, so they don’t always align with deliveries in the same period.
-
Analysts often focus on deliveries for market share, while sales are more relevant for financial reporting and revenue analysis.
Insight & Summary of Micron’s Revenue Breakdown by Segment
Volkswagen Group's deliveries to customers (retail sales), vehicle sales (wholesales) and production, in thousands of vehicles, are reviewed for FY2019–FY2025 together with their year-over-year growth, with production shown including and excluding the Chinese joint ventures (JVs). Production excluding the Chinese JVs is reported from FY2023 only, so comparisons that involve it start there. The assessment is that volumes have stabilized on a lower plateau, with the Chinese JVs the main source of the recent decline in production.
Cycle: Partial Recovery That Has Stalled: Volume has recovered only part of the cycle's loss, and the recovery has stalled. Deliveries to customers fell 24.7% from the FY2019 peak of 10,975 thousand vehicles to the FY2022 trough of 8,263 thousand, a loss of 2,712 thousand. FY2023 regained 977 thousand, or 36.0% of the lost volume (the rebound divided by the peak-to-trough loss), but FY2024 and FY2025 gave back 256 thousand, leaving FY2025 at 81.9% of the peak and 1,991 thousand below it, with the gap to the peak widening from 15.8% in FY2023 to 18.1%. Wholesales and production including the Chinese JVs ended FY2025 17.7% and 17.8% below their FY2019 peaks, so no measure has regained its prior high, and the shortfall is what a full recovery would still need to regain.
Growth: From Large Swings to Slowing Decline: Growth has moved from large swings to a slowing decline. Across deliveries, wholesales and production including the Chinese JVs, annual growth ran from a fall of 17.8% to a rise of 11.8% in FY2020–FY2023, and declines have narrowed to between 0.2% and 3.8% across all four measures in FY2024–FY2025. Production led the downturn, falling 17.8% against 15.2% for deliveries in FY2020 and 6.9% against 4.5% in FY2021, then rose 5.2% in FY2022 while deliveries fell 7.0%, and rebounded 6.8% in FY2023 against 11.8% for deliveries. Volumes have stopped swinging and are drifting lower, as deliveries fell a further 2.3% in FY2024 and 0.5% in FY2025, so the near-term question is whether the decline stops rather than how fast a rebound arrives.
Alignment: Retail, Wholesale and Production Have Converged: Deliveries, wholesales and production have converged, which suggests a lower risk of a corrective cut in output. The spread (the highest minus the lowest of the three measures in a year) widened from 152 thousand in FY2019 to 599 thousand, or 6.7% of deliveries, in FY2021, when production ran below deliveries, and production then exceeded deliveries by 454 thousand in FY2022. It has since narrowed to between 83 thousand and 122 thousand in FY2023–FY2025, or 1.4% of FY2025 deliveries. Wholesales exceeded deliveries in every year from FY2022 to FY2025, by 38 thousand in FY2025, after deliveries exceeded wholesales by 306 thousand in FY2021. The dataset does not show inventory, pricing or mix, so the spread is a pointer to balance, not a measure of stock.
Key Risk: Chinese JV Volume Drives the Decline: The key risk is concentrated in the Chinese JVs, where the recent decline in production sits. The implied JV volume (production including the JVs less production excluding them) fell 372 thousand, or 12.1%, from 3,072 thousand in FY2023 to 2,700 thousand in FY2025, against a fall of 37 thousand (0.6%) outside them, so the JVs supplied 91.0% of the 409 thousand decline in total production (their change divided by the total change). Their share of production eased from 33.0% to 30.3%, which reduces reliance on them but leaves the weakness in China-linked volume.
Structural Takeaway & Trend: Structurally, Volkswagen's volume has reset to a lower and flatter base rather than recovered: deliveries ended FY2025 18.1% below the FY2019 peak, the three measures sat within 122 thousand of each other in FY2025, and production outside the Chinese JVs moved by only 37 thousand in two years. The swings of FY2020–FY2023 have given way to drift, with deliveries between 8,984 thousand and 9,240 thousand in FY2023–FY2025. For equity holders, the evidence supports a near-stable volume base but not volume-led growth, and the vulnerability is the Chinese JV volume, where 91.0% of the recent decline in production sits. The dataset covers volumes only, so it cannot show pricing, mix, margins or cash flow, and any view on earnings needs that evidence.
The trend has changed from cyclical swings to a slowing decline, and the decline in every measure was smaller in FY2025 than in FY2024. If the pattern holds, volumes would flatten close to the FY2025 level rather than rebound, and the JV share of production would keep easing from 30.3%. Deliveries above the FY2023 level of 9,240 thousand, or production including the JVs above 9,309 thousand, would indicate that recovery has resumed, while implied JV volume below 2,700 thousand or a spread between the three measures above 122 thousand would confirm that the plateau is eroding.
The table below combines all key Volkswagen’s sales and production metrics into a single view for the latest three fiscal years.
Volkswagen's Deliveries, Sales, and Production Analysis — Averages
| Metric | Average |
|---|---|
| Deliveries, Sales, and Production Results in Thousands (3-Year Average (FY2023–FY2025)) | |
| Deliveries To Customers (Retail Sales) | 9,084 |
| Vehicle Sales (Wholesales) | 9,140 |
| Production (Including Chinese JVs) | 9,054 |
| Production (Excluding Chinese JVs) | 6,217 |
| Growth of Deliveries, Sales, and Production Results (2-Year Average (FY2024–FY2025)) | |
| Deliveries To Customers (Retail Sales) | -1.4% |
| Vehicle Sales (Wholesales) | -1.9% |
| Production (Including Chinese JVs) | -2.2% |
| Production (Excluding Chinese JVs) | -0.3% |
Deliveries, sales and production are averaged over FY2023–FY2025, in thousands of vehicles rounded to the nearest thousand. Growth is averaged over FY2024–FY2025 because growth of Production (Excluding Chinese JVs) is n.a. for FY2023; growth averages are the simple average of the annual growth rates, rounded to one decimal place.
Vehicle Deliveries, Sales, and Production Numbers
View data as table
Volkswagen Sales and Production Numbers — All Metrics by Fiscal Year
| Fiscal Year | Deliveries To Customers (Retail Sales) | Vehicle Sales (Wholesales) | Production (Including Chinese JVs) | Production (Excluding Chinese JVs) |
|---|---|---|---|---|
| 2019 | 10,975 | 10,956 | 10,823 | n.a. |
| 2020 | 9,305 | 9,157 | 8,900 | n.a. |
| 2021 | 8,882 | 8,576 | 8,283 | n.a. |
| 2022 | 8,263 | 8,481 | 8,717 | n.a. |
| 2023 | 9,240 | 9,362 | 9,309 | 6,237 |
| 2024 | 9,027 | 9,037 | 8,954 | 6,213 |
| 2025 | 8,984 | 9,022 | 8,900 | 6,200 |
The definition of Volkswagen’s vehicle deliveries and sales is available here: Deliveries vs Sales.
Volkswagen's Deliveries, Sales, and Production Results in Thousands — Averages (FY2023–FY2025)
| Metric | 3-Year Average (FY2023–FY2025) |
|---|---|
| Deliveries To Customers (Retail Sales) | 9,084 |
| Vehicle Sales (Wholesales) | 9,140 |
| Production (Including Chinese JVs) | 9,054 |
| Production (Excluding Chinese JVs) | 6,217 |
Averages are the simple average of the annual values, in thousands of vehicles, rounded to the nearest thousand.
Vehicle Deliveries, Sales, and Production Growth
View data as table
Volkswagen Sales and Production Growth — All Metrics by Fiscal Year
| Fiscal Year | Deliveries To Customers (Retail Sales) | Vehicle Sales (Wholesales) | Production (Including Chinese JVs) | Production (Excluding Chinese JVs) |
|---|---|---|---|---|
| 2020 | -15.2% | -16.4% | -17.8% | n.a. |
| 2021 | -4.5% | -6.3% | -6.9% | n.a. |
| 2022 | -7.0% | -1.1% | 5.2% | n.a. |
| 2023 | 11.8% | 10.4% | 6.8% | n.a. |
| 2024 | -2.3% | -3.5% | -3.8% | -0.4% |
| 2025 | -0.5% | -0.2% | -0.6% | -0.2% |
The definition of Volkswagen’s vehicle deliveries and sales is available here: Deliveries vs Sales.
Volkswagen's Growth of Deliveries, Sales, and Production Results — Averages (FY2024–FY2025)
| Metric | 2-Year Average (FY2024–FY2025) |
|---|---|
| Deliveries To Customers (Retail Sales) | -1.4% |
| Vehicle Sales (Wholesales) | -1.9% |
| Production (Including Chinese JVs) | -2.2% |
| Production (Excluding Chinese JVs) | -0.3% |
Averages are the simple average of the annual growth rates, rounded to one decimal place. FY2023 is excluded because growth of Production (Excluding Chinese JVs) is n.a. for that year, so every row is averaged over FY2024–FY2025.
References and Credits
1. All financial figures presented were obtained and referenced from Volkswagen’s production and sales reports published on the company’s investor relations page: Volkswagen Investor Relations.
Back To Table Of Contents
Disclosure
We may use artificial intelligence (AI) tools to assist us in writing some of the text in this article. However, the data is directly obtained from original sources and meticulously cross-checked by our editors multiple times to ensure its accuracy and reliability.
If you find the information in this article helpful, please consider sharing it on social media. Additionally, providing a link back to this article from any website can help us create more content like this in the future.
Thank you for your support and engagement! Your involvement helps us continue to provide high-quality, reliable content.