Tesla Motors. Source: Flickr Image
This article presents the results of Tesla’s vehicle production and delivery.
Apart from vehicle production and delivery, this article also explores a number of other statistics, including Tesla’s revenue per car, cumulative deliveries, trailing 12-months (TTM) and annual car production and sales, automotive revenue, sales comparison with Ford and GM as well as with Chinese EV makers.
Investors interested in Tesla’s revenue and revenue breakdown by segment may find more information on this page – Tesla Sales Breakdown, Margin And Profit.
Please use the table of contents to navigate this page.
Table Of Contents
Definitions And Overview
O2. Tesla Business Strategy
O3. How Tesla Distributes Its Vehicles
Production Overview
A1. Installed Annual Vehicle Capacity
Consolidated Production
B1. Total Vehicle Production
B2. Vehicle Production Growth Rates
Consolidated Sales
B3. Total Vehicle Delivery
B4. Vehicle Delivery Growth Rates
Aggregate Sales Numbers
C1. Cumulative Vehicle Delivery Milestones
Sales Vs Automotive Revenue
C2. Vehicles Delivered Vs Automotive Revenue
C3. Revenue Per Car
Production By Car Model
D1. Model 3 And Y Production By Year
D2. Model 3 And Y Production By Quarter
D3. Model 3 And Y Production By TTM
D4. Model S, X And Other Models Production By Year
D5. Model S, X And Other Models Production By Quarter
D6. Model S, X And Other Models Production By TTM
Growth Rates Of Production By Car Model
D7. Growth Rates Of Model 3/Y Production
D8. Growth Rates Of Model S/X Production
Sales By Car Model
E1. Model 3 And Y Delivery By Year
E2. Model 3 And Y Delivery By Quarter
E3. Model 3 And Y Delivery By TTM
E4. Model S, X And Other Models Delivery By Year
E5. Model S, X And Other Models Delivery By Quarter
E6. Model S, X And Other Models Delivery By TTM
Sales Numbers Vs Competitors
F1. Tesla vs Ford And GM
F2. Tesla vs Nio, Xpeng, And Li Auto
Conclusion And Reference
S1. Conclusion
S2. References and Credits
S3. Disclosure
Definitions
To help readers understand the content better, the following terms and glossaries have been provided.
Model 3: The Model 3 is an all-electric mid-size sedan introduced in 2017. It is designed to be a more affordable alternative to Tesla’s luxury Model S sedan. The Model 3 features a sleek, minimalist design and is available in several configurations, including standard and long-range battery options and a performance option.
It is known for its impressive acceleration, long driving range, and advanced technology features, including Tesla’s Autopilot driver assistance system. The Model 3 has received widespread acclaim for its combination of style, performance, and sustainability.
Model Y: The Model Y is an all-electric compact SUV introduced in 2019. It shares many design and engineering features with Tesla’s Model 3 sedan, including its battery platform and electric drivetrain. The Model Y is slightly larger than the Model 3 and features a higher seating position and more cargo space.
It is available in several configurations, including rear-wheel and all-wheel drive, as well as a high-performance option. The Model Y is known for its impressive acceleration, long driving range, and advanced technology features, including Tesla’s Autopilot driver assistance system.
Model S: The Model S is an all-electric luxury sedan introduced in 2012. It is one of Tesla’s flagship models and is known for its impressive acceleration, long driving range, and advanced technology features, including Tesla’s Autopilot driver assistance system.
The Model S is available in several configurations, including standard and long-range battery options and a high-performance option. It features a sleek, aerodynamic design and a spacious, luxurious interior with many customization options. The Model S has received widespread acclaim for its combination of style, performance, and sustainability.
Model X: The Model X is an all-electric luxury SUV introduced by Tesla in 2015. It features unique Falcon Wing doors that open up and out of the way, allowing easy access to the second and third rows.
The Model X is also known for its impressive acceleration and extended driving range. It comes with various advanced technology features, including Tesla’s Autopilot driver assistance system, and is available in several configurations, including all-wheel drive and a high-performance option. The Model X is a spacious, luxurious SUV with a unique driving experience.
Cybertruck: The Cybertruck is an all-electric pickup truck unveiled by Tesla in 2019. It features a unique, angular design likened to a futuristic armored vehicle. The Cybertruck is made with ultra-hard 30X cold-rolled stainless steel and armored glass, making it highly durable and resistant to damage.
It is available in several configurations, including single, dual, and tri-motor options, with a range of up to 500 miles on a single charge. The Cybertruck also has advanced technology features, including Tesla’s Autopilot driver assistance system. It is expected to go into production in 2021.
Tesla Business Strategy
Tesla’s business strategy centers on producing innovative, high-performance electric vehicles, energy storage solutions, and solar products. The company aims to accelerate the transition to sustainable energy by developing and promoting environmentally friendly and technologically advanced products.
Tesla’s strategy also includes a vertically integrated business model, with the company controlling all aspects of its products, from design and engineering to manufacturing and sales. By doing so, Tesla seeks greater efficiency, quality, and control over its supply chain. The company also emphasizes a direct-to-consumer sales model, using its stores and digital channels to sell its products and provide a seamless customer experience.
Overall, Tesla’s business strategy focuses on disrupting the traditional automotive industry by offering unique products integrating advanced technology, sustainability, and performance.
How Tesla Distributes Its Vehicles
Tesla distributes its vehicles primarily through its network of company-owned stores and galleries in various countries worldwide. Customers can also purchase Tesla vehicles online through the company’s website.
Tesla has a direct-to-consumer sales model, meaning it does not use traditional car dealerships to sell its vehicles. This gives Tesla greater control over the sales process and customer experience.
Additionally, Tesla also offers home delivery and service options for its vehicles, further enhancing the convenience for its customers.
Installed Annual Vehicle Capacity
Tesla’s production capacity as of fiscal 4Q 2023:
| As at 31 Dec 2023 | |||
|---|---|---|---|
| Installed Annual Capacity | Status | ||
| Location | Model | ||
| California, USA | Model S / Model X | 100,000 | Production |
| Model 3 / Model Y | 550,000 | Production | |
| Shanghai, China | Model 3 / Model Y | 950,000 | Production |
| Berlin, Germany | Model Y | 375,000 | Production |
| Texas, USA | Model Y | 250,000 | Production |
| Cybertruck | 125,000 | Production | |
| Nevada, USA | Tesla Semi | – | Pilot Production |
| TBD | Roaster | – | In Development |
| Robotaxi | – | In Development | |
| India | Future Product | – | In Talks With Leaders |
| Indonesia | Future Product | – | In Talks With Leaders |
| Mexico | Future Product | – | In Talks With Leaders |
The definitions of Tesla’s vehicle models are available here: Model 3, Model Y, Model S, Model X, and Cybertruck.
As of 4Q 2023, Tesla’s Fremont Gigafactory in California, USA, can produce up to 550,000 Model 3/Y and 100,000 Model S/X, the largest installed capacity among all Gigafactory in the U.S.
Although the Fremont Gigafactory is the largest in the US, it is dwarfed by its Chinese counterpart. As of 4Q 2023, Tesla’s Shanghai Gigafactory can produce up to 950,000 vehicles per year, the largest in the world.
Despite a large production capacity, Tesla’s Shanghai Gigafactory only produces the Model 3/Y and is the primary export hub for these models worldwide.
Tesla’s Texas Gigafactory produces the Model Y at an annual installed capacity of 250,000 vehicles and has started pilot production of the flagship Cybertruck with an initial installed capacity of 125,000 vehicles.
Also, Tesla’s Nevada is expected to work on the Tesla Semi. In addition to the US and China, Tesla has already started operating a Gigafactory in Berlin and may build one in India, Indonesia, and Mexico.
Globally, Tesla’s worldwide production capacity exceeds 2.0 million vehicles per year as of 4Q 2023.
Total Vehicle Production
Tesla total vehicle production
(click image to enlarge)
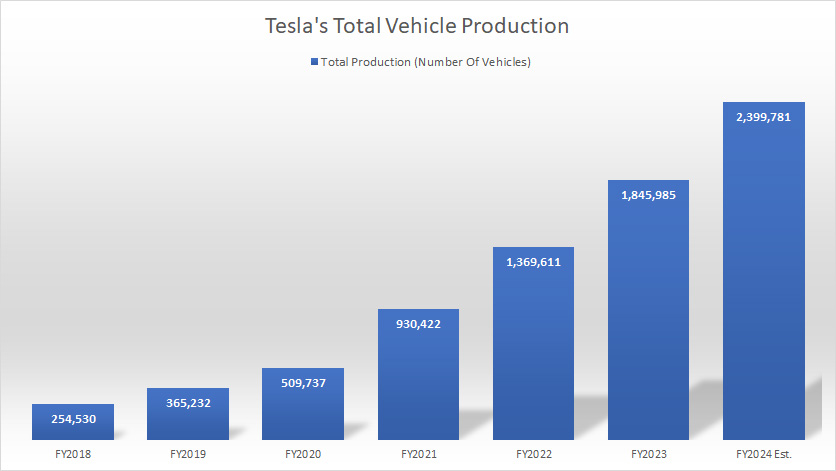
On a consolidated basis, Tesla produced 1.85 million vehicles globally as of fiscal 2023, representing a rise of 35% year-on-year.
With an annual growth rate of 30%, Tesla is expected to produce up to 2.4 million vehicles by the end of 2024, which is roughly in line with the company’s worldwide installed capacity.
Since 2018, Tesla has grown its production by more than 5-fold, topping more than 1 million vehicles for the first time in 2022.
Vehicle Production Growth Rates
tesla-vehicle-production-growth-rates
(click image to expand)
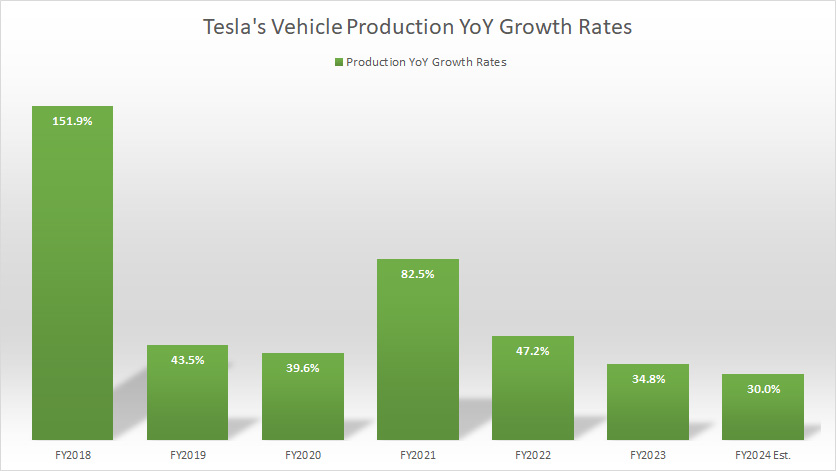
Tesla’s global vehicle production grew 35% in 2023 over 2022, a far lower number than 47% and 82.5% measured in 2022 and 2021, respectively.
Going into 2024, Tesla’s global production may decline by 30%, based on the projection highlighted in the TTM plot below: Model 3/Y Production and Model S/X Production.
Total Vehicle Delivery
Tesla total vehicle delivery
(click image to enlarge)
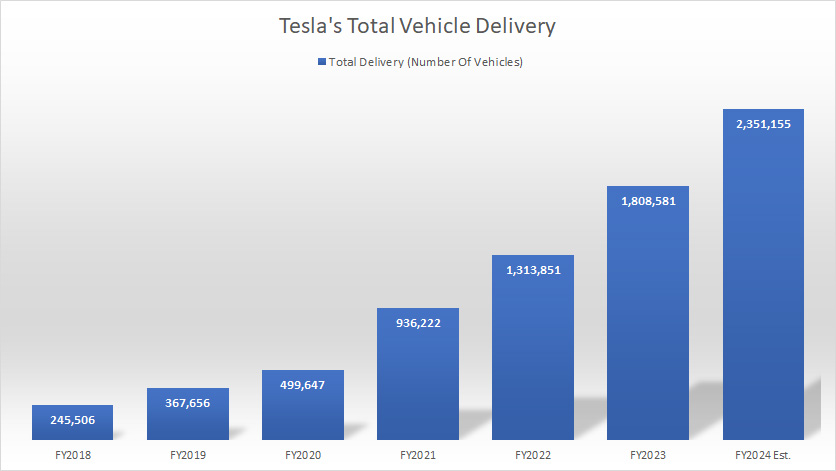
Tesla delivered a whopping 1.81 million vehicles globally in fiscal 2023, a rise of 38% over 2022.
With an estimated growth rate of 30%, Tesla may deliver up to 2.35 million vehicles by the end of fiscal 2024.
A noticeable trend with Tesla is that vehicle delivery and production are closely linked, suggesting well-managed inventory.
Vehicle Delivery Growth Rates
Tesla vehicle sales growth rates
(click image to enlarge)
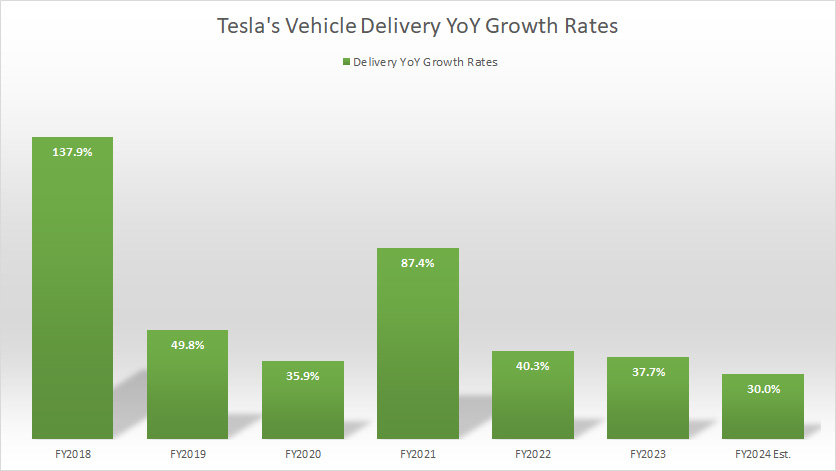
Tesla’s vehicle sales growth topped 37.7% in fiscal 2023, slightly lower than 40.3% in 2022 and well below the target of 50% year-over-year.
Going into 2024, Tesla’s global delivery may decline by 30%, based on the projection highlighted in the TTM plot below: Model 3/Y Production and Model S/X Production.
Cumulative Vehicle Delivery Milestones
Tesla’s cumulative vehicle delivery
(click image to enlarge)
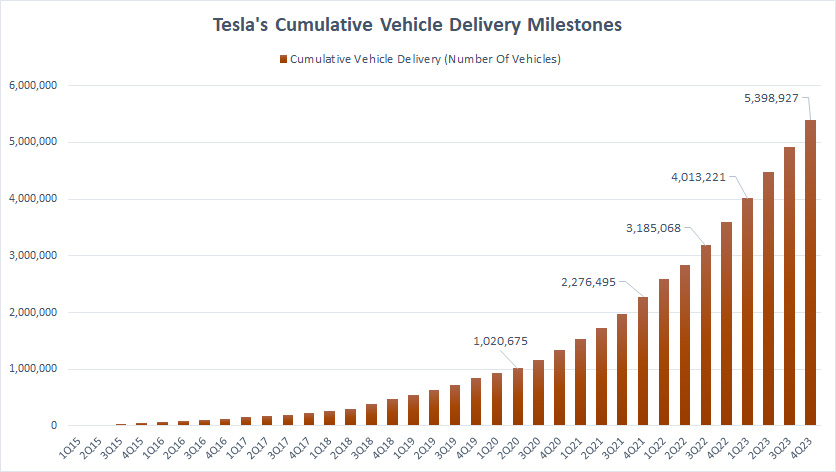
Tesla took about five years to deliver its first million cars in 2Q 2020 since the start of Model S/X production in 2015. However, the company only took 1.5 years to reach the 2 million target.
In subsequent periods, Tesla achieved the milestone of delivering one million vehicles in even shorter periods.
For example, it took Tesla 12 months to reach the 3 million milestone and only nine months to reach the 4 million milestone.
As of fiscal 4Q 2023, Tesla’s cumulative vehicle delivery reached a new milestone of 5.4 million units.
Vehicle Sales Vs Automotive Revenue
Tesla’s vehicle delivery and automotive revenue
(click image to enlarge)
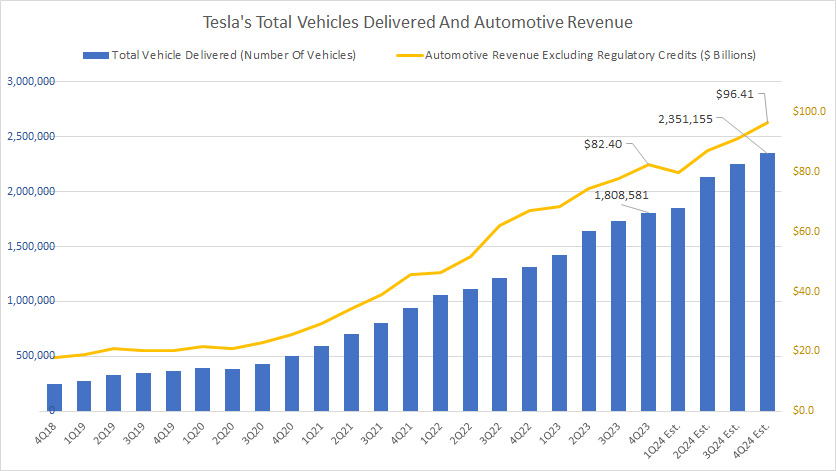
There is a strong correlation between Tesla’s automotive revenue and the automotive sales volume.
As of 4Q 2023, Tesla’s automotive revenue hit US$82.4 billion (excluding carbon credits sales) on the back of a vehicle volume of 1.81 million units.
By the end of 4Q 2024, Tesla may earn up to US$96.4 billion in automotive revenue based on a projected vehicle volume of 2.35 million units.
The estimated automotive revenue in 2024 is calculated based on Tesla’s revenue per car of $41,000, according to the projectile here: revenue per car.
Revenue Per Car
tesla-revenue-per-car-by-quarter
(click image to expand)
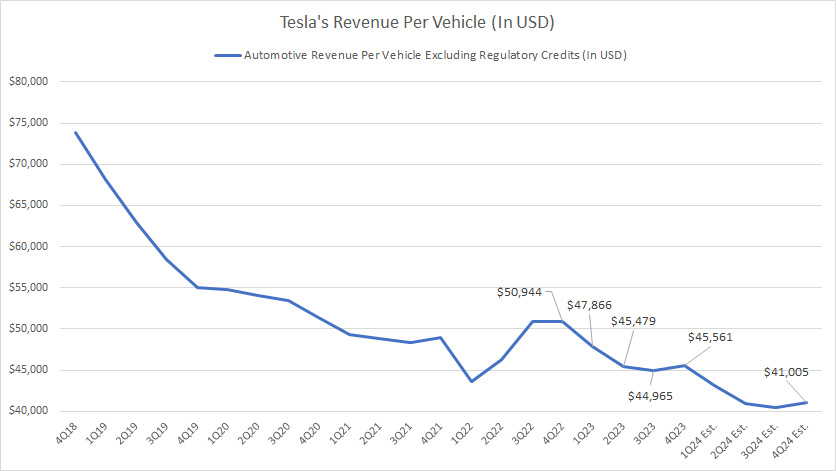
Tesla’s revenue per car is calculated as automotive revenue excluding regulatory credits divided by total vehicles delivered.
For more details about Tesla’s revenue per car and data by year, you may visit this page – Tesla Revenue Per Car.
Tesla’s revenue per car has significantly declined since 2018, from nearly US$75,000 in 2018 to US$45,600 as of 2023.
Going by the same rate of decline, Tesla’s revenue per car is projected to reach US$41,000 by the end of fiscal 2024.
Model 3 And Y Production Numbers By Year
tesla-model-3-model-y-poduction-figures-by-year
(click image to expand)
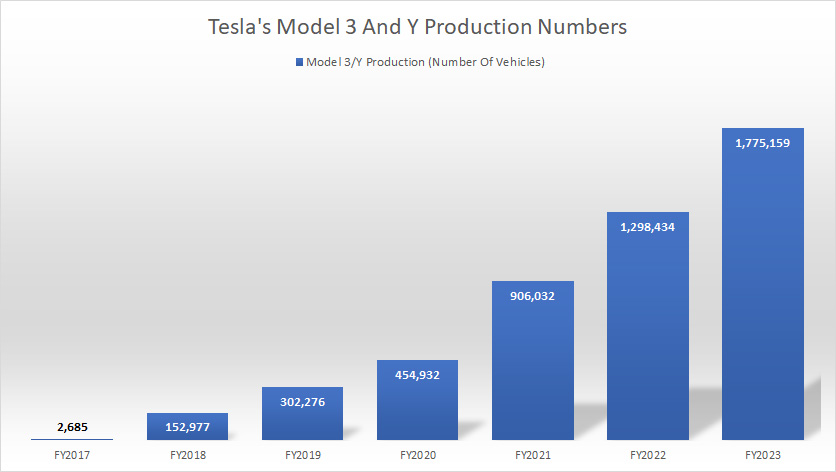
The Model 3 and Mode Y are Tesla’s flagship vehicles targeted at the mass market. Tesla produced 178 million Model 3 and Y as of fiscal 2023, up 37% from a year ago.
Tesla’s production of Model 3 and Y vehicles has increased by approximately eight times since 2018, reaching one million vehicles for the first time in 2022.
Model 3 And Y Production Numbers By Quarter
tesla-model-3-model-y-poduction-figures-by-quarter
(click image to expand)
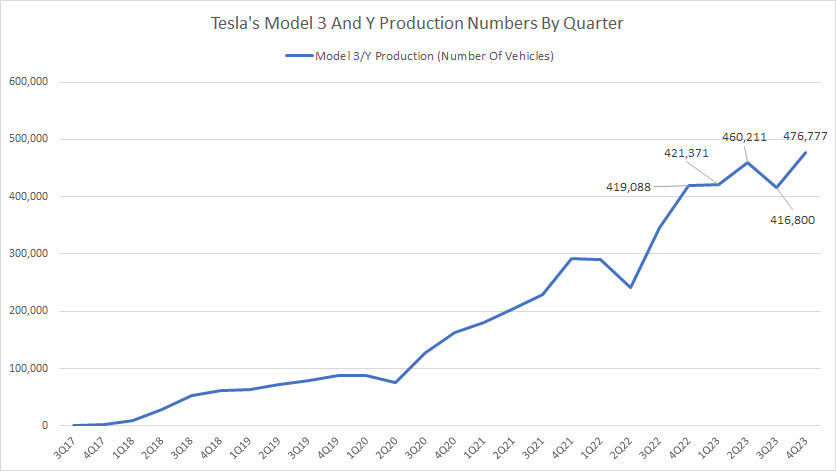
Tesla’s quarterly Model 3 and Y production increased significantly to 476,800 vehicles as of 4Q 2023 over the previous quarter and 14% over the same quarter a year ago.
For the quarter ended on Sept 30, June 30, and March 31, 2023, Tesla produced 416,800, 460,211, and 421,371 Model 3 and Model Y, respectively.
On a long-term basis, Tesla’s quarterly Model 3 and Y production has significantly risen.
Model 3 And Y Production Numbers By TTM
tesla-model-3-model-y-poduction-figures-by-ttm
(click image to expand)
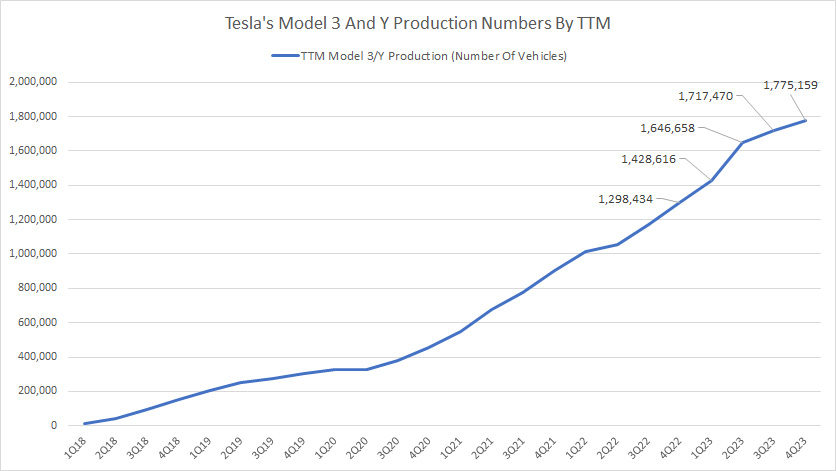
Tesla’s Model 3 and Model Y production reached a record high of 1.78 million units as of 4Q 2023 on a TTM basis, up 36% from a year ago.
Based on the plot projectile, Tesla’s production of Model 3 and Model Y will likely exceed 2 million units by the end of 2024.
Model S, X, And Other Models Production Numbers By Year
tesla-model-s-model-x-poduction-figures-by-year
(click image to expand)
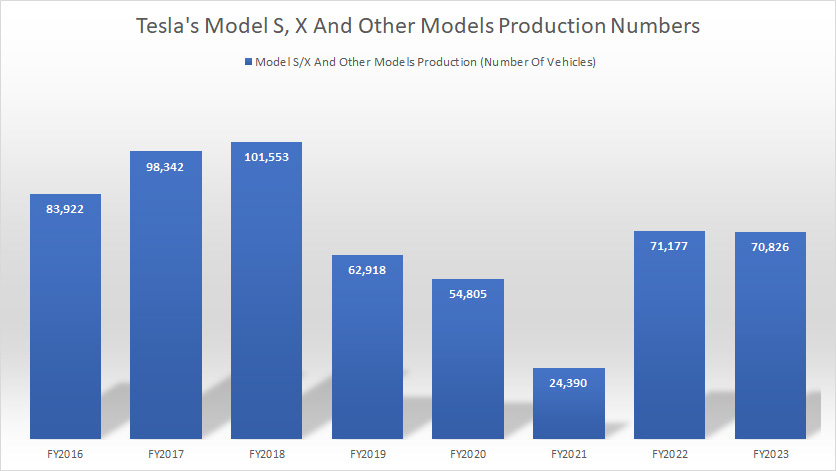
Tesla produced only 70,800 Model S and X and other models in fiscal 2023, up nearly 200% over 2021 but in line with 2022’s result.
Tesla’s Model S and X production has significantly declined in recent years after reaching over 100,000 vehicles in fiscal 2018.
Model S, X, And Other Models Production Numbers By Quarter
tesla-model-s-model-x-poduction-figures-by-quarter
(click image to expand)
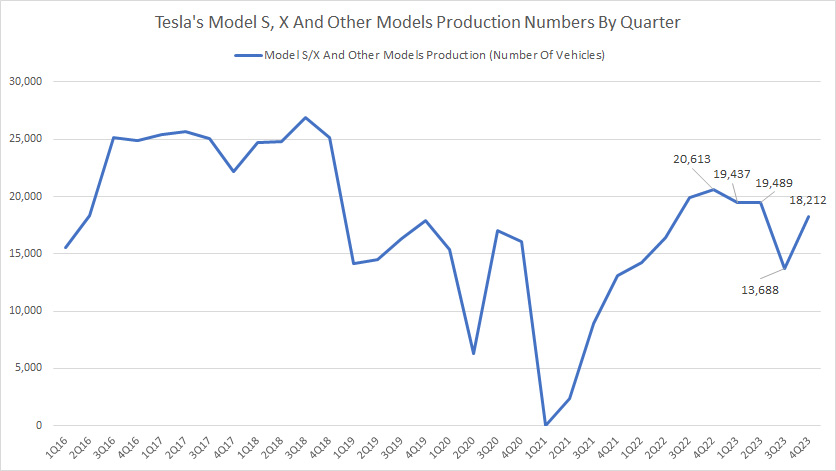
Tesla’s Model S/X and other models production declined to 18,200 units in 4Q 2023, down 12% from a year ago.
For the quarters ended on Sept 30, June 30, and March 31, 2023, Tesla produced 13,700, 19,500, and 19,400 Model S/X and other models, respectively.
Tesla’s production of Mode S/X and other models has significantly grown in post-pandemic periods since 2021.
Model S, X, And Other Models Production Numbers By TTM
tesla-model-s-model-x-poduction-figures-by-ttm
(click image to expand)
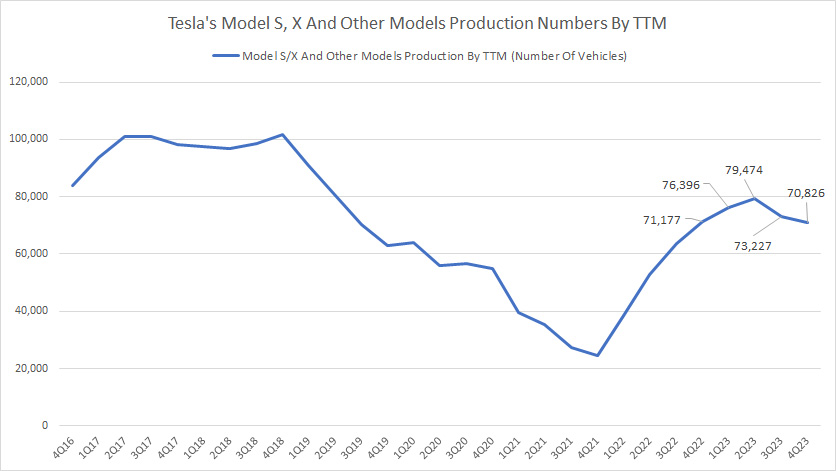
The TTM plot shows that Tesla’s production of Model S/X and other models has significantly recovered in post-pandemic periods after having a considerable slump in 2021.
An interesting fact is that Tesla used to produce over 100,000 Model S and Model X on a TTM basis.
The production of 100,000 vehicles per year for Model S and X is probably over for Tesla due to the high cost of producing them and the fact that these models are only available in North America.
Growth Rates Of Model 3 And Y Production
tesla-model-3-model-y-poduction-growth-rates
(click image to expand)
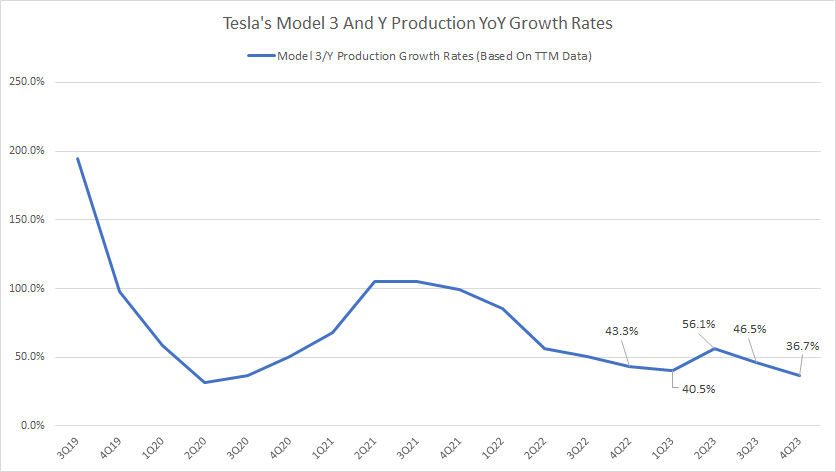
Tesla’s Model 3 and Model Y production has significantly slowed in the last several quarters. As of 4Q 2023, Tesla’s production of Model 3/Y declined below 40% for the first time in over three years, reaching only 36.7%, down significantly from a year ago and the prior quarter.
Although vehicle production has slowed for the Model 3 and Y, Tesla can still produce at a rate above 30%, a figure that is the envy of many automakers.
Growth Rates Of Model S And X Production
tesla-model-s-model-x-poduction-growth-rates
(click image to expand)
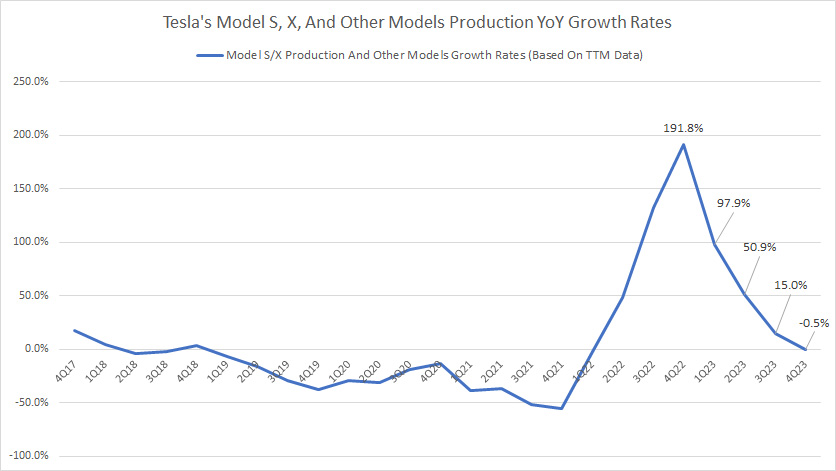
The decline in Model S and X production is much worse than that of Model 3 and Y in recent quarters.
After peaking at 192% in 2022, Tesla’s Model S and X production has considerably slowed. As of 4Q 2023, the year-on-year growth rate tumbled to -0.5%, the worst result measured over two years.
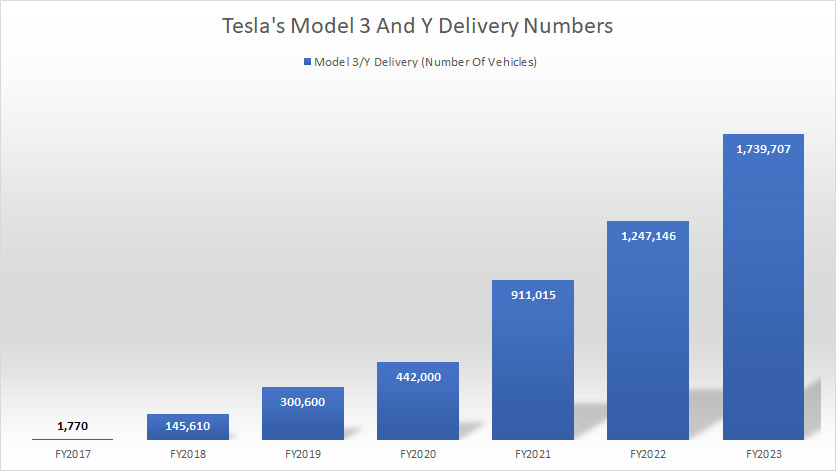
Model 3 And Y Delivery Numbers By Year
Tesla’s Model 3 and Model Y delivery figures by year
(click image to enlarge)
Tesla delivered 1.8 million Model 3 and Model Y as of fiscal 2023, up 44% from a year ago.
Since 2018, Tesla’s Model 3 and Y delivery has grown by more than 8-fold and surpassed 1 million vehicles for the first time in 2022.
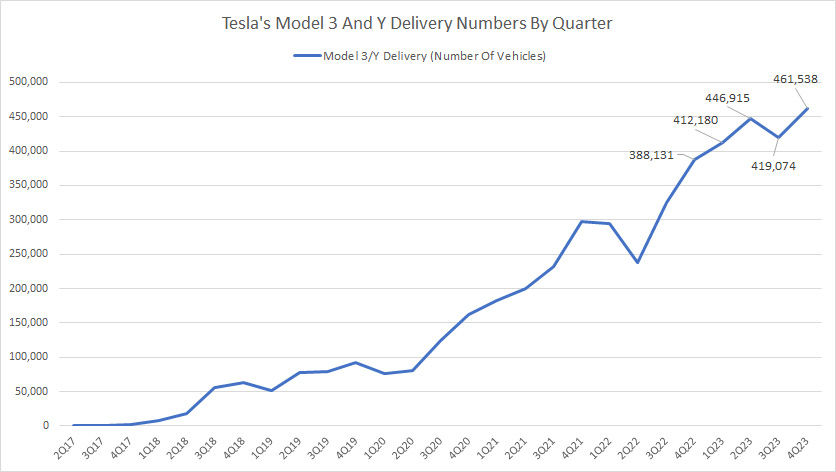
Model 3 And Y Delivery Numbers By Quarter
Tesla Model 3 and Y delivery figures by quarter
(click image to enlarge)
The chart above says that the appeal of Tesla’s Model 3 and Y to the mass market is undisputed.
Tesla’s Model 3 and Y delivery has been on a smooth ride and even defied a number of challenges, including the COVID-19 crisis and supply chain issues.
As of 4Q 2023, Tesla delivered roughly 461,500 Model 3 and Y, up 19% year-over-year or 10% from the prior quarter.
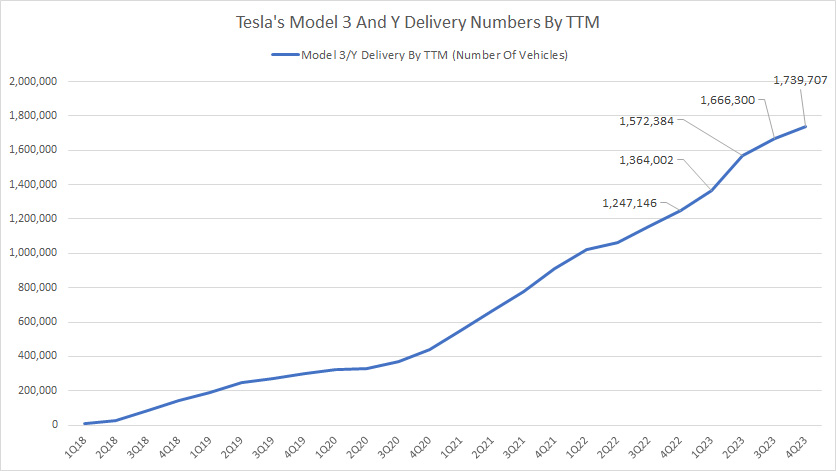
Model 3 And Y Delivery Numbers By TTM
Tesla Model 3 and Y delivery figures by TTM
(click image to enlarge)
Tesla has been having increasing vehicle sales for the Model 3 and Y, as reflected in the TTM plot above.
As of 4Q 2023, Tesla’s TTM Model 3 and Y deliveries reached a whopping 1.74 million vehicles, a record figure up 39% from a year ago.
Conservatively, Tesla’s TTM Model 3 and Model Y deliveries can easily exceed 2 million units by the end of fiscal 2024 based on the projectile presented in the chart above.
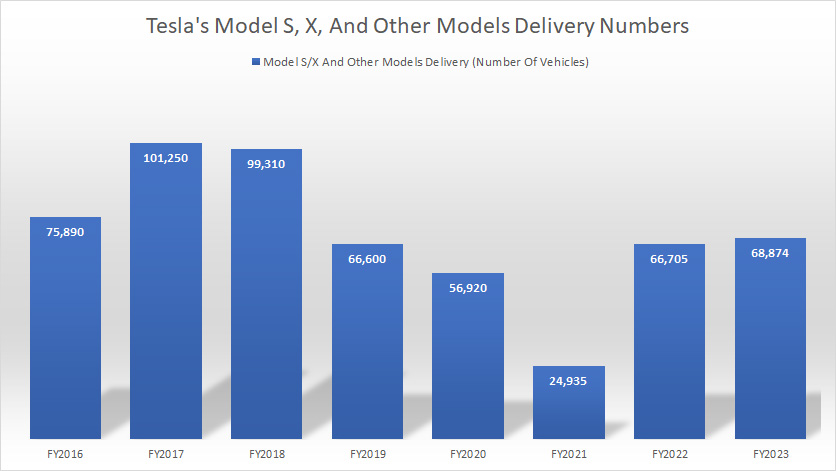
Model S, X And Other Models Delivery By Year
Tesla Model S and X delivery figures by year
(click image to enlarge)
Tesla delivered slightly over 68,800 Model S, X, and other models as of fiscal 2023, which was less than one-tenth of Model 3 and Y figures.
The 2023 figure was up 100% from 2021 and roughly aligned with 2022’s result.
Model S, X And Other Models Delivery By Quarter
Tesla Model S and X delivery figures by quarter
(click image to enlarge)
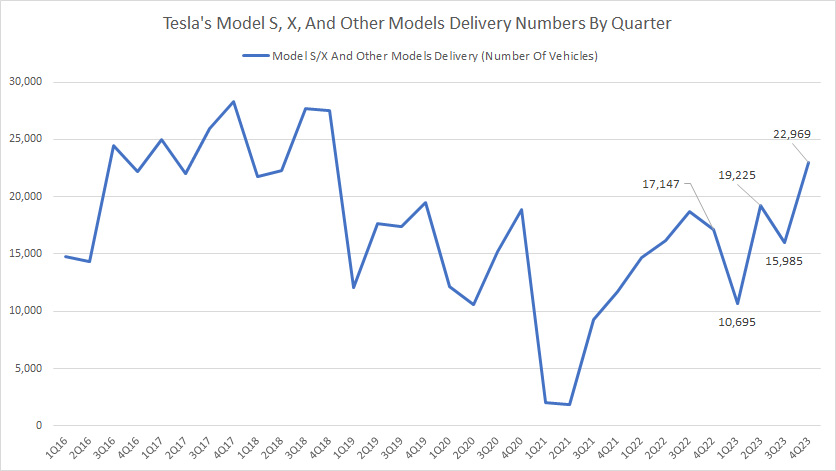
The delivery numbers for Tesla’s premium models have been zig-zagging in the quarterly plot.
While the demand dropped considerably during fiscal 2021, it quickly recovered in the following years and after that.
As of 4Q 2023, Tesla delivered 23,000 Model S, X, and other models every quarter, up significantly year-on-year and sequentially.
Despite the $100,000 price tag, Tesla could still deliver a reasonable number of Model S and X.
Model S, X, And Other Models Delivery Numbers By TTM
Tesla Model S and X delivery figures by TTM
(click image to enlarge)
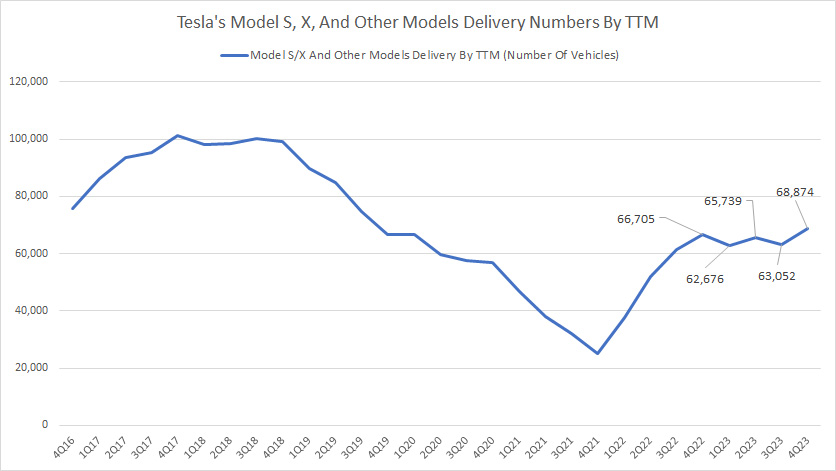
The TTM plot better reflects the sales trend of Tesla’s Model S, X, and other models.
As seen, Tesla’s sales of Model S, X, and other models were on a decline before 2022. The company sold considerably low Model S and X in fiscal 2021.
However, Tesla’s sales of Model S, X, and other models have recovered in post-pandemic periods. As of 4Q 2023, Tesla’s sales of Model S, X, and other models reached 68,900 vehicles, a record number since 2021, and were up 3% year-on-year.
Therefore, there is still a considerable demand for Tesla’s premium models.
Tesla Vs Ford And GM In Vehicle Sales
Tesla’s vehicle delivery vs. Ford and GM
(click image to enlarge)
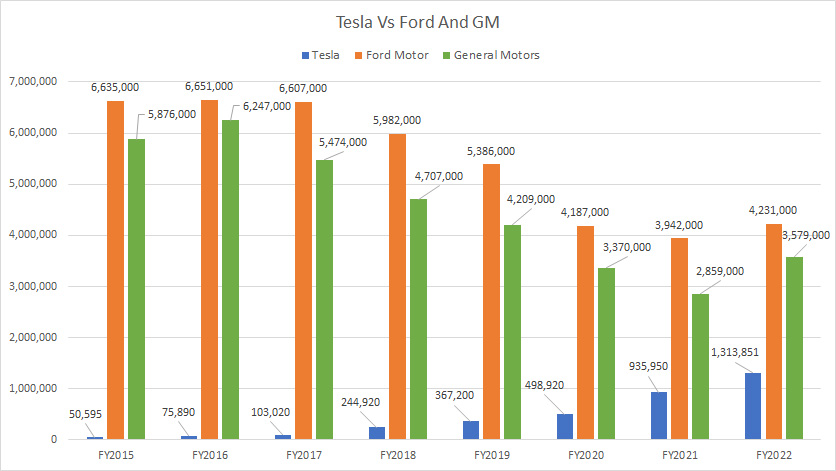
Tesla’s vehicle sales are still significantly smaller than Ford’s and GM’s.
Precisely, Tesla’s sales number is only about 30% of Ford’s sales and 37% of GM’s sales for fiscal 2022.
The gap was much bigger before 2020, when EVs were relatively unheard of at that time.
As time goes by and as EVs slowly gain mainstream, Tesla can grow its delivery and close the gap with GM and Ford.
During the same period, Ford and GM’s vehicle sales have declined considerably, closing the gap much faster.
Tesla Vs. No, Xpeng And Li Auto In Vehicle Volume
Tesla’s vehicle delivery vs. Chinese EV companies
(click image to enlarge)
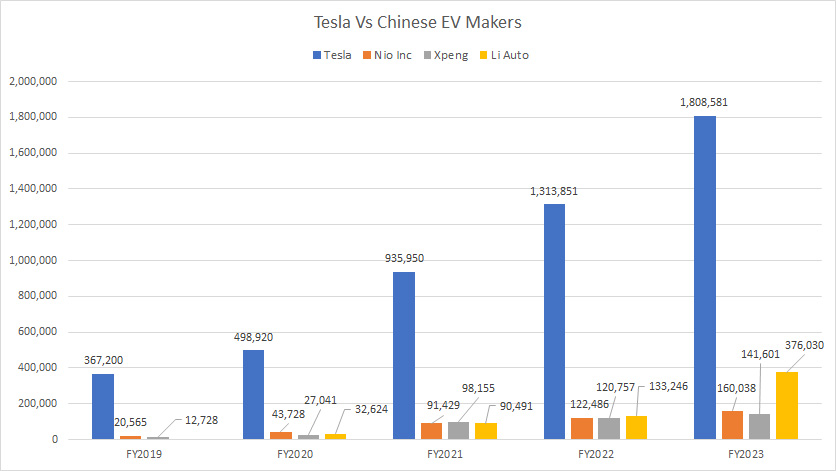
Tesla’s vehicle sales lead significantly higher compared to Chinese EV makers such as Nio, Xpeng, and Li Auto.
As of fiscal 2023, most Chinese EV makers such as Nio, Xpeng, and Li Auto delivered only about one-tenth of Tesla’s result.
Even with the combined figures of Nio, Xpeng, and Li Auto, they are not close to half of Tesla’s EV sales.
Therefore, Tesla leads most Chinese EV companies by a wide margin when it comes to vehicle volume.
Conclusion
In summary, Tesla’s total vehicle production and delivery figures are at record highs.
In 2022, Tesla’s total vehicle production and sales exceeded the 1 million milestone for the first time.
These figures will most likely trend higher, given the upcoming number of gigafactories worldwide, possibly including plants in India, Indonesia, and Mexico.
In terms of competition, Tesla is still far ahead of its Chinese peers and is quickly closing the gap with GM and Ford.
Therefore, Tesla will still be the leader in the EV space as of 2023.
References and Credits
1. All financial figures presented in this article were referenced and obtained from Tesla’s SEC filings, earnings reports, financial statements, investors letters, etc., which are available in Tesla Investor Relations.
2. Featured images in this article are used under Creative Commons License and sourced from the following websites: Jakob Härter and Duncan Rawlinson – Duncan.co.
Disclosure
References and examples such as tables, charts, and diagrams are constantly reviewed to avoid errors, but we cannot warrant the total correctness of all content.
The content in this article is for informational purposes only and is neither a recommendation nor a piece of financial advice to purchase a stock.
If you find the information in this article helpful, please consider sharing it on social media and providing a link to this article from any website so that more articles like this can be created in the future.
Thank you!


Thanks a lot for your detailed breakdown here.
It has helped me but my ordering “process” into some perspective.
I completed the order for a Model Y LR on July 11th, and was provided an estimated delivery date between August 15 and Sept 1.
By the time I woke up the next day, the delivery date was pushed to Sept-Oct. And then again around August 12th till Oct-Nov.
Given your numbers, in order to estimate a delivery by end of August, I assume there were roughly 145k orders placed before my own. Given this rate, Telsa would produce about 220k in Q3.
But now given the revised timeline for my own vehicle, Tesla will only be able to produce 110k Vehicles in Q3.
Now, Telsa states, that all purchased are completed in order that they are received… That they do not guarantee delivery dates, but that those dates are the most accurate dates they can provide. But, the Phone Reps can not clarify on how they are deteremined, which is only available to other people in the company who can not be reached. They have also stated that they deliver all vehicles in the order which purchases were placed.
Currently Tesla is advertising the Model Y LR ordered today would be delivered in Jan (but off course, no guarantees). While a Model Y Performance is advertised as 6-8 weeks.
This starts to feel fishy. How can someone ordering the same, but “more expensive”, version of the same vehicle receive theirs first, if all orders are completed in order.
I think…. Tesla is cherry picking out the most profitable orders, particularly with the nearest delivery destinations, so that, despite COVID they can keep putting up these fantastic numbers.
If Tesla goes and sets another record, selling more then 200k vehicles in Q3, the fishy smell feel like rote. As they could only achieve those numbers through some massive customer manipulation.
Or, is the upside if we see a nearly 50% reduction in quarterly production, matching their advertised estiamtes of about 110k?
The cherry-picking on car delivery definitely smells fishy.
However, Tesla expects to produce 50% more cars in 2021 than in 2020, and the same for 2022.
If Tesla can only deliver or produce 110k vehicles in Q3, be prepared for a 50% reduction in the stock price.