Computer chips. Pexels Images.
This article presents the financial performance of Advanced Micro Devices (AMD) and Intel Corporation by comparing their profitability and profit margins.
It provides an in-depth analysis of key metrics such as gross profit, operating profit, pre-tax profit, and net profit, offering a well-rounded view of how each company performs financially
Let’s look at the numbers!
For other key statistics of AMD and Intel, you may find more resources on these pages:
Revenue
- AMD revenue segments: data center, gaming, embedded, etc.,
- AMD revenue by country: U.S., Japan, China, Europe, Taiwan, etc.
Profit Margin
- AMD profit margin breakdown: data center, gaming, client, etc.,
- AMD vs Nvidia: profit margin comparison,
- TSMC vs Intel: profit margin analysis
R&D Budget
- AMD vs Nvidia: R&D spending,
- TSMC vs Intel: R&D expenditures,
- AMD vs Intel: research dnd development budget
Debt
- AMD financial health: debt level, payment due, and liquidity
Please use the table of contents to navigate this page.
Table Of Contents
Definitions And Overview
O2. Why was Intel’s profit margin deteriorating?
Profitability
A1. AMD Vs intel: Gross And Operating Profit
A2. AMD Vs Intel: Pre-Tax And Net Income
Profit Margins
B1. AMD Vs Intel: Gross And Operating Profit Margins
B2. AMD Vs Intel: Pre-Tax And Net Profit Margins
Summary And Reference
S1. Insight
S2. References and Credits
S3. Disclosure
Definitions
To help readers understand the content better, the following terms and glossaries have been provided.
Gross Profit: Gross profit is the amount a company earns after subtracting the costs associated with producing and selling its products or providing its services. It’s a key indicator of a company’s financial health and efficiency in managing production costs.
Here’s the formula:
\[\text{Gross Profit} = \text{Revenue – Cost of Goods Sold (COGS)} \]
Gross profit helps to measure a company’s ability to generate profit from its core business operations, excluding indirect costs like administration and marketing expenses.
Operating Profit: Operating profit, also known as operating income or operating earnings, represents the profit a company makes from its core business operations, excluding any income from investments, interest, and taxes.
It’s a crucial measure of a company’s operational efficiency and profitability. Here’s the formula for calculating operating profit:
\[\text{Operating Profit} = \text{Gross Profit – Operating Expenses} \]
Operating expenses include costs such as salaries, rent, utilities, and depreciation. Operating profit provides insight into how well a company is managing its core business activities and controlling its operating costs.
Pre-Tax Profit: Pre-tax profit, also known as pre-tax income or earnings before tax (EBT), represents the profit a company makes before accounting for income taxes.
It’s a measure of a company’s profitability that excludes tax expenses, providing insight into the company’s financial performance before tax obligations are considered.
Here’s the formula for calculating pre-tax profit:
\[\text{Pre-tax Profit} = \text{Operating Profit + Other Income – Other Expenses} \]
Other income may include items like interest earnings, and other expenses might include interest expenses or non-operating costs.
Net Profit: Net profit, also known as net income or net earnings, is the amount of profit a company has left after all expenses have been deducted from total revenue.
These expenses include the cost of goods sold (COGS), operating expenses, interest, taxes, and any other expenses. Net profit is a key indicator of a company’s overall profitability.
Here’s the formula for calculating net profit:
\[\text{Net Profit} = \text{Total Revenue – Total Expenses} \]
Net profit provides a clear picture of a company’s financial health, showing how much profit it actually retains after covering all its costs. It’s often used by investors and analysts to assess a company’s performance and profitability.
Why was Intel’s profit margin deteriorating?
Intel’s profit margin has faced challenges due to several factors:
-
Declining PC Sales: A historic slump in global PC demand has significantly impacted Intel’s revenue, as its personal computing segment is a major contributor to its income.
-
Manufacturing Issues: Intel has struggled with longstanding manufacturing inefficiencies, which have hindered its ability to compete effectively with rivals like AMD and TSMC.
-
Increased Competition: Competitors such as AMD and Nvidia have gained market share, particularly in data centers and high-performance computing, further pressuring Intel’s margins.
-
Economic Headwinds: Broader macroeconomic uncertainties, including inflation and reduced IT spending, have also contributed to weaker profitability.
-
Restructuring Costs: Intel has incurred significant expenses related to restructuring efforts aimed at improving operational efficiency.
Despite these challenges, Intel has been working on strategic pivots, such as focusing on AI-driven computing and leveraging government support like the CHIPS Act, to stabilize and improve its financial performance.
AMD Vs Intel: Gross And Operating Profit
amd-vs-intel-gross-and-operating-profit
(click image to expand)
You can find the definitions of gross and operating profit here: gross profit and operating profit.
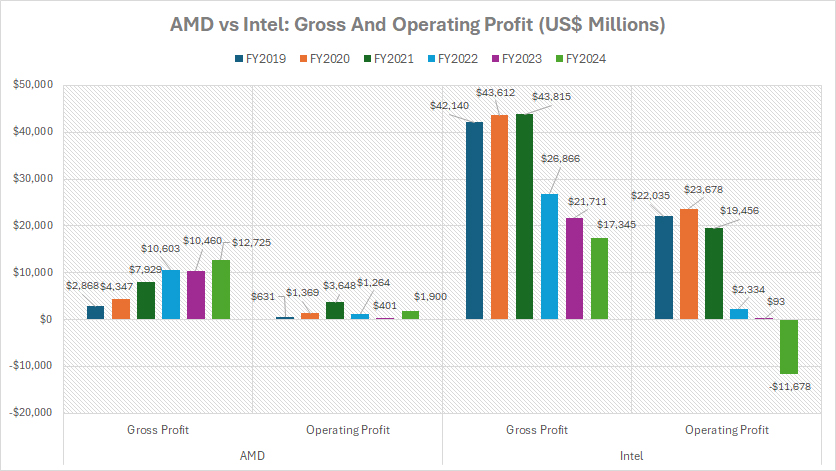
The accompanying graph highlights that Intel consistently achieves a much higher gross profit compared to AMD. Similarly, Intel’s operating profit has historically outperformed AMD’s.
In fiscal year 2024, Intel reported a gross profit of $17.3 billion, significantly exceeding AMD’s gross profit of $12.7 billion. However, Intel’s operating performance paints a different picture.
The company recorded a substantial operating loss of $11.7 billion in fiscal year 2024, while AMD reported a positive operating profit of $1.9 billion during the same period.
Notably, AMD’s gross profit has shown remarkable growth over the six-year span from 2019 to 2024. In contrast, Intel’s gross profit has declined sharply, falling from over $40 billion to $17 billion in the latest fiscal year.
This downward trajectory is also reflected in Intel’s operating profit, which once surpassed $20 billion. It dropped drastically to just $93 million in fiscal year 2023 and further deteriorated to a loss of $11.7 billion by fiscal year 2024.
AMD Vs Intel: Pre-Tax And Net Income
amd-vs-intel-pre-tax-and-net-income
(click image to expand)
You can find the definitions of pre-tax and net profit here: pre-tax profit and net profit.
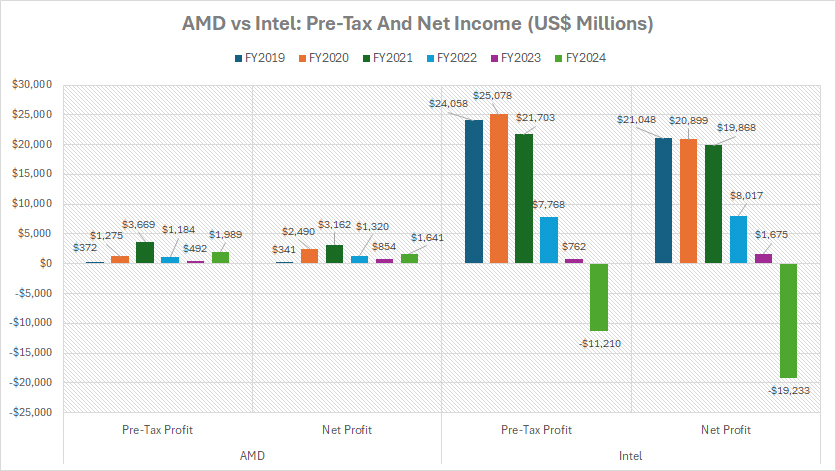
Historically, Intel has achieved significantly higher pre-tax and net income compared to AMD, as illustrated in the graph above. However, this dominance has eroded over time, with Intel experiencing substantial declines in both metrics.
In fiscal year 2023, Intel’s pre-tax income fell to a record low of $762 million, while its net income dropped to $1.7 billion. This downward trajectory intensified in fiscal year 2024, as Intel recorded pre-tax losses of $11.2 billion and net losses amounting to $19.2 billion.
On the other hand, AMD demonstrated more stable financial performance in fiscal year 2024. The company reported a pre-tax income of $2 billion and a net income of $1.6 billion, showcasing its ability to maintain profitability despite industry challenges.
These contrasting results underscore the shifting dynamics between Intel and AMD in recent years.
AMD Vs Intel: Gross And Operating Profit Margins
amd-vs-intel-gross-and-operating-profit-margin
(click image to expand)
You can find the definitions of gross and operating profit here: gross profit and operating profit.
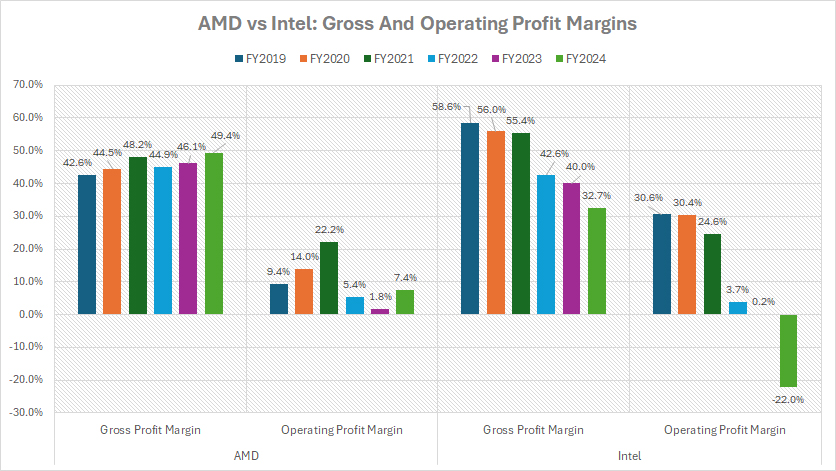
Intel has historically maintained a strong lead over AMD in terms of gross and operating profit margins, as illustrated in the chart above. However, this advantage has eroded significantly in recent years.
Between 2019 and 2024, Intel’s gross margin has seen a sharp decline, dropping from 59% to just 33% in the latest fiscal year. Similarly, its operating margin, which stood at an impressive 31% in 2019, fell to 0% in fiscal year 2023 and further deteriorated to -22% in 2024, reflecting serious financial and operational challenges.
In contrast, AMD has demonstrated a positive trajectory in its gross margin, increasing from 43% in 2019 to 49% in fiscal year 2024. While AMD’s operating margin has also faced some fluctuations, decreasing from its peak of 22% in 2021, it remains more stable than Intel’s at 7% in fiscal year 2024.
These figures showcase AMD’s relative consistency and adaptability amidst changing market conditions.
AMD Vs Intel: Pre-Tax And Net Profit Margins
amd-vs-intel-pre-tax-and-net-profit-margin
(click image to expand)
You can find the definitions of pre-tax and net profit here: pre-tax profit and net profit.
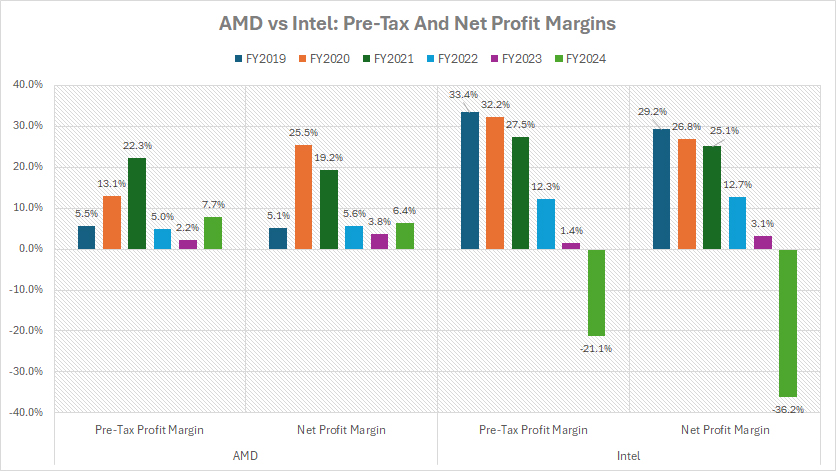
Intel’s pre-tax and net profit margins have followed a similar downward trajectory, experiencing significant deterioration since fiscal year 2019.
For instance, Intel’s pre-tax margin declined steeply from 33% in 2019 to 1.4% in 2023, further dropping to -21% in 2024. Similarly, its net profit margin, which stood at an impressive 29% in 2019, fell sharply to 3% in 2023 and deteriorated further to -36% by fiscal year 2024.
In contrast, AMD has displayed much greater stability in its financial performance. As of fiscal year 2024, AMD reported a pre-tax profit margin of 8% and a net profit margin of 6%.
Notably, AMD has avoided incurring any pre-tax or net losses throughout the six-year period from 2019 to 2024, highlighting its robust profitability and resilience.
Insight
AMD’s profitability has remained stable and, in some aspects, has grown significantly, reflecting its ability to adapt to market changes and capitalize on opportunities.
Intel, despite its historical dominance, is facing mounting challenges that have eroded its profitability, including declining demand, increasing competition, and operational inefficiencies.
This contrast underscores AMD’s strategic agility and resilience, while highlighting the critical need for Intel to address its structural and strategic issues to regain financial stability.
References and Credits
1. All financial figures presented were obtained and referenced from AMD’s and Intel’s annual reports published on the respective company’s investor relations page: AMD Investor Relations and Intel Investor Relations.
2. Pexels Images.
Disclosure
We may use artificial intelligence (AI) tools to assist us in writing some of the text in this article. However, the data is directly obtained from original sources and meticulously cross-checked by our editors multiple times to ensure its accuracy and reliability.
If you find the information in this article helpful, please consider sharing it on social media. Additionally, providing a link back to this article from any website can help us create more content like this in the future.
Thank you for your support and engagement! Your involvement helps us continue to provide high-quality, reliable content.

