TV streaming. Pixabay image.
Roku Inc. is a leading American company specializing in manufacturing and selling digital media players and streaming devices. The company was founded in 2002 and is headquartered in Los Gatos, California.
Roku’s products are designed to provide users with easy access to a wide range of online streaming services, including popular platforms like Netflix, Hulu, and Amazon Prime Video.
The company has gained a reputation for providing high-quality, affordable products that offer great value to consumers. Today, Roku is a household name and has become a go-to option for anyone streaming their favorite movies, TV shows, and other content online.
This article will provide information on Roku’s (NASDAQ: ROKU) revenue and its breakdown. We will also explore the company’s profit and margins by segment. Furthermore, we will examine Roku’s asset distribution by region to determine where the company locates most of its assets.
Let’s get started.
Please use the table of contents to navigate this page.
Table Of Contents
Definitions And Overview
O2. Roku Business Strategy
O3. How Does Roku Earn Revenue
Consolidated Revenue
B1. Revenue By Year
B2. Revenue By Quarter
B3. Revenue By TTM
B4. Revenue YoY Growth Rates
Revenue By Segment
C1. Platform And Devices Revenue
C2. Platform And Devices Revenue In Percentage
C3. Platform And Devices Revenue Growth Rates
Consolidated Profit And Margins
D1. Gross Profit And Margin
D2. Operating Profit And Margin
D3. Net Profit And Margin
D4. Adjusted EBITDA And Margin
Profit And Margins By Segment
E1. Platform And Devices Gross Profit
E2. Platform And Devices Gross Margin
Long-Lived Assets By Region
F1. U.S., U.K., And Other Countries Long-Lived Assets
F2. U.S., U.K., And Other Countries Long-Lived Assets In Percentage
Conclusion And Reference
S1. Conclusion
S2. References and Credits
S3. Disclosure
Definitions
To help readers understand the content better, the following terms and glossaries have been provided.
Roku Revenue Segments: Roku Inc. operates through two segments: Devices and Platform. The Devices segment offers streaming players and accessories that enable users to access streaming content through their televisions.
The Platform segment provides advertising services and content distribution through its operating system for television manufacturers and service providers.
Roku’s streaming services and devices have garnered a large user base due to their ease of use and affordability. With its innovative technology and user-friendly interface, Roku has become one of the most popular streaming services.
Investors interested in Roku’s streaming statistics and revenue per user may find more information on this page: Roku active accounts, streaming hours, and ARPU.
Adjusted EBITDA: Adjusted EBITDA (Earnings Before Interest, Taxes, Depreciation, and Amortization) is a financial metric to evaluate a company’s profitability.
It is calculated by taking a company’s earnings before deducting interest, taxes, depreciation, and amortization expenses, then adjusting to account for non-recurring expenses, one-time charges, and other items that may not reflect the company’s ongoing operations.
This metric is often used in financial analysis to compare the profitability of different companies, as it provides a more accurate picture of a company’s financial health than traditional earnings measures.
In Roku’s case, the adjusted EBITDA excludes other income (expense), net, stock-based compensation expense, depreciation and amortization, restructuring charges, and income tax (benefit)/expense from the net income (loss) of the period.
Long-Lived Asset: Long-lived assets are tangible or intangible assets a company expects to use for over a year.
Examples of long-lived tangible assets include property, plant, and equipment such as machinery, buildings, and vehicles. Intangible assets such as patents, trademarks, and copyrights are also considered long-lived assets.
These assets are typically capitalized and then depreciated or amortized over their useful lives to reflect their gradual loss of value over time.
Roku Business Strategy
Roku’s business strategy revolves around being a leading streaming platform that offers consumers access to a variety of content. The company aims to achieve this by partnering with content providers like Netflix, Hulu, and Amazon and making their content available on the Roku platform.
In addition to content partnerships, Roku also generates revenue through advertising and selling its streaming devices. By offering a range of devices at different price points, Roku aims to appeal to a broad range of consumers.
Roku’s focus on providing a seamless user experience has also been a key part of its business strategy. The company has invested heavily in developing its software and user interface to make it easy for consumers to find and watch the content they want.
Overall, Roku’s business strategy is centered around providing a comprehensive streaming experience that is accessible to everyone. The company has become a leading player in the streaming market by partnering with content providers, selling its own devices, and focusing on user experience.
How Does Roku Earn Revenue
Roku earns revenue through various streams. One of the primary revenue sources is the sale of its streaming devices and accessories.
Additionally, Roku earns a portion of the revenue generated by the channels available on its platform. This revenue-sharing model helps content providers monetize their channels and keeps Roku’s platform competitive. Roku also offers advertising services to marketers through its platform, allowing them to reach a large and engaged audience.
Lastly, Roku sells data on user behavior to marketers and content providers, which helps them make informed decisions about their content and advertising strategies.
Revenue By Year
roku-total-revenue-by-year
(click image to expand)
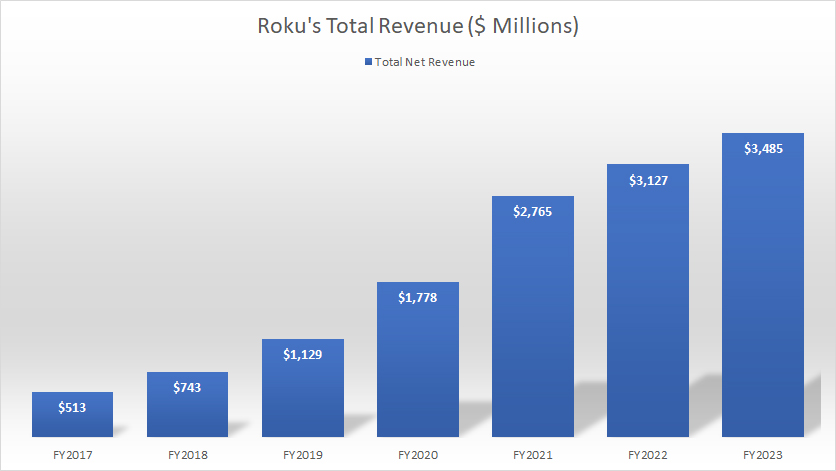
Roku earned $2.8 billion, $3.1 billion, and $3.5 billion in annual revenue for fiscal years 2021, 2022, and 2023, respectively.
The revenue in fiscal year 2023 represents a rise of 13% over 2022 or 25% over 2021. Since fiscal 2017, Roku’s total revenue has grown by over 600% or 10% annually over the past six years.
Revenue By Quarter
roku-total-revenue-by-quarter
(click image to expand)
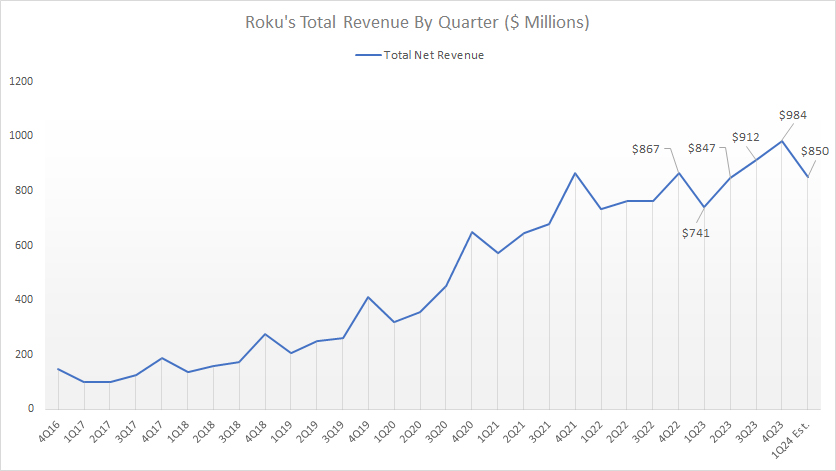
Roku earned $847 million, $912 million, and $984 million in quarterly revenue in fiscal 2Q 2023, 3Q 2023, and 4Q 2023, respectively.
Roku forecasts it will earn $850 million in 1Q 2024, up 15% over the same quarter a year ago.
The 4Q 2023 quarterly revenue of $984 million represents a growth rate of 13% over the same quarter a year ago.
Revenue By TTM
roku-total-revenue-by-ttm
(click image to expand)
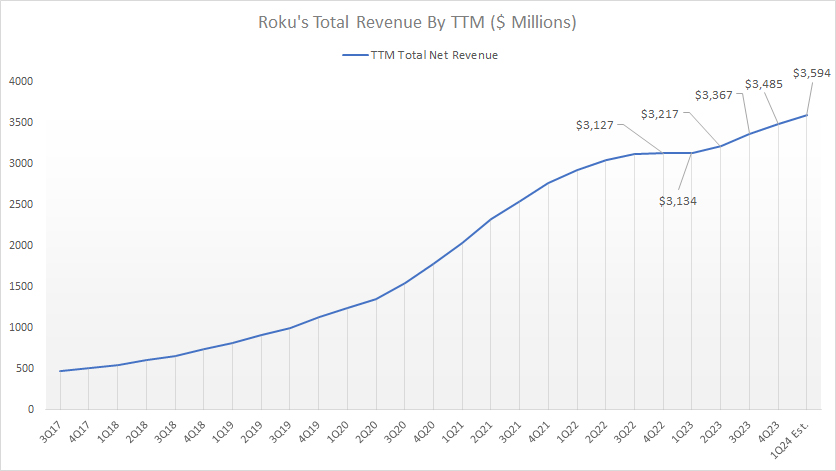
Roku’s TTM revenue reached record figures as of 2023, topping an all-time high of $3.5 billion in fiscal 4Q 2023.
In the first quarter of 2024, Roku’s TTM revenue is expected to increase further to $3.6 billion, representing a growth rate of 16% over the same quarter a year ago.
Revenue YoY Growth Rates
roku-total-revenue-growth-rates
(click image to expand)
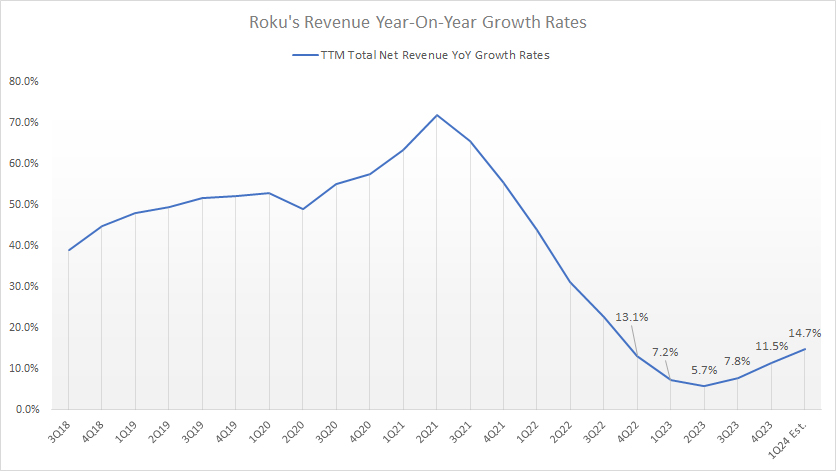
Roku’s revenue growth has considerably slowed in recent periods. Roku has only managed to record low double-digit revenue growth, as shown in the chart above.
Revenue growth slightly improved in 2023, reaching 11.5% as of 4Q 2023. Roku’s projected revenue of $850 million in 1Q 2024 could push revenue growth to 14.7% year-over-year.
Platform And Devices Revenue
roku-platform-and-devices-revenue
(click image to expand)
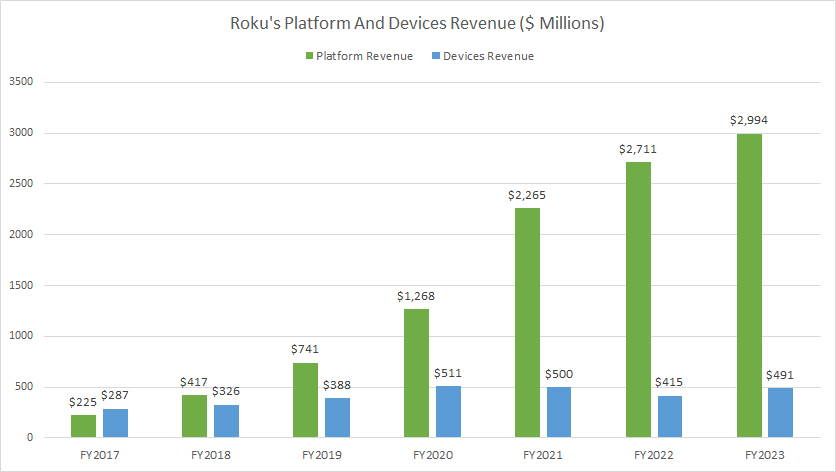
Roku earned $2.3 billion, $2.7 billion, and $3.0 billion in Platform revenue in fiscal years 2021, 2022, and 2023, respectively. During the same periods, Roku earned $500 million, $415 million, and $491 million in Devices revenue.
The revenue generated from Roku’s Platform segment is significantly higher than its Devices segment and has a higher growth rate.
Platform And Devices Revenue In Percentage
roku-platform-and-devices-revenue-in-percentage
(click image to expand)
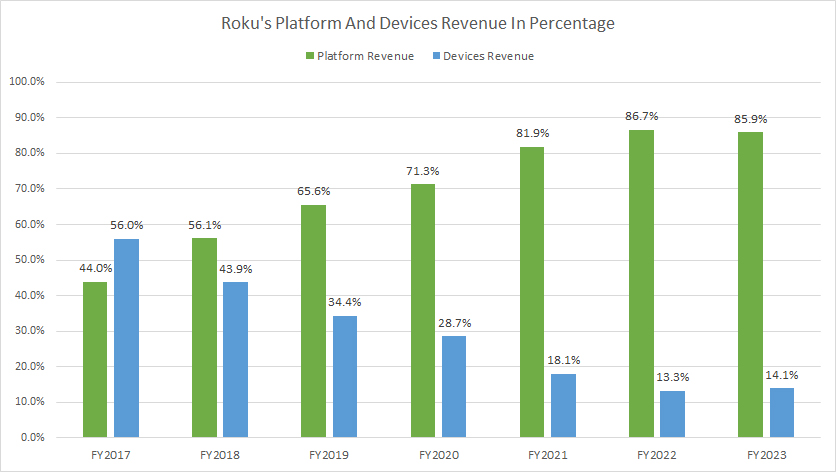
Roku’s Platform segment contributes much higher revenue to the total. The ratio has risen to 86% as of 2023 from 44% in 2017.
On the other hand, Roku’s Devices segment accounted for just 14% of the company’s total sales as of fiscal 2023. The revenue contribution from the Devices segment has decreased considerably since 2014.
Platform And Devices Revenue Growth Rates
roku-revenue-by-segment-growth-rates
(click image to expand)
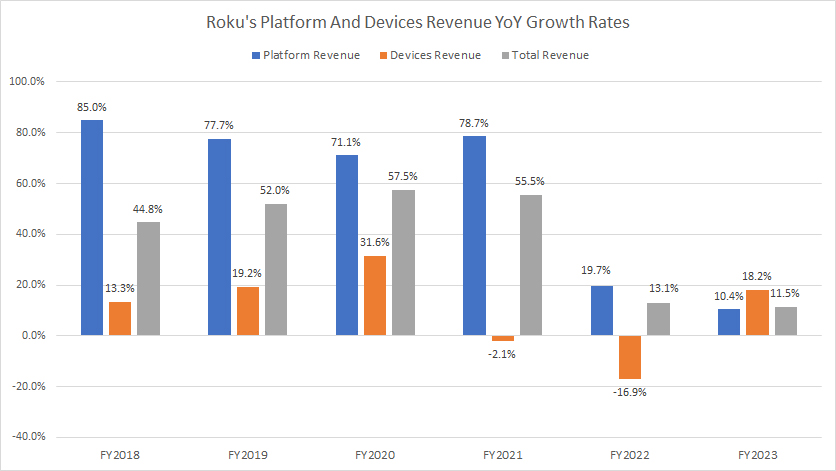
Roku’s growth has significantly slowed down across all segments since 2022. As of 2023, the Platform segment of Roku grew by only 10.4%, while the Devices segment rose by 18.2%. The total sales growth for Roku in 2023 was 11.5%.
A notable trend is that the Devices segment has shifted from negative to positive growth.
Gross Profit And Margin
roku-gross-profit-and-gross-margin
(click image to expand)
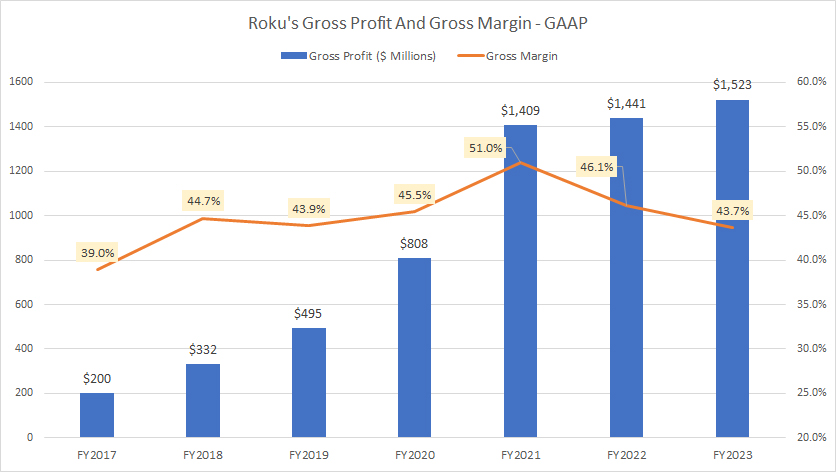
Roku’s gross profit hit an all-time high of $1.5 billion in fiscal year 2023, a 6% increase from 2022 and an 8% increase from 2021.
However, despite the record figure, the gross margin dropped to 43.7% in the same period, which indicates lower profitability. It is possible that Roku’s gross margin reached its peak in the fiscal year 2021, at 51%.
The decreasing gross margin of Roku could be attributed to the rising costs associated with acquiring advertising inventory and the increasing costs of licensed and produced content.
Operating Profit And Margin
roku-operating-profit-and-operating-margin
(click image to expand)
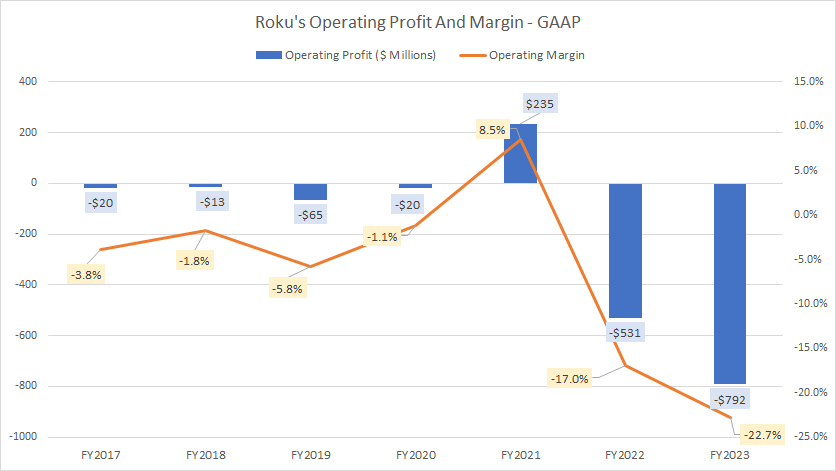
Roku has struggled to achieve profitability, with only one year of positive operating income in the past seven years.
From fiscal year 2016 to 2023, the company’s operating profit and margins were primarily negative, indicating that its operations were not profitable.
In fact, Roku’s operating loss reached a record high of $792 million in fiscal year 2023. This was mainly due to increased research and development expenses and skyrocketing sales and marketing costs.
Net Profit And Margin
roku-net-profit-and-net-margin
(click image to expand)
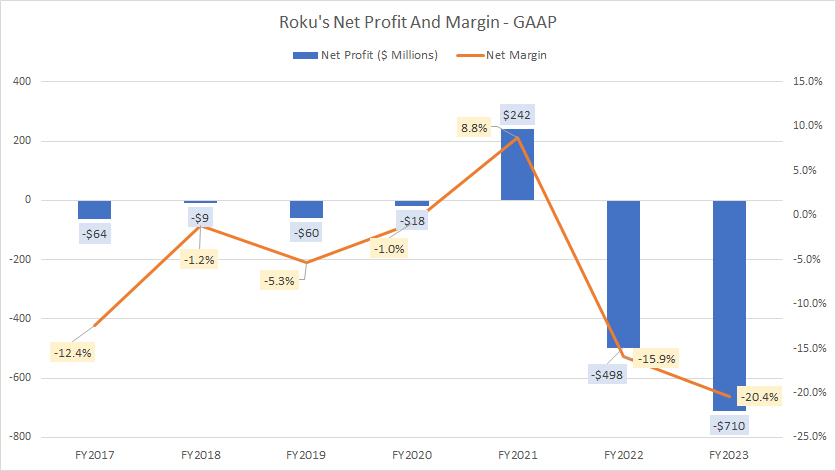
Roku had only managed to generate a net profit of $242 million in fiscal year 2021. However, it suffered net losses throughout all fiscal years between 2016 and 2023.
In fiscal year 2023, Roku’s net loss reached a staggering $710 million, the company’s highest loss ever recorded.
Adjusted EBITDA And Margin
roku-adjusted-ebitda-and-adjusted-ebitda-margin
(click image to expand)
The definition of Roku’s adjusted EBITDA is available here: adjusted EBITDA.
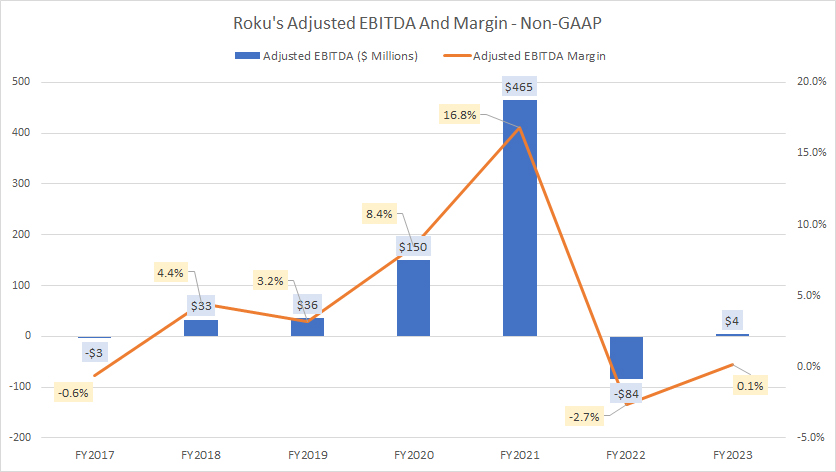
Roku has had positive adjusted EBITDA in most fiscal years, although the figures were relatively small.
However, in fiscal year 2021, the company achieved its highest adjusted EBITDA of over $465 million, with an EBITDA margin of 17%, which is likely the best result the company has ever produced.
Unfortunately, in the fiscal year 2022, Roku’s adjusted EBITDA reverted to a loss, totalling -$84 million, with the respective margin at -2.7%.
In the following year, fiscal year 2023, Roku’s adjusted EBITDA was just $4 million, while the adjusted EBITDA margin reached 0.1%.
Platform And Devices Gross Profit
roku-platform-and-devices-gross-profit
(click image to expand)
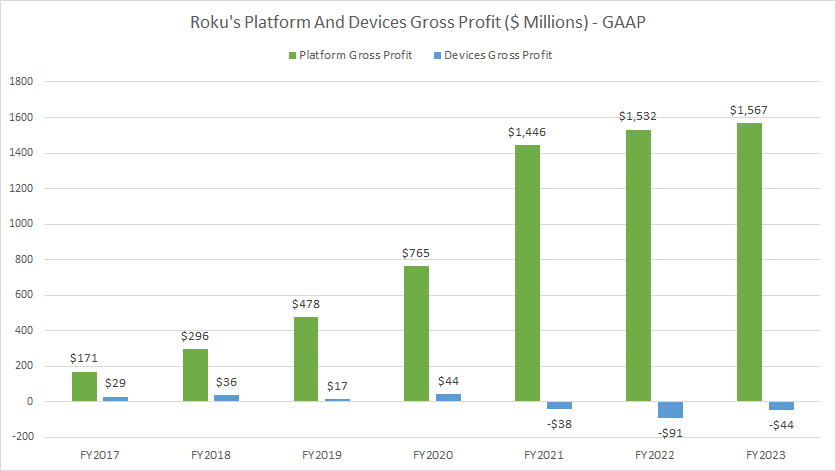
The profit by segment shows that the Platform segment generates most of Roku’s profit.
Roku’s Platform segment achieved a record-breaking gross profit of $1.6 billion in fiscal year 2023, the highest ever for this segment. The cumulative gross profit for the Platform segment between 2021 and 2023 was $1.5 billion, $1.5 billion, and $1.6 billion, respectively.
However, Roku’s Devices segment has not been profitable since 2021 and has incurred losses of $38 million, $91 million, and $44 million in fiscal years 2021, 2022, and 2023, respectively.
Platform And Devices Gross Margin
roku-platform-and-devices-gross-margin
(click image to expand)
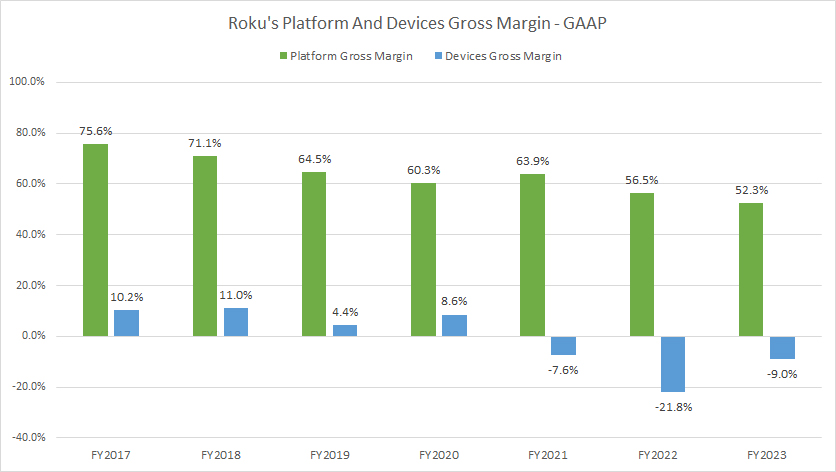
Roku’s Platform gross profit has increased, but the gross margin has significantly decreased, reaching a record low of 52.3% in 2023.
Meanwhile, the Devices segment has experienced an even worse gross margin, which plummeted to a new low of -21.8% in the fiscal year of 2022, indicating a significant loss. The negative margin was slightly reduced in fiscal year 2023 to -9%.
Simply put, Roku doesn’t earn any profit in the Devices segment.
U.S., U.K., And Other Countries Long-Lived Assets
roku-long-lived-assets-by-region
(click image to expand)
The definition of Roku’s long-lived assets is available here: long-lived assets.
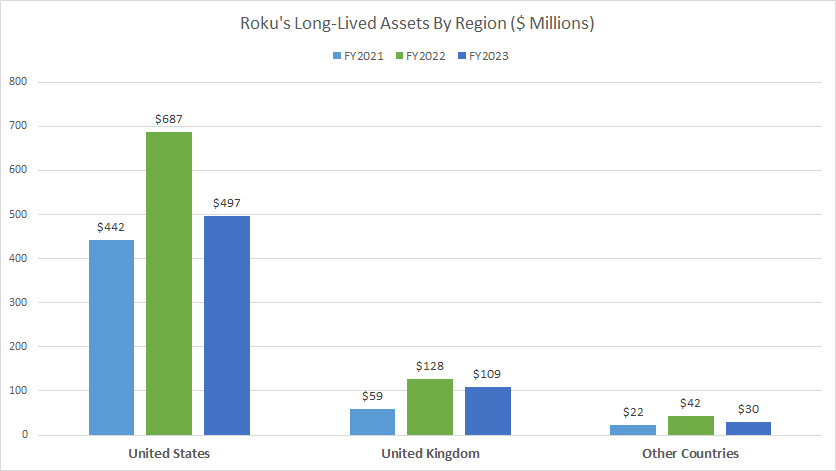
Roku primarily operates in the United States since the company’s long-lived assets, such as buildings, offices, and equipment, are located in this region.
As of 2023, Roku had approximately $497 million of long-lived assets in the U.S., the highest among all regions. This figure increased by 12% from fiscal year 2021 but decreased by 28% from 2022.
Since the company’s long-lived assets are in the U.S., Roku should generate most of its revenue from the North American region.
Besides the U.S., Roku also holds significant assets in the U.K., primarily serving the European market. Roku’s long-lived assets in the U.K. have more than doubled, reaching $109 million as of 2023, illustrating the growing importance of the European market to the company.
The long-lived assets in other countries are insignificant.
U.S., U.K., And Other Countries Long-Lived Assets In Percentage
roku-long-lived-assets-by-region-in-percentage
(click image to expand)
The definition of Roku’s long-lived assets is available here: long-lived assets.
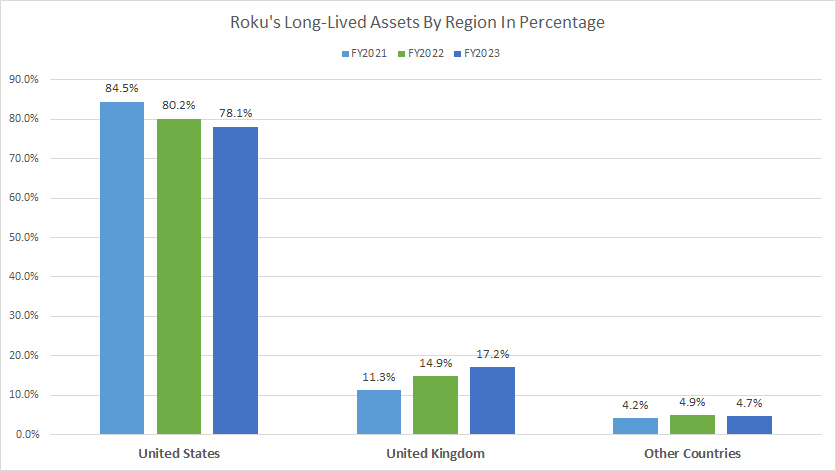
Roku’s U.S. long-lived assets account for the majority of the company’s total long-lived assets, reaching 78.1% as of 2023.
On the other hand, Roku’s U.K. long-lived assets comprised only 17.2% of the total as of fiscal 2023, while other countries contributed 4.7% in the same period.
Roku considers the European region an important market and has significantly increased its assets in this region.
Conclusion
To summarize, Roku has experienced significant revenue growth but has slowed down significantly since the pandemic. Although the revenue has increased, the margins have come under pressure, especially in fiscal years 2022 and 2023.
Additionally, Roku is not profitable and has been unprofitable in its operations and net level in most fiscal years since 2017. Roku was able to generate a profit only in the fiscal year 2021 over the past seven years.
Besides poor profitability, Roku also suffers from poor margins. Roku earns money only in the Platform segment, while it incurs losses in the Devices segment.
Roku primarily operates in the United States, where most of its long-lived assets are located. However, Roku has expanded considerably in the United Kingdom, doubling its assets there since 2021. Therefore, the European market would be Roku’s second most important market after North America.
Credits and References
1. All financial figures presented in this article were obtained and referenced from Roku, Inc.’s SEC filings, earnings reports, financial statements, news releases, shareholder letters, etc, which are available in Roku Financial Results.
2. Featured images in this article are obtained free and are used without any attribution from Pixabay.
Disclosure
References and examples such as tables, charts, and diagrams are constantly reviewed to avoid errors, but we cannot warrant the total correctness of all content.
The content in this article is for informational purposes only and is neither a recommendation nor a piece of financial advice to purchase a stock.
If you find the information in this article helpful, please consider sharing it on social media and provide a link back to this article from any website so that more articles like this can be created in the future.
Thank you!

