GMC 2020 Terrain SUV. Source: www.gmc.com
General Motors, one of the largest automobile manufacturers in the world, has a long history of providing value to its shareholders through various means.
One of the ways in which the company rewards its investors is by issuing cash dividends. Cash dividends are payments a company makes to its shareholders, typically as a portion of its profits.
In the case of General Motors, the company has a track record of consistent and reliable dividend payments, making it an attractive investment opportunity for those seeking a steady income stream.
This article explores factors that may impact General Motors’ dividend payments, including those that favor the dividends and those that may negatively affect the dividends.
Let’s take a look.
Please use the table of contents to navigate this page.
Table Of Contents
Definitions And Overview
- Revenue Per Vehicle
- Retained Earnings
- Adjusted EBIT
- Adjusted Automotive Free Cash Flow
- Equity Income
Favorable Factors
F1. Growing Vehicle Sale Price
F2. A Durable North American Operation
F3. Profitable GM Financial
F4. Consistent Profit And Cash Flow
F5. Increasing Retained Earnings
F6. Low Debt Level And Leverage
Unfavorable Factors
U1. An Unreliable Dividend History
U2. Decreasing Vehicle Sales
U3. An Inconsistent International Operation
U4. Cash-Burning Cruise
U5. Worsening Sales And Market Share In China
Summary And Reference
S1. Summary
S2. References and Credits
S3. Disclosure
Definitions
To help readers understand the content better, the following terms and glossaries have been provided.
Revenue Per Vehicle: Revenue per vehicle refers to the amount of money a company earns for each vehicle sold. It is calculated by dividing a company’s total revenue by the number of cars sold during a specific period.
This metric is commonly used in the automotive industry to measure a company’s sales performance and profitability. A higher revenue per vehicle indicates that a company is generating more revenue from each sale, which can be a sign of strong pricing power and efficient operations.
Retained Earnings: Retained earnings are the profits that a company keeps instead of distributing as dividends to its shareholders. These earnings are typically reinvested into the business to support growth and expansion or used to pay off debts.
Retained earnings can be an indication of a company’s financial health and stability as it shows that the company is profitable and capable of investing in its operations.
Adjusted EBIT: GM’s EBIT adjusted is presented net of
non-controlling interests and is used by management and can be used by investors to review the company’s consolidated operating results
because it excludes automotive interest income, automotive interest expense, income taxes, and certain additional adjustments that are not considered part of the core operations.
Examples of adjustments to EBIT include but are not limited to, impairment charges on long-lived assets, other exit costs resulting from strategic shifts in operations or discrete market and business conditions, and certain costs arising from legal matters.
The corresponding measure for the GM Financial segment is EBT adjusted because interest income and interest expense are part of operating results when assessing and measuring the operational and financial performance of the segment.
Adjusted Automotive Free Cash Flow: GM’s adjusted automotive free cash flow is used by management and can be used by investors to review the liquidity of the automotive operations and to measure and monitor the performance against capital allocation program and evaluate the automotive liquidity against the substantial cash requirements of the automotive operations.
GM measures the adjusted automotive free cash flow as automotive operating cash flow from operations less capital expenditures adjusted for management actions.
Management actions can include voluntary events such as discretionary contributions to employee benefit plans or nonrecurring specific events such as a closure of a facility that are considered special for EBIT adjusted purposes.
Equity Income: Equity income, also known as income from investments in associates or joint ventures, refers to the portion of profit or loss that a company earns by holding an ownership interest in another company.
In accounting standards, equity income is recognized when the investor has significant influence over the investee, but not control. This means that the investor has the ability to participate in the investee’s financial and operating policy decisions.
Equity income is recorded on the investor’s income statement as a separate line item and is calculated based on the investor’s proportionate share of the investee’s earnings.
Growing Vehicle Sale Price
GM Vehicle Average Selling Price
The definition of GM’s revenue per vehicle is available here: revenue per vehicle.
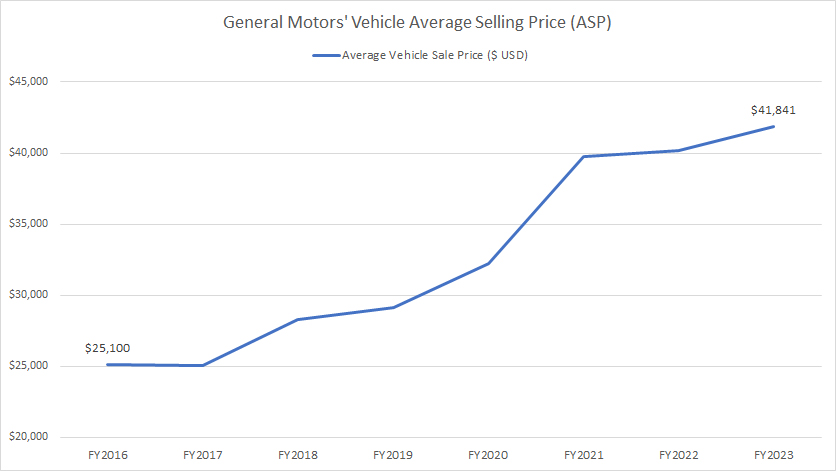
One of the most important factors that support General Motors’ cash dividends is the company’s growing average revenue per vehicle or vehicle average selling price (ASP), as presented in the chart above.
As seen in the chart above, GM’s vehicle ASP has risen considerably since 2016 and reached a record high of nearly $42,000 as of 2023. Since 2016, GM’s vehicle ASP has increased by roughly 68% or 10% per year on average over the last seven years.
GM’s growing vehicle ASP is a sign of the company’s strong brand power and solid competitive advantage. Essentially, the growing ASP helps to drive an increasing revenue and possibly a bigger profit for the company.
Although GM has significantly increased its vehicle ASP, its market share has remained relatively strong in the U.S., as depicted in this article: GM market share in the U.S. GM’s solid market share in the U.S. implies the company’s durable moat in the North American market.
In other words, users stick with GM’s products despite the increasing vehicle prices. They love the quality and reliable products the company builds. They still buy even though prices keep climbing.
This factor plays a significant role in ensuring a safe dividend from General Motors.
A Durable North American Operation
GM North America Profit And Margin
* EBIT stands for earnings before interest and taxes.
* Adjusted EBIT is a measurement used by GM to exclude non-recurring and non-core items such as special or one-time income or expenses to reflect the true nature of its core operation.
* GM’s fiscal year begins on Jan 1 and ends on Dec 31.
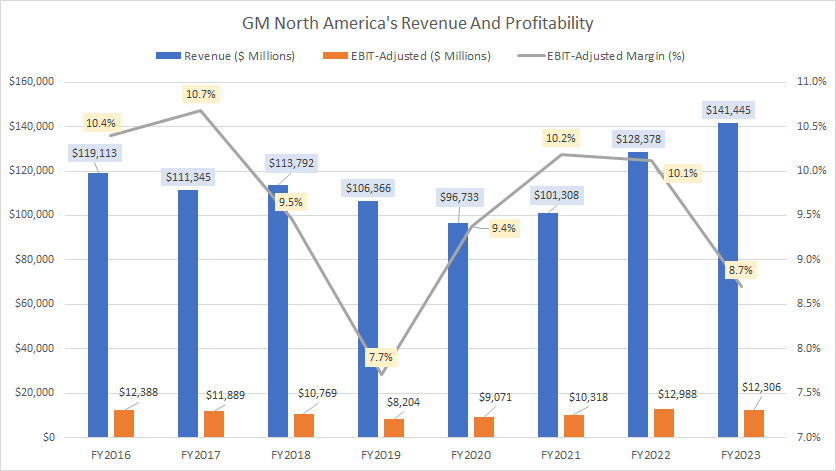
GM’s North American operation primarily includes the results from the U.S. The definition of GM’s adjusted EBIT is available here: adjusted EBIT.
For your information, General Motors gets the majority of its revenue and profit from North America, as shown in this article: GM revenue and profit by region.
As such, North America is a critical segment for General Motors. A negative impact in this segment can potentially affect the company’s cash dividends.
Fortunately, GM’s North America has been able to navigate through many challenges, including the COVID-19 crisis, multiple UAW strikes, and disruptive supply chains, indicating the business durability of this segment.
For example, GM saw only a slight decrease in revenue and profit in North America during the height of the COVID-19 pandemic between 2019 and 2021. In post-COVID periods, GM’s revenue and profit in North America have remarkably recovered, overcoming many difficulties in these periods.
GM’s durable North American operation ensures shareholders a continuous dividend income stream.
Profitable GM Financial
GM Financial Profit And Margin
* EBT stands for earnings before taxes, as interest is part of the operating item of GM Financial.
* Adjusted EBT is a measurement done by GM to exclude non-recurring and non-core items such as special or one-time income or expenses to reflect the true nature of its core operation.
* GM’s fiscal year begins on Jan 1 and ends on Dec 31.
The definition of GM Financial’s adjusted EBT and EBT margin is available here: adjusted EBIT.
GM Financial is one of GM’s wholly-owned subsidiaries and is responsible for the financial side of the business. GM Financial gives out loans and credits to retail customers and also dealers.
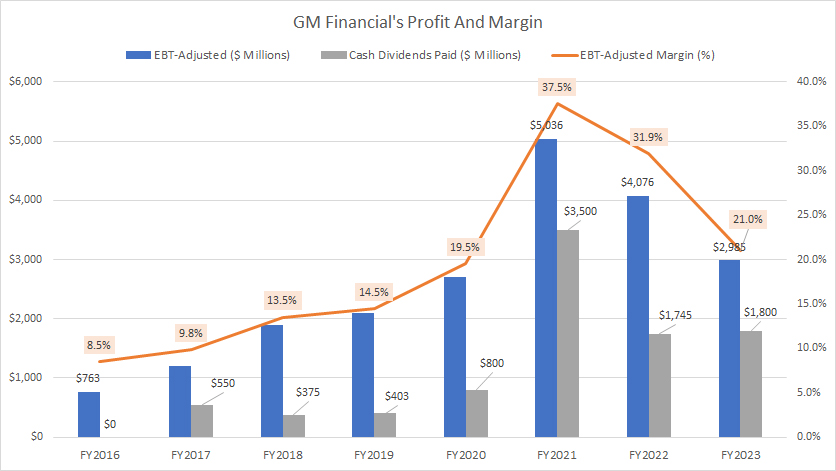
That said, GM Financial is a strong business. The division generates tons of money. It is highly profitable, with an EBT margin averaging 27.5% since 2020, which is much higher than the automotive sector.
Far from over, GM Financial has been able to return some of the profits through cash dividends to the parent company. The dividend returned totaled $3.5 billion, $1.7 billion, and $1.8 billion in fiscal years 2021, 2022, and 2023, respectively. The cash received actually goes to GM’s operating cash flow.
GM also pays cash dividends to shareholders from the cash generated through operating activities. Therefore, GM Financial has indirectly contributed to the capital being returned to shareholders.
Consistent Profit And Cash Flow
GM Free Cash Flow And Net Earnings
* Adjusted automotive free cash flow and adjusted net earnings are measurements done by GM to exclude non-recurring and non-core items such as special or one-time income or expenses to reflect the true nature of its core operation.
* Adjusted net earnings are calculated after accounting for taxes and automotive interest expenses.
* GM’s fiscal year begins on Jan 1 and ends on Dec 31.
The definition of GM’s adjusted automotive FCF is available here: adjusted automotive FCF.
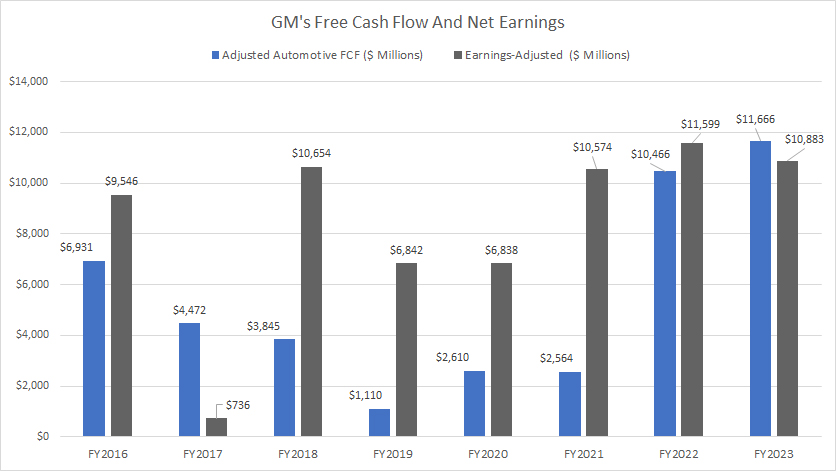
General Motors generates consistent profits and free cash flow, irrespective of the environments in which it operates, including a pandemic, a high-interest-rate environment, a disruptive supply chain, a union strike, etc.
As shown in the chart above, GM’s automotive free cash flow and adjusted profit have come quite consistently. Although the automotive free cash flow dived during the COVID-19 crisis, it has remarkably recovered in post-pandemic periods.
On the other hand, GM’s adjusted net earnings have done an even better job, clocking in more than $10 billion since 2021.
GM’s consistent streams of automotive free cash flow and net earnings have ensured the company’s consistent return of capital to shareholders.
Increasing Retained Earnings
General-Motors-Retained-Earnings
(click image to expand)
* GM’s fiscal year begins on Jan 1 and ends on Dec 31.
The definition of retained earnings is available here: retained earnings.
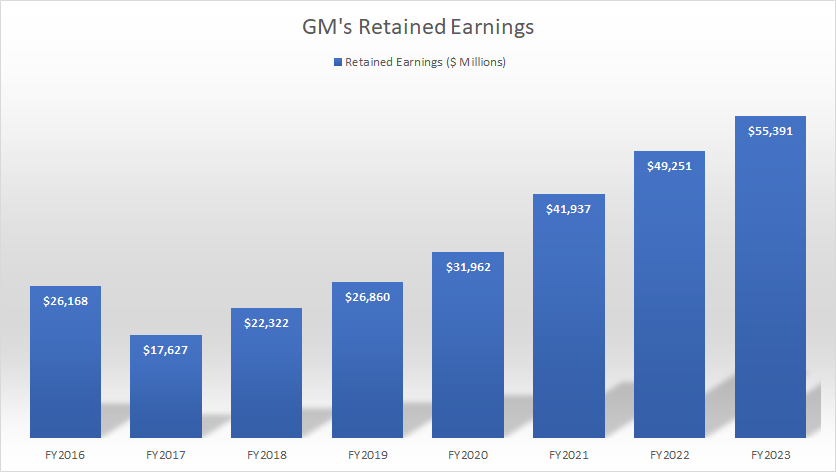
General Motors (GM) has consistently generated profits and free cash flow, which is evident from the increasing retained earnings over the years.
As the chart above shows, GM’s retained earnings have grown by 111% – from $26.2 billion in 2016 to $55.4 billion in 2023.
What’s remarkable is that GM has been able to achieve this growth even after paying cash dividends to shareholders.
This implies that the company still has profits left after distributing the dividends.
Low Debt Level And Leverage
GM Debt Level And Leverage
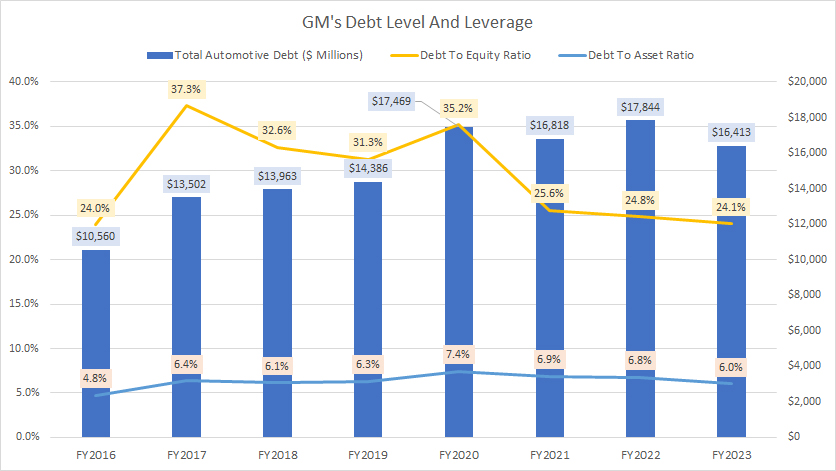
General Motors has low debt and leverage and a profitable and positive cash flow.
As seen, GM’s automotive debt topped only $16.4 billion as of 2023, a decrease of 8% over 2022. This amount of debt made up only 24% of the company’s equity, while the debt-to-asset ratio came to just 6%.
More importantly, these ratios have remained relatively unchanged, implying that the debt leverages have remained stable.
In addition, GM’s interest expense has also been steady. GM’s interest coverage ratio has significantly improved post-COVID, according to this article: GM interest expense coverage ratio.
Moreover, GM has enough liquidity to cover its coming debt payments, as shown in this article: GM debt due, cash, and credit rating.
Therefore, GM’s debt level does not seem to threaten the company’s financial health. As a result, GM’s dividends appear safe.
An Unreliable Dividend History
GM Dividends Declared Per Share
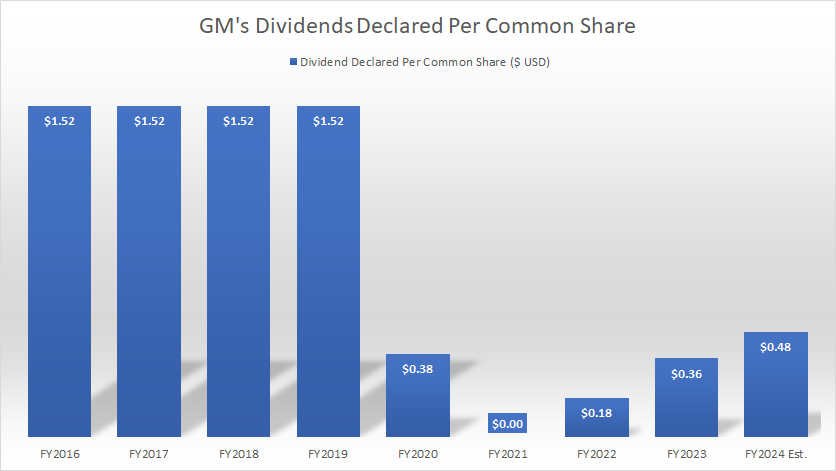
As shown in the chart above, GM has a history of unreliable dividend payments.
In 2020, GM’s dividends were significantly lower than the ones in 2019. In addition, GM’s dividends were totally wiped out in 2021 due to the COVID-19 pandemic. GM only reinstated the dividends in 2022.
Although General Motors has reinstated its dividends, the amounts paid out are considerably lower than those paid in 2019 before the pandemic began. By 2024, the total cash dividends paid out by GM may only amount to $0.48 per share, which is significantly less than the previous highs.
General Motors’ decision to suspend dividends during the pandemic may suggest that its business models are less resilient than anticipated and can be affected by unexpected events like COVID-19.
On the other hand, Altria and Philip Morris International raised their dividend rates during the pandemic. Therefore, General Motors’ dividends are less durable and have a history of suspending dividends, which may reduce the rate to zero during a crisis.
Decreasing Vehicle Sales
GM Vehicle Wholesale Numbers
The definition of GM’s revenue per vehicle is available here: revenue per vehicle.
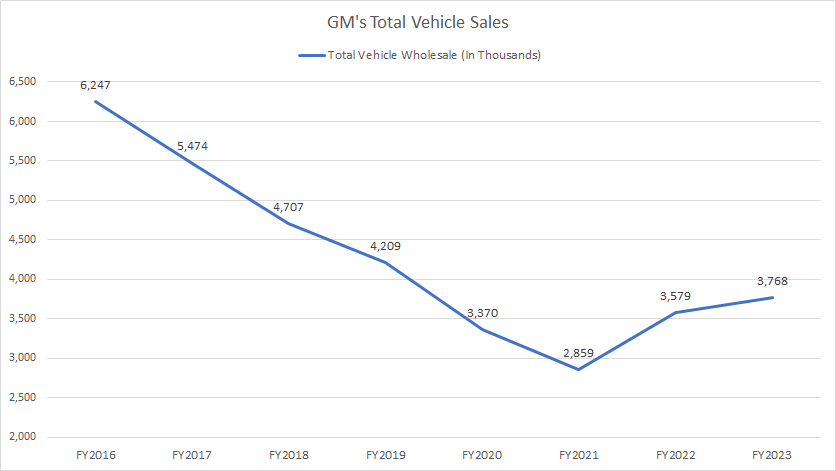
General Motors faces the risk of lower cash dividends if its vehicle sales continue to decline. Fewer sales mean less revenue and profits. A breakdown of GM worldwide sales is available here: GM vehicle sales by country and region.
However, GM has been able to reverse the trend, with vehicle sales reaching 3.8 million worldwide in 2023, up over 30% from the record low of 2.9 million in 2021.
Despite this improvement, sales are still significantly lower than in previous years. For example, the 3.8 million car sales in 2023 are 40% lower than the 2016 result.
To compensate for the lower sales numbers, GM may increase its vehicles’ average selling price (ASP), which we saw in this discussion: GM revenue per vehicle. However, relying solely on ASP is not sustainable in the long term. At the end of the day, it is the volume that counts.
Therefore, dividend investors should monitor GM’s vehicle sales numbers to assess the company’s performance.
An Inconsistent International Operation
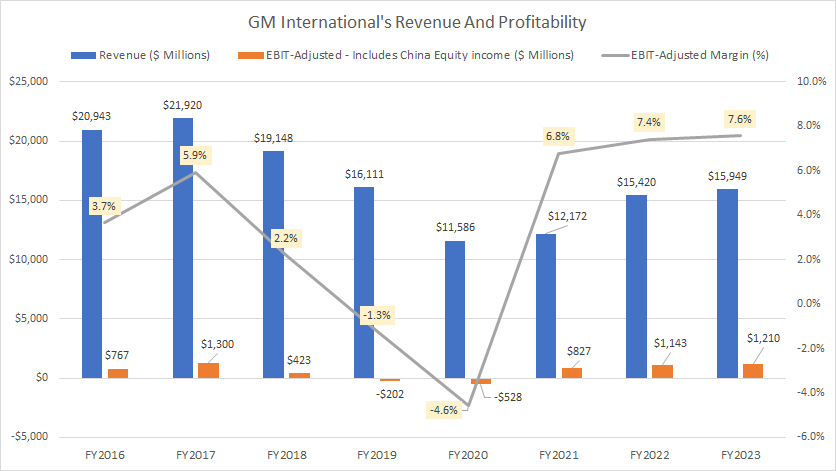
GM International Revenue And Profitability
The definitions of GM’s adjusted EBIT and equity income are available here: adjusted EBIT and equity income.
GM International (GMI) is less profitable than its North American counterpart, GM North America, mainly because GMI generates lower margins.
GMI’s profit is also inconsistent, and it can even have negative margins during crises. This makes GMI’s operation less durable than GM North America’s, and it may incur losses from time to time.
These losses may eventually affect the automotive segment and could impact the cash dividends.
Cash-Burning Cruise
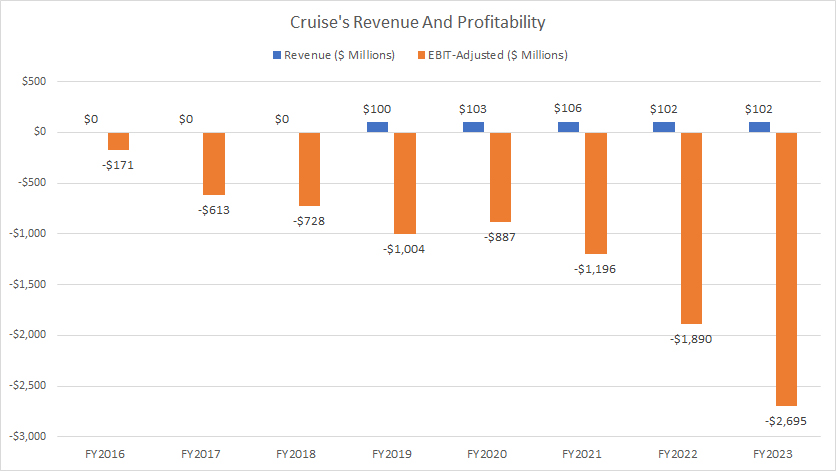
Cruise Revenue And Profitability
* Adjusted EBIT is a measurement done by GM to exclude non-recurring and non-core items such as special or one-time income or expenses to reflect the true nature of its core operation.
The definitions of GM’s adjusted EBIT are available here: adjusted EBIT.
Cruise is a subsidiary of GM that develops and markets autonomous vehicle technology in the U.S. and globally. However, Cruise has been operating at a loss, similar to GM International, as shown in the chart above.
Unfortunately, Cruise has never been profitable, with only $100 million in sales during fiscal 2023. Moreover, Cruise’s losses are increasing. In 2023, Cruise recorded the largest EBIT-adjusted loss ever reported, amounting to $2.7 billion.
These losses can potentially drain GM’s resources and affect its cash dividends.
Worsening Sales And Market Share In China
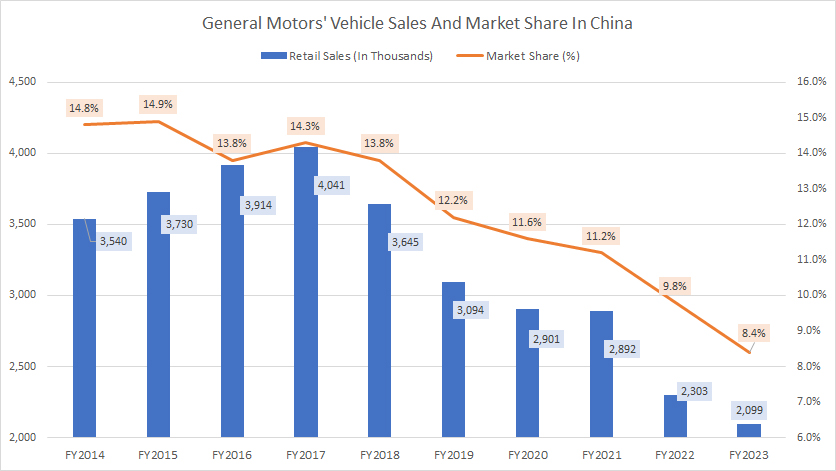
GM China Vehicle Sales And Market Share
The definitions of GM’s equity income are available here: equity income. Investors interested in the financial performance of GM China may find more information on this page: GM China revenue, sales, market share, and profit margin.
China is a crucial market for General Motors as it’s the largest automotive market globally when it comes to sales volumes. China is also a profitable market for GM. However, the chart shows that GM’s competitive position in China has weakened, as reflected in the decreasing vehicle sales and market share numbers.
Since 2014, GM’s China market share has declined by half, plunging from 14.8% in 2014 to just 8.4% in 2023. Similarly, GM’s vehicle sales in China have declined by 35% since 2014, a massive 43% from its peak in 2017. This declining competitive position in China results in a decrease in profitability.
As shown in the table below, GM’s Automotive China equity income has dropped by more than 50% since 2014, reaching as low as $466 million in 2023. GM’s Automotive China JV’s equity income is an important source of profit as it helps offset the losses incurred in its International operation. GM International’s losses would be more significant without this equity income from China.
GM’s Automotive China Equity Income As At The End Of The Financial Year
| As at 31 December | Equity Income From China |
|---|---|
| (US$ Millions) | |
| 2014 | $2,066 |
| 2015 | $2,057 |
| 2016 | $1,973 |
| 2017 | $1,976 |
| 2018 | $1,981 |
| 2019 | $1,132 |
| 2020 | $512 |
| 2021 | $1,098 |
| 2022 | $677 |
| 2023 | $446 |
If GM fails to capture the Chinese market, it may have to exit China, as it may no longer be profitable. GM’s exit from China could have severe implications for its development, including downsizing its capital return to investors in the long run. Therefore, dividend investors should monitor GM’s Automotive China results from time to time.
Conclusion
Is General Motors’ dividend safe? Some factors suggest that it is safe, such as growing vehicle sale prices, a durable North American operation, a profitable GM Financial, consistent profit and cash flow, increasing retained earnings, and a low debt level and leverage.
However, some factors suggest GM’s dividends may not be safe, such as an unreliable dividend history, decreasing vehicle sales, an inconsistent international operation, a cash-burning Cruise, and worsening sales and market share in China.
What do you think?
Please leave your comments below.
References and Credits
1. All financial figures presented in this article were obtained and referenced from GM’s annual and quarterly reports, SEC filings, investor presentations, press releases, earning releases, etc., which are available in GM Shareholder Information.
2. Featured images in this article are used under Creative Commons licenses and sourced from the following websites: GMC.
Disclosure
References and examples such as tables, charts, and diagrams are constantly reviewed to avoid errors, but we cannot warrant the total correctness of all content.
The content in this article is for informational purposes only and is neither a recommendation nor a piece of financial advice to purchase a stock.
If you find the information in this article helpful, please consider sharing it on social media and provide a link to it from any website to create more articles like this.
Thank you!

