
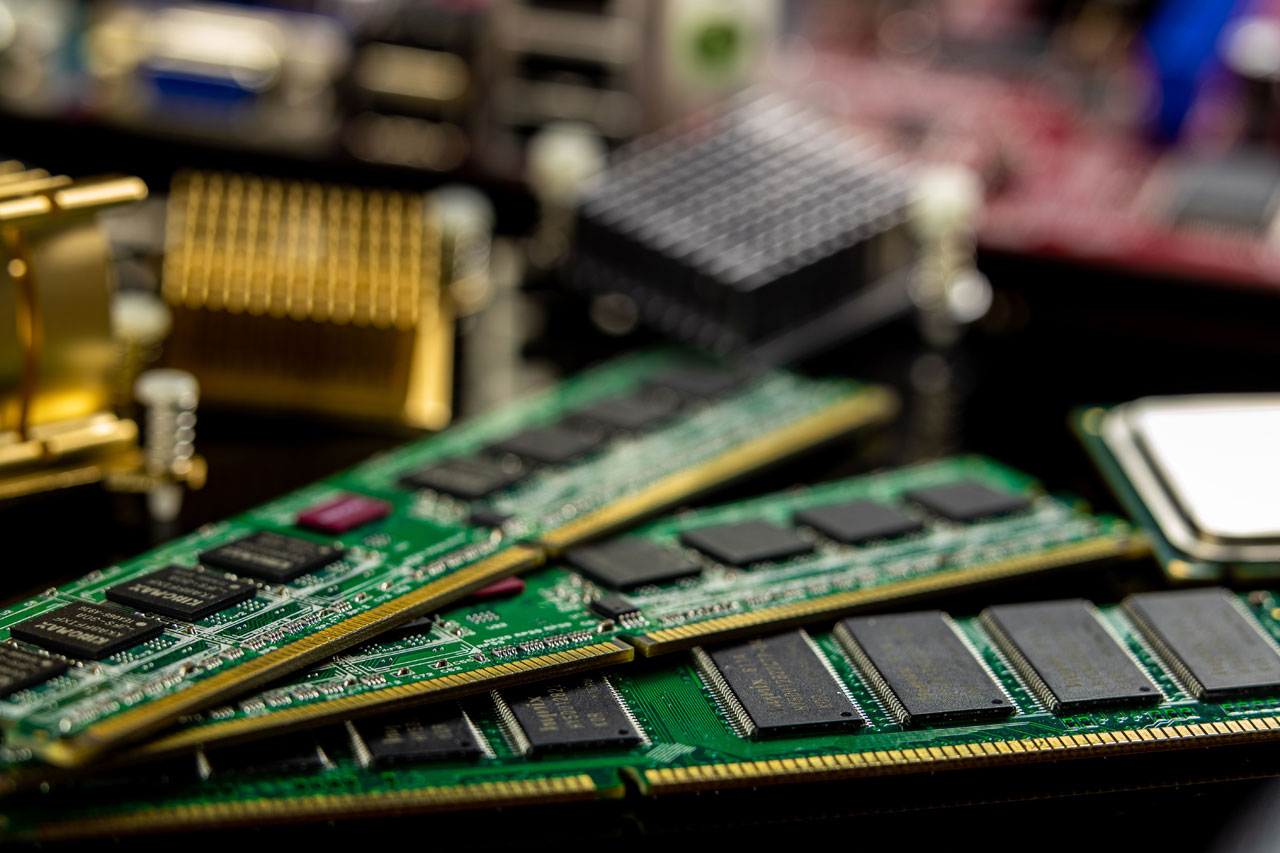
Menory modules. Pexels Image.
This page presents Micron Technology’s revenue by memory technology. Micron’s memory technology consists of the following types:
- DRAM
- NAND, and
- Others (primarily 3D XPoint memory and NOR).
Let’s look at the results.
For other key statistics of Micron Technology, you may find more resources on this page: Micron key stats.
Please use the table of contents to navigate this page.
Table Of Contents
Definitions And Overview
Insight & Summary of Observed Trends
Z1. Insight & Summary of Micron’s Revenue Breakdown By Memory Technology
Revenue Results
A1. Revenue breakdown by memory type
A2. Revenue mix by memory type
A3. Revenue growth by memory type
Reference, Credits, and Disclosure
S1. References and Credits
S2. Disclosure
Definitions of memory technology
To help readers understand the content better, the following terms and glossaries have been provided.
DRAM:
DRAM products are dynamic random access memory semiconductor devices with low latency that provide high-speed data retrieval with a variety of performance characteristics. DRAM products lose content when power is turned off (“volatile”) and are most commonly used in the data center, client PC, graphics, industrial, mobile, and automotive markets.
NAND:
NAND products are non-volatile, re-writeable semiconductor storage devices that provide high-capacity, low-cost storage with a variety of performance characteristics. NAND is used in SSDs for the data center, client PC, consumer, and automotive markets, and in removable storage markets. Managed NAND is used in smartphones and other mobile devices, and in the consumer, automotive, and embedded markets. Low-density NAND is ideal for applications like automotive, surveillance, machine-to-machine, automation, printer, and home networking.
NOR:
NOR products are non-volatile, re-writable semiconductor memory devices that provide fast read speeds. NOR is most commonly used for reliable code storage (e.g., boot, application, operating system, and execute-in-place code in an embedded system) and for frequently changing small data storage and is ideal for automotive, industrial, and consumer applications.
3D XPoint:
3D XPoint is a class of non-volatile technology between DRAM and NAND in the memory and storage hierarchy. In 2021, Micron ceased development of 3D XPoint technology.
Insight & Summary of Micron’s Revenue Breakdown By Memory Technology
Micron's revenue across fiscal 2013–2026 is dominated by DRAM and NAND and follows a pronounced boom-and-bust rhythm, culminating in a step change in the latest year that has no precedent in the series.
DRAM Dominance and Higher Cyclicality: DRAM has anchored the revenue base, contributing between 67.7% and 76.5% of revenue in every year since 2018, up from a 58.0%–68.0% range in 2014–2017. It is also the swing factor. In each of the five years in which total revenue contracted (2015, 2016, 2019, 2020 and 2023), DRAM fell by more than the total and its share declined, with the deepest reset in 2023 (-51.0% for DRAM against -49.5% for the total). Over the full period DRAM revenue grew more than 23 times, against nearly nine times for NAND.
NAND as a Partial Stabilizer: NAND's share fell from 40.0% in 2013 to a low of 21.4% in 2018 and has since held in a narrower 22.7%–28.8% band. It has occasionally offset DRAM weakness, growing 21.0% in 2015 and 14.5% in 2020 while DRAM contracted, which cushioned the total decline to -1.0% and -8.4%. The offset did not hold in the deeper downturns of 2016, 2019 and 2023, when both technologies contracted together.
Other Technologies: Structural Decline With a Late Rebound: Revenue from Other fell from $1,089M in 2013 to a low of $281M in 2024, and its share from 12.0% to 1.1%, with contractions in eight of the thirteen growth years. Growth returned in 2025 (5.7%) and 2026 (143.8%, to $724M), but at a 0.5% share, the lowest in the series, the segment remains immaterial to consolidated results and the rebound reflects a small base rather than a shift in mix.
Cycle Amplitude and the 2026 Step Change: Total revenue has moved in sharp cycles, with the 2023 contraction the deepest and the 2024 and 2025 recoveries (61.6% and 48.9%) lifting revenue above its 2022 peak by 2025. Fiscal 2026 growth of 256.3% is more than three times the strongest earlier year in the series (80.3% in 2014) and puts revenue at 4.3 times the 2022 peak. The expansion was broad: DRAM (252.3%) and NAND (273.8%) rose almost in tandem, and the mix barely moved, with DRAM easing from 76.5% to 75.6%.
Structural Takeaway & Trend: Structurally, Micron's revenue is a two-technology business in which DRAM supplies roughly three-quarters of sales and sets the amplitude of the cycle, while NAND provides secondary and only partly offsetting exposure and Other has become immaterial. The changing trend is the length and force of the current upcycle. Earlier recoveries lost momentum within two years and then reversed, as growth of 63.9% in 2017 slowed to 49.5% in 2018 and 29.3% in 2021 slowed to 11.0% in 2022. The present one also slowed in 2025 (61.6% to 48.9%) but then accelerated to 256.3% in 2026, extending the run to three consecutive years of growth.
The dataset cannot show whether the 2026 acceleration reflects durable demand or peak-cycle conditions. The foreseeable pattern is high-amplitude volatility around a much higher base. Because fiscal 2026 revenue is 3.6 times the 2025 level, even partial normalization would register as a contraction, and each earlier revenue peak (2014, 2018 and 2022) was followed by a decline the following year. Continued expansion remains possible, since this cycle has already outrun its predecessors, but the range of plausible outcomes for fiscal 2027 is wider than at any earlier point in the series.
The table below combines all key Micron’s revenue breakdown by memory type metrics into a single view for the latest three fiscal years.
Micron's Revenue by Technology Analysis — 3-Year Average (FY2024–FY2026)
| Metric | 3-Year Average (FY2024–FY2026) |
|---|---|
| Revenue Breakdown by Technology | |
| DRAM | $48,953M |
| NAND | $15,838M |
| Other (primarily 3D XPoint memory and NOR) | $434M |
| Total Revenue | $65,226M |
| Revenue Mix by Technology | |
| DRAM | 74.1% |
| NAND | 25.1% |
| Other (primarily 3D XPoint memory and NOR) | 0.8% |
| Total Revenue | 100.0% |
| Revenue Growth by Technology | |
| DRAM | 125.0% |
| NAND | 121.1% |
| Other (primarily 3D XPoint memory and NOR) | 42.8% |
| Total Revenue | 122.3% |
Revenue averages rounded to the nearest million US dollars; mix and growth averages are the simple average of the annual percentages, rounded to one decimal place.
Revenue breakdown by memory type
View data as table
Micron Revenue by Technology Breakdown — All Metrics by Fiscal Year
| Fiscal Year | DRAM | NAND | Other (primarily 3D XPoint memory and NOR) | Total Revenue |
|---|---|---|---|---|
| 2013 | $4,355M | $3,629M | $1,089M | $9,073M |
| 2014 | $11,123M | $4,417M | $818M | $16,358M |
| 2015 | $10,363M | $5,343M | $486M | $16,192M |
| 2016 | $7,191M | $4,588M | $620M | $12,399M |
| 2017 | $12,963M | $6,585M | $774M | $20,322M |
| 2018 | $22,625M | $6,510M | $1,256M | $30,391M |
| 2019 | $16,841M | $5,355M | $1,210M | $23,406M |
| 2020 | $14,510M | $6,131M | $794M | $21,435M |
| 2021 | $20,039M | $7,007M | $659M | $27,705M |
| 2022 | $22,386M | $7,811M | $561M | $30,758M |
| 2023 | $10,978M | $4,206M | $356M | $15,540M |
| 2024 | $17,603M | $7,227M | $281M | $25,111M |
| 2025 | $28,578M | $8,503M | $297M | $37,378M |
| 2026 | $100,679M | $31,785M | $724M | $133,188M |
Micron’s memomry technology is explained here: memory type.
Micron's Revenue Breakdown by Technology — Averages (FY2024–FY2026)
| Metric | 3-Year Average (FY2024–FY2026) |
|---|---|
| DRAM | $48,953M |
| NAND | $15,838M |
| Other (primarily 3D XPoint memory and NOR) | $434M |
| Total Revenue | $65,226M |
Revenue averages rounded to the nearest million US dollars.
Revenue mix by memory type
View data as table
Micron Revenue Mix by Technology — All Metrics by Fiscal Year
| Fiscal Year | DRAM | NAND | Other (primarily 3D XPoint memory and NOR) |
|---|---|---|---|
| 2013 | 48.0% | 40.0% | 12.0% |
| 2014 | 68.0% | 27.0% | 5.0% |
| 2015 | 64.0% | 33.0% | 3.0% |
| 2016 | 58.0% | 37.0% | 5.0% |
| 2017 | 63.8% | 32.4% | 3.8% |
| 2018 | 74.4% | 21.4% | 4.1% |
| 2019 | 72.0% | 22.9% | 5.2% |
| 2020 | 67.7% | 28.6% | 3.7% |
| 2021 | 72.3% | 25.3% | 2.4% |
| 2022 | 72.8% | 25.4% | 1.8% |
| 2023 | 70.6% | 27.1% | 2.3% |
| 2024 | 70.1% | 28.8% | 1.1% |
| 2025 | 76.5% | 22.7% | 0.8% |
| 2026 | 75.6% | 23.9% | 0.5% |
Micron’s memomry technology is explained here: memory type.
Micron's Revenue Mix by Technology — Averages (FY2024–FY2026)
| Metric | 3-Year Average (FY2024–FY2026) |
|---|---|
| DRAM | 74.1% |
| NAND | 25.1% |
| Other (primarily 3D XPoint memory and NOR) | 0.8% |
| Total Revenue | 100.0% |
Mix averages are the simple average of the annual mix percentages, rounded to one decimal place.
Revenue growth by memory type
View data as table
Micron Revenue Growth by Technology — All Metrics by Fiscal Year
| Fiscal Year | DRAM | NAND | Other (primarily 3D XPoint memory and NOR) | Total Revenue |
|---|---|---|---|---|
| 2014 | 155.4% | 21.7% | -24.9% | 80.3% |
| 2015 | -6.8% | 21.0% | -40.6% | -1.0% |
| 2016 | -30.6% | -14.1% | 27.6% | -23.4% |
| 2017 | 80.3% | 43.5% | 24.8% | 63.9% |
| 2018 | 74.5% | -1.1% | 62.3% | 49.5% |
| 2019 | -25.6% | -17.7% | -3.7% | -23.0% |
| 2020 | -13.8% | 14.5% | -34.4% | -8.4% |
| 2021 | 38.1% | 14.3% | -17.0% | 29.3% |
| 2022 | 11.7% | 11.5% | -14.9% | 11.0% |
| 2023 | -51.0% | -46.2% | -36.5% | -49.5% |
| 2024 | 60.3% | 71.8% | -21.1% | 61.6% |
| 2025 | 62.3% | 17.7% | 5.7% | 48.9% |
| 2026 | 252.3% | 273.8% | 143.8% | 256.3% |
Micron’s memomry technology is explained here: memory type.
Micron's Revenue Growth by Technology — Averages (FY2024–FY2026)
| Metric | 3-Year Average (FY2024–FY2026) |
|---|---|
| DRAM | 125.0% |
| NAND | 121.1% |
| Other (primarily 3D XPoint memory and NOR) | 42.8% |
| Total Revenue | 122.3% |
Growth averages are the simple average of the annual growth rates, rounded to one decimal place.
References and Credits
1. All financial figures presented were obtained and referenced from Micron’s quarterly and annual reports published on the company’s investor relations page: Micron investor relations.
2. Pexels Images.
Back To Table Of Contents
Disclosure
We may use artificial intelligence (AI) tools to assist us in writing some of the text in this article. However, the data is directly obtained from original sources (usually the quarterly and annual reports) and meticulously cross-checked by our editors multiple times to ensure its accuracy and reliability.
If you find the information in this article helpful, please consider sharing it on social media. Additionally, providing a link back to this article from any website can help us create more content like this in the future.
Thank you for your support and engagement! Your involvement helps us continue to provide high-quality, reliable content.