Grocery. Pexels Images.
This article presents Costco’s e-commerce revenue and the respective comparable sales. In addition, we also look at Costco’s e-commerce sales as a percentage of the total merchandise revenue and the YoY revenue growth.
Let’s look at the numbers!
Investors interested in Costco’s other key statistics may find more resources on these pages:
- Costco financial health: total debt, payment due, and liquidity,
- Costco profit margin by segment: U.S., Canada, and International, and
- Costco number of gas stations worldwide and gasoline sales.
Please use the table of contents to navigate this page.
Table Of Contents
Definitions And Overview
E-Commerce Sales
A1. E-Commerce Sales In Percentage
A2. E-Commerce Sales Revenue
E-Commerce Growth
B1. E-Commerce Comparable Sales
B2. E-Commerce Revenue YoY Growth Rates
Summary And Reference
S1. Summary
S2. References and Credits
S3. Disclosure
Definitions
To help readers understand the content better, the following terms and glossaries have been provided.
E-commerce Sales: Costco’s e-commerce business falls under the Other Business segment, similar to business centers, travels, and other.
Costco operates e-commerce sites only in selected countries, including the U.S., Canada, the U.K., Mexico, Korea, Taiwan, Japan, and Australia.
According to Costco, its e-commerce sales do not include other services that the company offers online such as business delivery, travel, same-day grocery, and various other services.
Costco’s e-commerce business, domestically and internationally, has a lower gross-margin percentage than warehouse operations, as stated in the annual reports.
Comparable Sales: Costco defines its comparable sales as net sales (merchandise sales) from warehouses open for more than one year, including remodels, relocations and expansions, and sales related to e-commerce sites operating for more than one year.
In general, comparable sales, often referred to as “same-store sales,” measure the performance of a retailer by examining sales from stores that have been open for a certain period (usually over a year) and excluding any newly opened, closed, or acquired locations. This metric provides a clear picture of organic growth and helps investors and analysts assess a company’s operational efficiency and customer demand within existing stores.
It ensures that growth results from increased sales activity rather than external factors like new store openings or acquisitions. Comparable sales are a critical metric for retail companies like Costco, as they reflect how well the company retains and attracts customers, drives repeat business, and responds to market trends.
E-Commerce Sales In Percentage
Costco-ecommerce-sales-in-percentage
(click image to expand)
You may find more information about Costco’s online business here: e-commerce business.
Costco’s e-commerce business has experienced remarkable growth over the years, becoming an increasingly significant part of the company’s overall sales.
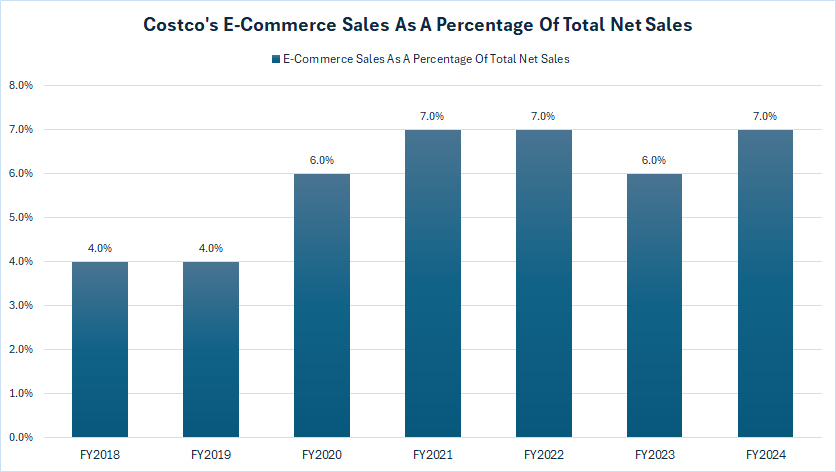
In fiscal year 2024, Costco’s e-commerce platforms contributed approximately 7% to the company’s total merchandise sales. This marks a slight yet meaningful increase from the 6% contribution reported in fiscal year 2023, reflecting a steady upward trend in online revenue.
Over the past five fiscal years, from 2020 to 2024, e-commerce sales have accounted for an average of 6.6% of total merchandise revenue, showcasing Costco’s consistent efforts to enhance its online presence and meet evolving customer expectations.
Looking back further, in fiscal years 2018 and 2019, e-commerce sales made up just 4% of total merchandise revenue. The significant leap to 7% in the latest fiscal year illustrates Costco’s progress in expanding its digital capabilities and embracing online sales as a vital component of its business.
In summary, Costco’s e-commerce operations have grown substantially, increasingly contributing to the company’s overall revenue and highlighting its successful adaptation to a more digital-focused retail environment.
E-Commerce Sales Revenue
Costco-ecommerce-sales-revenue
(click image to expand)
You may find more information about Costco’s online business here: e-commerce business.
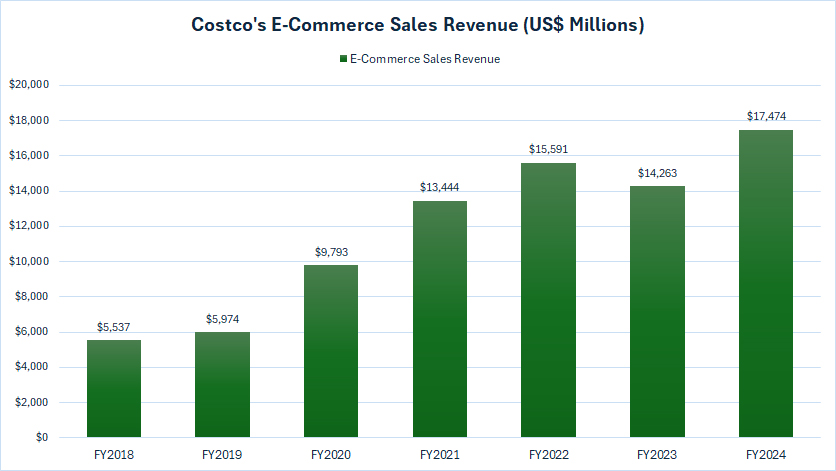
From a revenue perspective, Costco’s e-commerce segment achieved impressive growth, earning $17.5 billion in fiscal year 2024. This marks a $3 billion increase compared to the $14.3 billion reported in fiscal year 2023.
In fiscal year 2022, Costco’s e-commerce revenue reached $15.6 billion, reflecting a significant rise from $13.4 billion in fiscal year 2021.
Over the last three years, spanning from fiscal year 2022 to 2024, Costco’s e-commerce revenue has averaged $15.8 billion annually.
Remarkably, between fiscal year 2019 and 2024, the company’s online revenue has nearly tripled, climbing from $6 billion to an impressive $17.5 billion in the latest fiscal year.
E-Commerce Comparable Sales
Costco-ecommerce-comparable-sales
(click image to expand)
You may find more information about Costco’s online business here: e-commerce business. The definition of Costco’s comparable sales is available here: comparable sales.
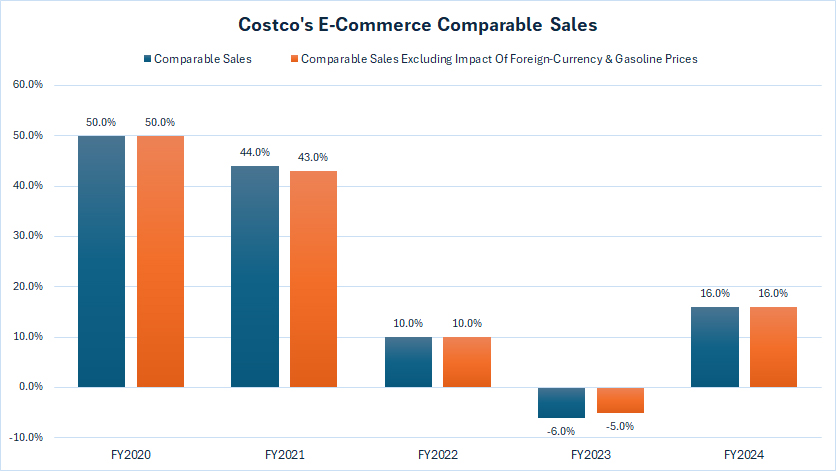
Costco’s comparable sales, excluding the impacts of foreign currency exchange and gasoline prices, showed only minor differences from the comparable sales figures without such adjustments. This stability demonstrates the resilience of Costco’s core business across various market conditions.
Costco’s e-commerce comparable sales in fiscal year 2024 stood out, achieving an impressive 16%. This marked a significant rebound from the -6% comparable sales reported in fiscal year 2023, reflecting a return to strong online performance.
In contrast, fiscal year 2023 saw a decline in e-commerce comparable sales, dropping to -6% from the 10% recorded in fiscal year 2022, underscoring a challenging period for the segment.
Historically, Costco’s e-commerce segment has delivered exceptional results. During the fiscal years 2020 and 2021, comparable sales for its online business averaged over 40% annually, demonstrating extraordinary growth driven by increased demand for online shopping, particularly during the pandemic.
However, recent periods have seen a noticeable slowdown in e-commerce comparable sales growth, as reflected in the more moderate figures from fiscal years 2023 and 2024.
This trend suggests a deceleration in the expansion of Costco’s online platform, possibly influenced by market saturation, shifting consumer behavior post-pandemic, or heightened competition in the e-commerce space.
While Costco’s e-commerce business continues to contribute positively to overall sales, these results highlight the evolving nature of online retail and the need for ongoing innovation to sustain growth in a competitive digital landscape.
E-Commerce Revenue YoY Growth Rates
Costco-ecommerce-yoy-revenue-growth
(click image to expand)
You may find more information about Costco’s online business here: e-commerce business. The definition of Costco’s comparable sales is available here: comparable sales.
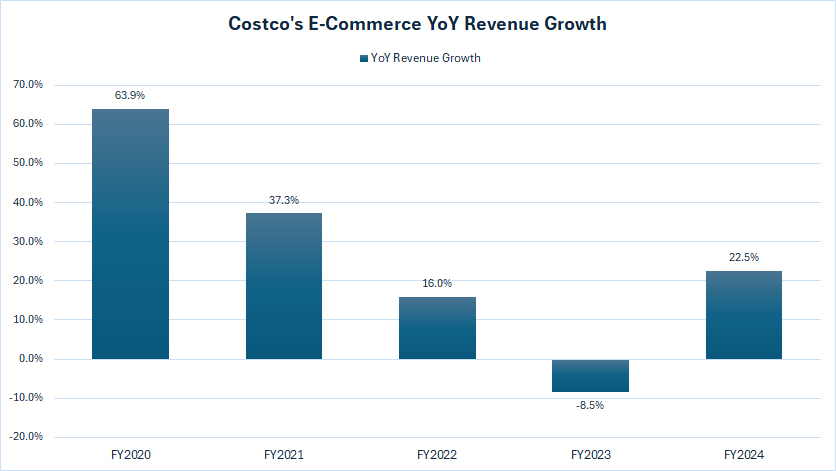
Costco’s e-commerce revenue year-over-year (YoY) growth closely aligns with the trends in its comparable sales. Typically, when comparable sales increase, the YoY revenue growth rises as well, and vice versa.
In fiscal year 2024, Costco’s e-commerce YoY revenue growth reached an impressive 22.5%, a notable recovery from the -8.5% decline seen in fiscal year 2023. This rebound highlights Costco’s ability to adapt and regain momentum in its online segment.
Over the past three fiscal years, from 2022 to 2024, e-commerce revenue growth has averaged 10% annually. During the earlier pandemic-driven period, Costco experienced significantly higher growth rates in its e-commerce business. For instance, in fiscal year 2020, the YoY revenue growth was a staggering 64%, and in fiscal year 2021, it remained robust at 37%.
Post-pandemic, e-commerce revenue growth has slowed considerably, reflecting changes in consumer behavior and a more competitive digital retail environment.
However, fiscal year 2024 marks a positive turnaround, with substantial improvement in Costco’s online sales growth, reinforcing the strength and resilience of its e-commerce strategy.
Conclusion
While Costco’s e-commerce growth has slowed compared to its peak pandemic levels, the company is proving its resilience and ability to rebound in an evolving retail landscape.
Its consistent investment in digital strategies, combined with strong customer loyalty and a focus on value, positions Costco to continue leveraging e-commerce as a vital driver of its overall growth.
This indicates a balanced approach to navigating shifts in consumer behavior while capitalizing on the opportunities within the digital retail space.
References and Credits
1. All financial figures presented were obtained and referenced from Costco’s annual reports published on the company’s investor relations page: Costco Investor Relations.
2. Pexels Images.
Disclosure
We may use artificial intelligence (AI) tools to assist us in writing some of the text in this article. However, the data is directly obtained from original sources and meticulously cross-checked by our editors multiple times to ensure its accuracy and reliability.
If you find the information in this article helpful, please consider sharing it on social media. Additionally, providing a link back to this article from any website can help us create more content like this in the future.
Thank you for your support and engagement! Your involvement helps us continue to provide high-quality, reliable content.


