
Elon Musk, Tesla Factory, Fremont (CA, USA). Flickr Image.
This article presents the total debt and debt breakdown of Tesla (NASDAQ: TSLA).
Apart from the debt figures, we also look at the company’s cash, debt due, sources of liquidity and credit rating.
We will assess Tesla’s ability to cover its debt payments by comparing its total liquidity with the debt due.
By doing this, we can determine if Tesla’s rising debt levels are a concern or problem for the company.
Investors interested in Tesla’s debt leverage may find more information on this page: Tesla debt to equity ratio.
Let’s take a look!
Please use the table of contents to navigate this page.
Table Of Contents
Overview
A1. Debt Definition
Debt And Cash
B1. Total Debt
B2. Total Cash
Net Debt
B3. Total Debt Less Total Cash
Debt Breakdown
Leases
C1. Finance And Operating Lease Liabilities
C2. Impact Of Leases On Debt
Debt Ratios
D1. Debt Vs Assets Growth
D2. Debt To Assets Ratio
D3. Debt Vs Revenue Growth
D4. Debt To Revenue Ratio
Debt Schedules, Liquidity And Credit Rating
E1. Debt Payment Due
E2. Sources Of Liquidity
E3. Credit Rating
Summary And Reference
S1. Conclusion
S2. References and Credits
S3. Disclosure
Debt Definition
In Tesla’s quarterly and annual filings, Tesla disclosed all debt obligations, both current and long-term, in a table as shown below.
Tesla debt summary. Source: 2022 anual report
(click image to expand)
There are multiple columns specified in the above table, such as “Net Carrying Value”, “Unpaid Principal Balance”, “Unused Committed Amount”, “Contractual Interest Rates”, and “Contractual Maturity Date”.
The “Unpaid Principal Balance” will be the main subject of our discussion in this article. This column specifies the total payment due, including the amount of debt and the expected interest expenses.
The contractual interest rates refer to the interest rates of the issued debt, whereas the maturity date or debt due date refers to the date when the debt comes due.
Also, the “Unpaid Principal Balance” includes the debt’s current and long-term portions.
Keep in mind that the unpaid principal amount can fluctuate from quarter to quarter, depending on whether Tesla has paid down the debt or drawn on more debt.
Let’s look at the numbers.
Total Debt
Tesla total debt
(click image to expand)
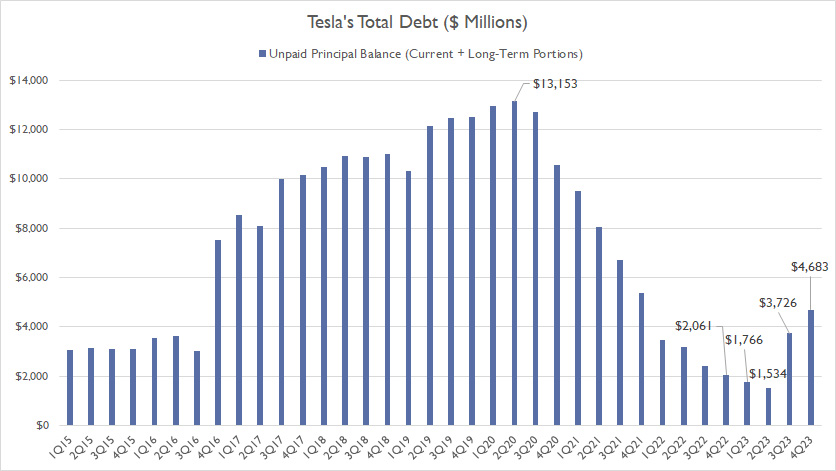
As of 4Q 2023, Tesla’s total debt reached $4.7 billion. Of this amount, $2.4 billion is the current portion of debt and finance leases that will come due in the next 12 months.
One notable trend is that Tesla’s overall debt has significantly decreased after peaking at over $13 billion in the fiscal year 2Q 2020.
However, Tesla’s debt has started to rise over the last two quarters. In fact, Tesla’s debt has surged by 200% since 2Q 2023, going up from $1.5 billion to $4.7 billion in the latest quarter.
Therefore, does Tesla’s $5 billion debt threaten the company’s financial health? Let’s read on!
Total Cash
tesla-cash-on-hand-and-investments
(click image to expand)
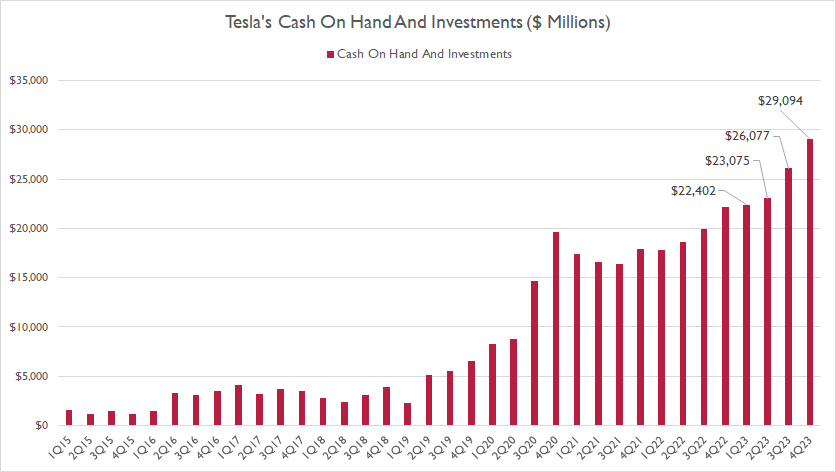
Tesla carries a significant amount of cash, as shown in the chart above.
Tesla had a total cash of $29 billion as of 4Q 2023. This cash primarily includes cash on hand and short-term investments.
Over the years, Tesla’s cash generation capability has been impressive, leading to a significant increase in this figure.
As a result, Tesla now has considerably more cash than debt.
Net Debt
Tesla net debt
(click image to expand)
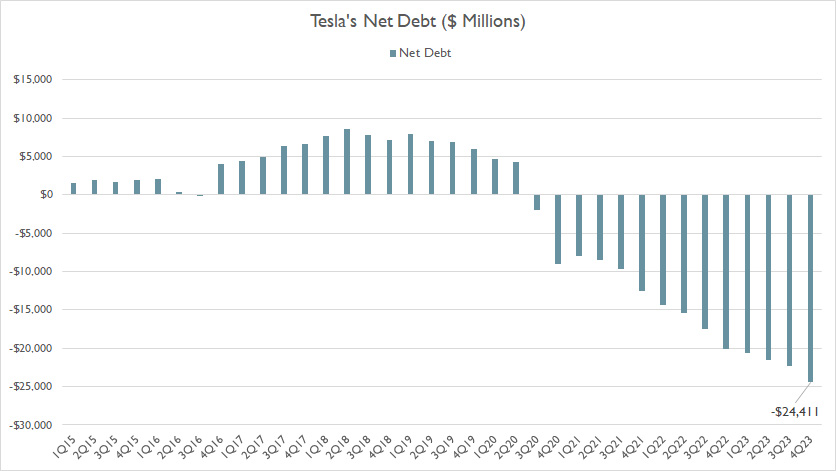
As of 4Q 2023, Tesla’s net debt was -$24.4 billion due to having more cash than debt.
This figure was much larger than the one reported a year ago, indicating the company’s increasing amount of cash compared to debt. In fact, Tesla has been debt-free since 3Q 2020, as shown in the chart above.
Tesla’s $5 billion debt, which we saw earlier, appears not to be a concern or an issue for the company’s financial health since it has sufficient cash to pay down the debt.
Tesla vs SolarCity
Tesla Automotive vs SolarCity debt
(click image to expand)
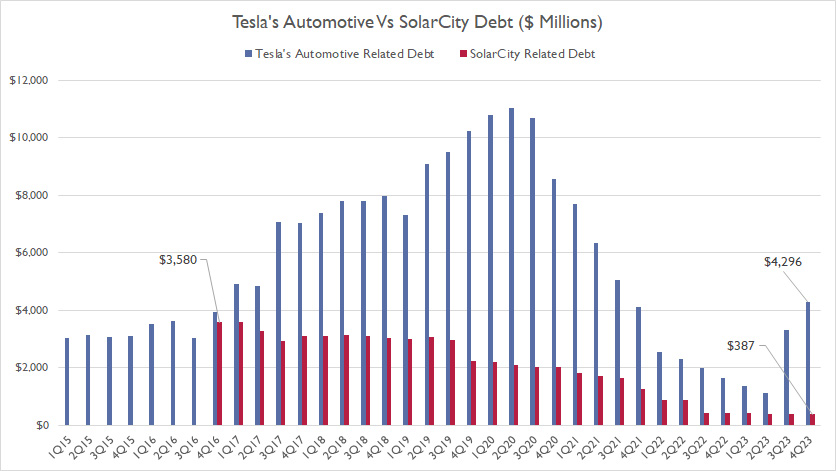
In 2016, Tesla acquired SolarCity for US$2.6 billion and assumed their debt. However, the majority of Tesla’s debt came from the automotive sector.
Since 2016, Tesla’s debt associated with SolarCity has significantly decreased, from nearly $3.6 billion to just $387 million as of 4Q 2023. On the other hand, Tesla’s automotive debt has risen to $4.3 billion in the latest quarter.
In short, Tesla’s debt associated with SolarCity, which amounted to $387 million in the latest quarter, was much lower than the automotive portion.
Finance And Operating Lease Liabilities
Tesla minimum lease payments 4Q 2021
(click image to expand)
Apart from short and long-term debt, Tesla also carries finance and operating leases, as shown in the diagram above.
Tesla’s debt is expected to increase significantly as it has a considerable amount of operating and finance lease obligations.
To show that, I created the following chart to show Tesla’s debt levels and the effect of leases on debt.
Impact Of Leases On Debt
Tesla debt and leases
(click image to expand)
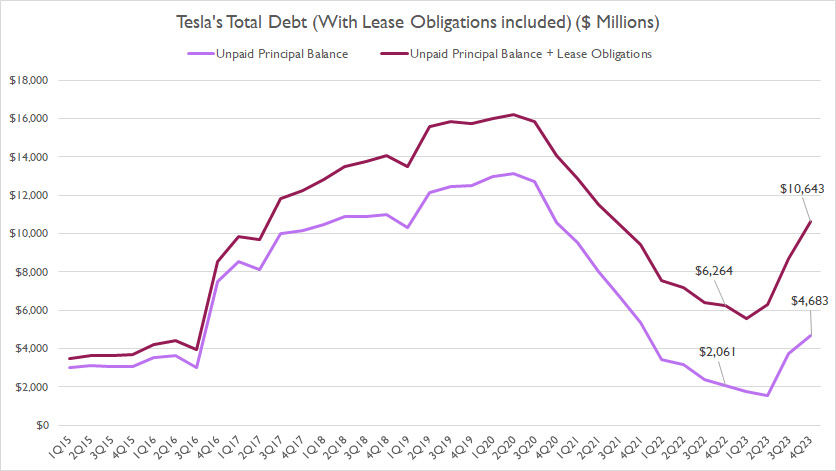
The plots above illustrate the impact of leases on Tesla’s debt levels.
The data reveals that the inclusion of leases, including both operating and finance parts, has notably increased Tesla’s debt numbers.
As of 4Q 2023, Tesla’s total debt, including operating and finance leases, grew from $4.7 billion to $10.6 billion, roughly twice the amount of debt when leases are accounted for.
In short, Tesla’s debt level has increased from $4.7 billion to $10.6 billion because of the substantial amount of leases.
Will the $11 billion debt level cause a problem or an issue for Tesla? Let’s read on.
Debt Vs Assets Growth
Tesla debt vs assets
(click image to expand)
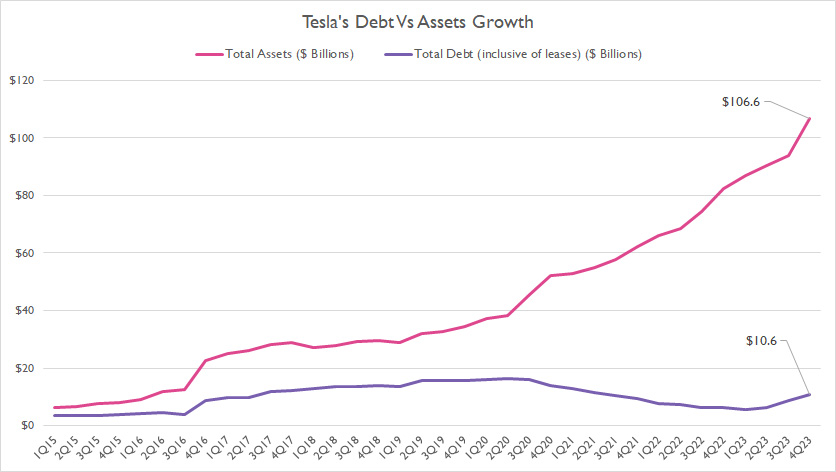
Compared to its assets, Tesla’s debt levels are lower and have not grown as much. On the other hand, Tesla’s assets have grown at much faster growth rates than its debt.
As of 4Q 2023, the gap between Tesla’s assets and debt levels was close to $100 billion, a record level that has never been seen since 2015.
The increasing gap shows that the growth of Tesla’s assets does not primarily come from debt. This trend is significant as it shows that Tesla is a well-managed company.
Debt To Assets Ratio
tesla-debt-to-assets-ratio
(click image to expand)
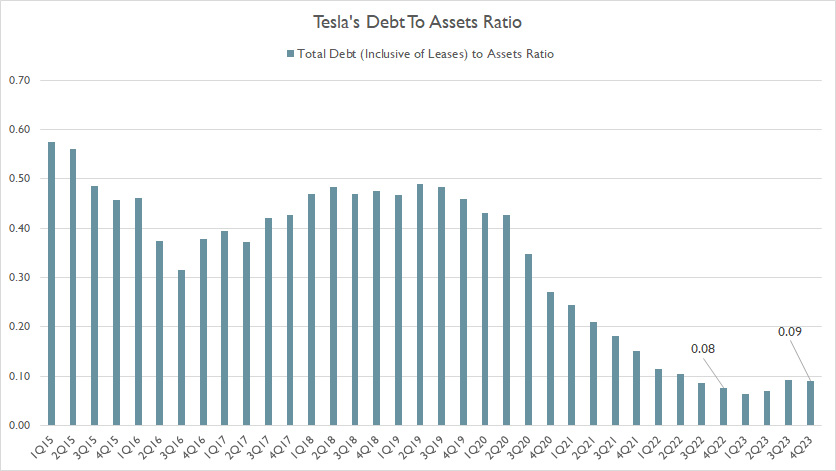
The plot above shows that Tesla’s debt-to-assets ratio has significantly decreased, even in post-pandemic periods, illustrating the widening gap between assets and debt.
As of 4Q 2023, the ratio was at one of the record lows despite Tesla’s growing debt levels in the latest quarter.
Again, the continuous decrease in Tesla’s debt-to-asset ratio shows that debt has not been used to grow the asset base, a sign of a well-managed company.
Debt Vs Revenue Growth
Tesla debt vs revenue
(click image to expand)
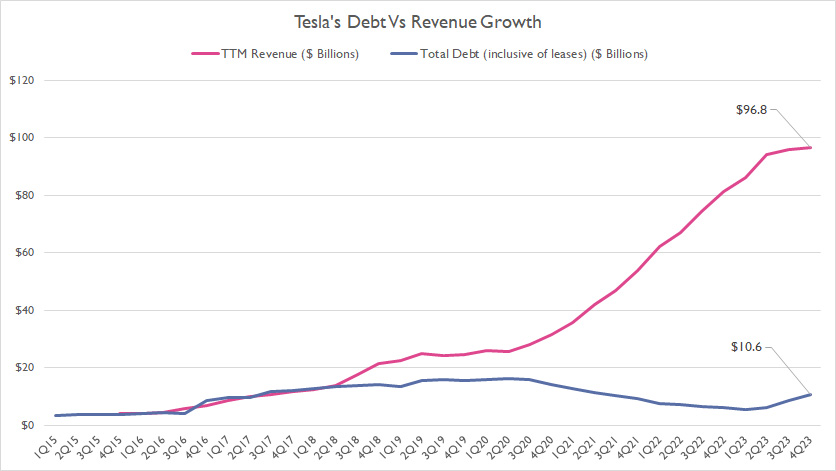
The plot above shows that Tesla’s total revenue has grown much faster than its debt, another sign of a well-run company.
In fact, Tesla’s debt levels appear to remain relatively flat compared to revenue, as shown in the plot above.
In other words, Tesla has relied less on debt to fuel its revenue growth.
Debt To Revenue Ratio
Tesla debt to revenue ratio
(click image to expand)
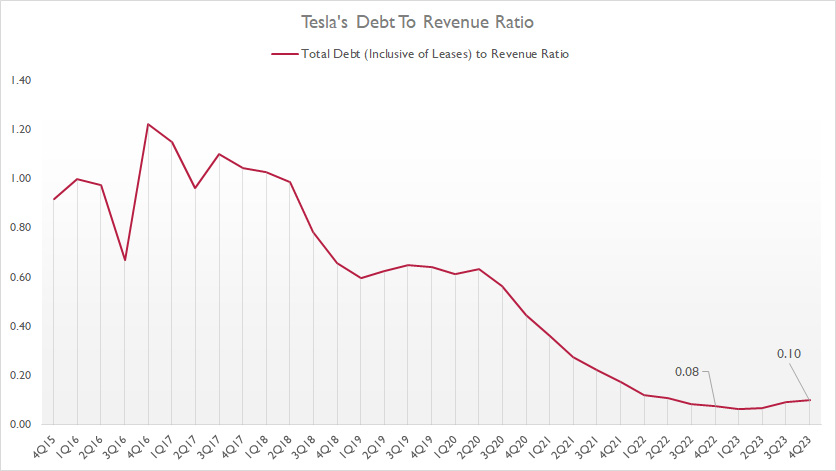
The decreasing debt-to-revenue ratio presented in the plot above shows that Tesla’s revenue has grown much faster than its debt.
As seen from the chart, the ratio has significantly come down over the years and reached only 0.10X as of 4Q 2023, one of the record lows since 2015.
The declining ratio illustrates Tesla’s surging revenue with respect to the debt levels.
Debt Payment Due
Tesla’s total amount due is based on the results reported in the 2023 annual report.
| Types of Debt | Amount Due In Billions | ||
|---|---|---|---|
| FY2024 | FY2025 | Thereafter | |
| Debt | $2.0 | $1.7 | $1.0 |
| Operating Leases | $0.9 | $0.8 | $3.6 |
| Finance Leases | $0.4 | $0.1 | $0.1 |
| Total Due | $3.3 | $2.6 | $4.7 |
For fiscal 2024 alone, Tesla’s total payment due is $3.3 billion, which consists primarily of debt due.
For fiscal 2025, Tesla’s total payment due is $2.6 billion, which also consists primarily of debt due. However, the lease payment due makes up nearly half of the total amount due.
The following quote is obtained from Tesla’s 2023 annual report regarding what comes due in the next 12 months:
-
“As of December 31, 2023, we and our subsidiaries had outstanding $4.68 billion in aggregate principal amount of indebtedness, of which $1.98 billion is scheduled to become due in the succeeding 12 months.
As of December 31, 2023, our total minimum lease payments was $5.96 billion, of which $1.31 billion is due in the succeeding 12 months.”
Does Tesla have sufficient cash to cover the payment due in 2024, 2025, and thereafter? We will find out in the next section.
Sources Of Liquidity
Tesla’s total liquidity is based on the result reported in the 2023 annual report.
| Sources Of Liquidity | USD In Billions | |
|---|---|---|
| Committed Capacity | Available Capacity For FY2024 | |
| Cash & Cash Equivalents | – | $16.4 |
| Short-Term Investments | – | $12.7 |
| Credit Facilities | $5.0 | $5.0 |
| Operating Cash Flow | – | $13.2 (estimated) |
| Total | – | $47.3 |
Tesla’s sources of liquidity include cash and cash equivalents, short-term investments, and credit facilities from banks.
Besides cash, investments, and credit facilities, Tesla obtains its cash through operating activities.
Therefore, Tesla is estimated to have a total liquidity of $47 billion as of the end of fiscal 2023. This amount is available for use in fiscal 2024 and onward. Therefore, it appears that Tesla has enough liquidity to cover its total payment due in 2024, 2025 and even the amount thereafter.
As seen in prior discussions, Tesla’s payment due, Tesla needs to pay $3.3 billion in 2024, $2.6 billion in 2025, and $4.7 billion thereafter. Tesla’s $47 billion in cash looks more than enough to cover all amounts due, which comes to about $10.6 billion.
However, even without the cash flow from operating activities, Tesla is still able to pay off its entire debt due with just the cash balance, which totaled as much as $16 billion as of 4Q 2023.
The following quote shows what Tesla said about its liquidity in the 2023 annual report:
- “Accordingly, we believe that our current sources of funds will provide us with adequate liquidity during the 12-month period following December 31, 2023, as well as in the long term.”
In short, Tesla appears to be able to adequately meet its payment obligations all the way to fiscal 2025 and beyond. As a result, Tesla does not seem to have a debt issue or problem.
Credit Rating
Tesla’s credit ratings as of 31 Dec 2023.
| Rating Institutions | Types Of Indebtedness | Outlook | |
|---|---|---|---|
| Long-Term Debt | Short-Term Debt | ||
| Standard & Poor’s | N.A. | N.A. | N.A. |
| Moody’s | N.A. | N.A. | N.A. |
| Fitch | N.A. | N.A. | N.A. |
As of 31 Dec 2023, Tesla did not publish any credit rating regarding its debt obligation in the 2023 annual reports.
Summary
To recap, Tesla’s debt has declined considerably and reached record lows in recent years.
Tesla has ample liquidity to meet its debt and lease obligations.
Is Tesla’s $11 billion debt a cause for concern? Based on the results of the 2023 annual report, Tesla is expected to be able to meet all payments due, including debt and leases.
References and Credits
1. All financial figures presented in this article were obtained and referenced from Tesla’s SEC filings, quarterly and annual reports, earnings releases, investor presentations, press releases, etc., which are available in Tesla Investor Relations.
2. Featured images in this article are used under the Creative Commons license and sourced from the following websites: Bill Dickinson and Maurizio Pesce.
Disclosure
References and examples such as tables, charts, and diagrams are constantly reviewed to avoid errors, but we cannot warrant the total correctness of all content.
The content in this article is for informational purposes only and is neither a recommendation nor a piece of financial advice to purchase a stock.
If you find the information in this article helpful, please consider sharing it on social media and providing a link to it from any website so that more articles like this can be created.
Thank you!



One major advantage of a non-recourse agreement is that once you have
sold the accounts receivable, it is no longer your responsibility.
However, with invoice factoring you usually get access to other services.
Maintain a separate notebook which contains the list of the persons who
are to be billed and for what goods and what amount they have to be billed.