Social Media Stamped. Flickr Image.
This article compares the monthly active user (MAU) numbers of social media platforms such as Facebook, Pinterest and Weibo.
Twitter and Snap do not publish monthly active user figures. Instead, they publish the daily active user (DAU) numbers, which are available on the following page.
Weibo is a Chinese social media company that operates mainly in China, but users worldwide can use and share content on Weibo platforms.
Weibo operates similarly to Twitter, in that any user can create, post, and share content on its platforms.
According to the Weibo 2021 annual report, the company offers several products for users to express themselves on its platforms, including a post, an individual page, a story, top articles, Weibo Q&A, and Weibo Live Streaming.
Let’s look at the respective monthly active users.
Please use the table of contents to navigate this page.
Table Of Contents
Definitions And Overview
O2. How Do Social Media Platforms Increase Their Monthly Active Users?
O3. Duplicate And False Accounts
Consolidated Results
A1. Global MAU
Results By Region
B1. North America (U.S. & Canada) MAU
B2. Europe MAU
B3. Asia Pacific MAU
B4. International (Outside Of The U.S. & Canada) MAU
MAU Growth Rates
C1. Facebook MAU Growth Rates
C2. Pinterest MAU Growth Rates
C3. Weibo MAU Growth Rates
Conclusion And Reference
S1. Conclusion
S2. References and Credits
S3. Disclosure
Definitions
To help readers understand the content better, the following terms and glossaries have been provided.
Facebook MAU: Meta defines a monthly active user as a registered and logged-in Facebook user who visited Facebook through its website or a mobile device, or used the Messenger application (and is also a registered Facebook user), in the last 30 days as of the date of measurement.
MAUs measure the size of the company’s global active user community on Facebook.
The numbers for MAU do not include users on Instagram, WhatsApp, or any other products unless they would otherwise qualify as MAUs based on their other activities on Facebook.
Pinterest MAU: Pinterest defines a monthly active user as an authenticated Pinterest user who visits its website, opens the mobile application or interacts with Pinterest through one of the browser or site extensions, such as the Save button, at least once during the 30 days ending on the date of measurement.
Weibo MAU: Weibo MAUs are Weibo users who logged on with a unique Weibo ID and accessed Weibo through its website, mobile website, desktop or mobile applications, SMS or connections via its platform partners’ websites or applications that are integrated with Weibo, during a given calendar month.
The numbers of Weibo MAUs are calculated using internal company data that has not been independently verified, and the company treats each account as a separate user for purposes of calculating MAUs. However, it is possible that certain individuals or organizations may have set up more than one account, and multiple individuals use certain accounts within an organization.
How Do Social Media Platforms Increase Their Monthly Active Users?
Social media platforms adopt a variety of strategies to boost their monthly active users (MAUs), aiming to increase engagement, attract new users, and retain existing ones. Here are some of the strategies they use:
1. **User-Friendly Interface:** Ensuring the platform is intuitive, easy to navigate, and visually appealing to enhance user experience.
2. **Content Personalization:** Utilizing algorithms to personalize content for users based on their interests, activities, and interactions, encouraging them to spend more time on the platform.
3. **Feature Updates and Innovations:** Regularly introducing new and improved features to keep the platform engaging and ahead of competitors, such as stories, live streaming, and augmented reality filters.
4. **Mobile Optimization:** Ensuring the platform is fully optimized for mobile devices, considering that many users access social media through smartphones and tablets.
5. **Engagement Incentives:** Encouraging user interaction through likes, comments, shares, and other forms of engagement. Features like notifications prompt users to return to the platform regularly.
6. **Social Sharing Options:** Making it easy for content to be shared both within the platform and externally, helping to attract new users through existing users’ networks.
7. **Collaborations with Influencers:** Partnering with influencers and content creators to reach wider audiences and tap into their followers, thereby drawing more users to the platform.
8. **Effective Use of Data Analytics:** Analyzing user data to understand behaviour patterns, preferences, and trends, which can inform user engagement and growth strategies.
9. **Advertising and Promotions:** Utilizing targeted advertising to attract new users and promotional campaigns to re-engage inactive users.
10. **Community Building:** Encouraging the formation of communities and groups around shared interests, making the platform more sticky and increasing users’ time.
11. **Customer Support and Feedback:** Providing responsive customer support and incorporating user feedback into platform improvements to enhance user satisfaction and loyalty.
By implementing these strategies, social media platforms can effectively boost their MAUs, fostering a vibrant and engaged user base.
Duplicate And False Accounts
Social media platforms often report their monthly active user (MAU) results inaccurately due to the presence of duplicate and false accounts. A duplicate account is one a user maintains in addition to their principal account. False accounts on social media platforms are profiles created to deceive or mislead others.
False accounts can be used for various purposes, including impersonating real individuals, promoting fraudulent schemes, spreading misinformation, or manipulating public opinion. These accounts often lack genuine personal information, may use stolen or fabricated images, and typically do not represent a real person’s identity. Social media companies actively seek to identify and remove such accounts to protect users and maintain the integrity of their platforms.
According to Meta, duplicate and false accounts are complicated to measure at their scale, and the actual number of duplicate and false accounts may vary significantly from estimates.
Facebook estimated that duplicate accounts may have represented approximately 10% of its worldwide MAUs in the fourth quarter of 2023. Facebook estimated that false accounts may have represented approximately 4% of its worldwide MAUs in the same period.
Facebook believes the percentage of duplicate accounts is meaningfully higher in developing markets such as the Philippines and Vietnam than in more developed markets.
Global MAU
Facebook, Pinterest and Weibo’s global MAU
(click image to expand)
The definitions of monthly active users are available here: Facebook MAU, Pinterest MAU, and Weibo MAU.
Global monthly active users include all users from all regions around the world.
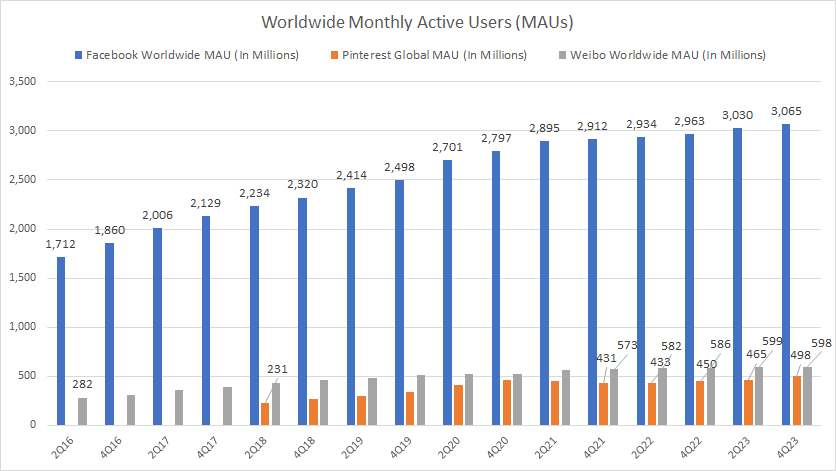
As of fiscal Q4 2023, Facebook’s worldwide monthly active user count exceeded 3.0 billion, which was much higher than Pinterest’s and Weibo’s figures.
Weibo’s monthly active users reached 598 million as of fiscal 4Q 2023, a slight increase from the previous year. Weibo’s MAU count has doubled since 2016, from 282 million users in 2016 to 600 million users as of 2023.
In comparison, Pinterest recorded 498 million monthly active users in fiscal 4Q 2023, up from 450 million users reported the previous year. Since 2018, Pinterest’s MAU count has more than doubled, from 231 million in 2018 to nearly 500 million users as of 2023.
It’s worth noting that Facebook’s monthly active user count of 3 billion people is massive, considering that over one-third of the world’s population uses it at least once a month.
Additionally, Weibo’s monthly active user count is significant, given that most of its user base comes from China. With nearly 600 million monthly active users, Weibo MAU represents half of China’s total population of 1.2 billion.
North America (U.S. & Canada) MAU
Facebook and Pinterest’s North America MAU
(click image to expand)
The definitions of monthly active users are available here: Facebook MAU, Pinterest MAU, and Weibo MAU.
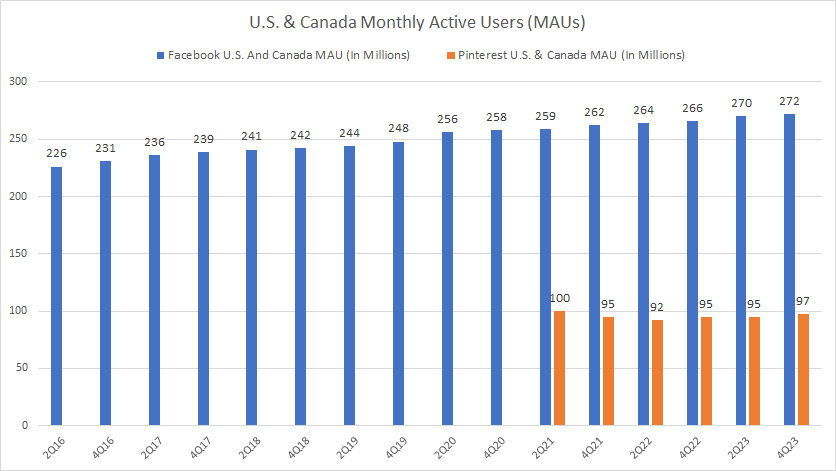
As of fiscal 2023 Q4, Facebook’s monthly active users (MAUs) in the U.S. and Canada totaled 272 million, nearly triple the number of Pinterest’s MAUs. Pinterest’s U.S. and Canada monthly active users for fiscal 4Q 2023 were 97 million, showing a slight increase from the previous year.
Despite being a giant platform, Facebook’s MAUs in North America have continued growing year-over-year, albeit slower. On the other hand, Pinterest’s U.S. and Canada MAUs have remained mainly stable. Pinterest is a relatively new player in the social media industry.
Europe MAU
Facebook and Pinterest’s Europe MAU
(click image to expand)
The definitions of monthly active users are available here: Facebook MAU, Pinterest MAU, and Weibo MAU.
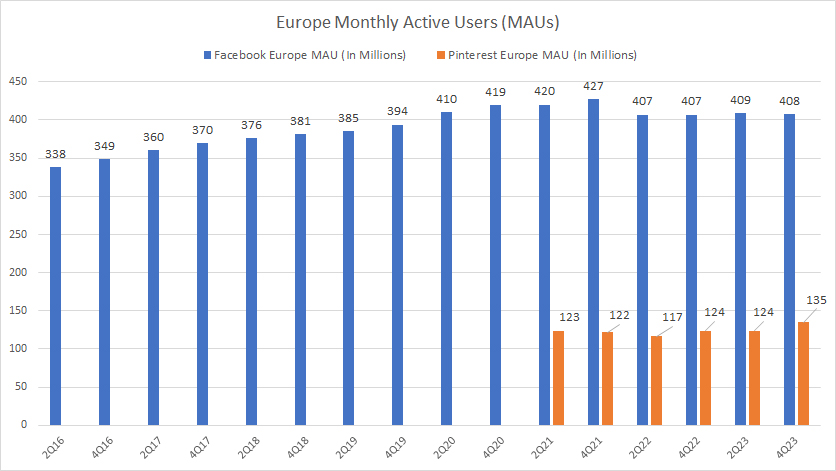
Regarding monthly active users in Europe, only Facebook and Pinterest provide a breakdown of their figures. On the other hand, Weibo does not offer information on its Europe MAUs, which indicates that it may not be significant.
As of fiscal 2023 Q4, Facebook has 408 million monthly active users in Europe, roughly the same as reported a year ago. Since 2016, Facebook’s MAU has increased by 20%, from 338 million active users in 2016 to over 400 million active users as of 2023.
Meanwhile, on a year-over-year basis, Pinterest’s monthly active users in Europe grew significantly to 135 million as of fiscal 4Q 2023. Since 2021, Pinterest’s MAU has increased by 10%, from 123 million active users in 2021 to 135 million active users as of 2023.
With over 400 million monthly active users, Facebook’s user base in Europe represents more than half of the total population in this region.
Asia Pacific MAU
Facebook’s Asia Pacific MAU
(click image to expand)
The definitions of monthly active users are available here: Facebook MAU, Pinterest MAU, and Weibo MAU.
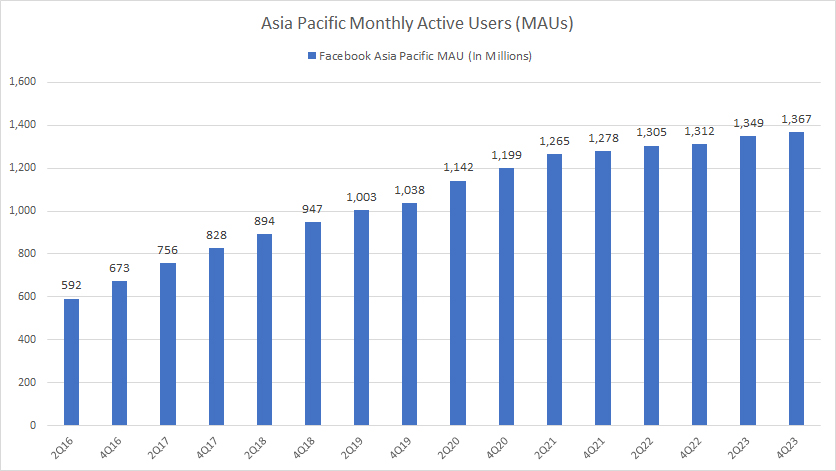
It’s worth noting that Weibo and Pinterest don’t provide specific data on their Asia Pacific monthly active users (MAUs), which are likely insignificant outside of China for Weibo.
However, Facebook’s Asia Pacific MAU count reached 1.37 billion as of 4Q 2023, a significant increase from the previous year. Since 2016, Facebook MAU in the Asia Pacific has increased by 130%, from 592 million users in 2016 to nearly 1.4 billion as of 2023.
Despite the already massive user base in the Asia Pacific region, Facebook has managed to grow its MAU count further. With 1.37 billion MAUs, Facebook’s user base now represents over one-fourth of the total population in the Asia Pacific.
This large user base shows that Facebook’s growth in the Asia Pacific is still robust. Given the size of the population and the relatively low average revenue per user reported for this region, Facebook may rely heavily on Asia Pacific growth to maintain its overall growth story.
International (Outside Of The U.S. & Canada) MAU
Facebook and Pinterest’s International MAU
(click image to expand)
The definitions of monthly active users are available here: Facebook MAU, Pinterest MAU, and Weibo MAU.
Weibo does not explicitly break down its International MAU figures, which most likely are insignificant.
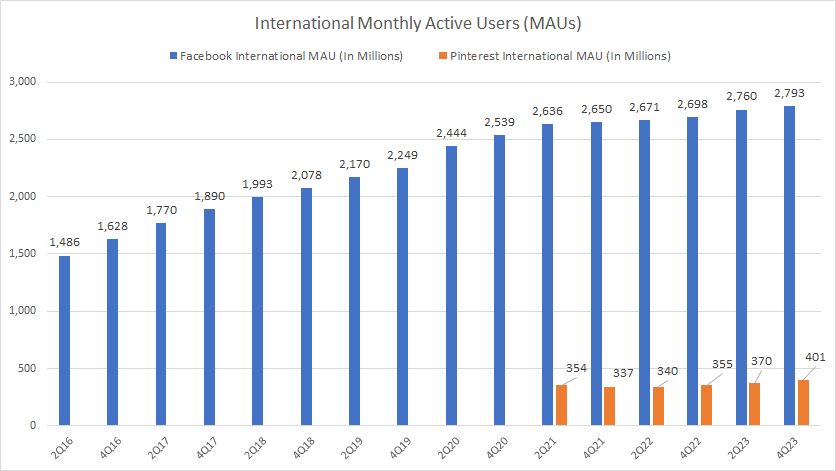
When we compare the user base of Facebook and Pinterest, we can see that Facebook has a much larger international monthly active users than Pinterest.
As per the data of fiscal 2023 4Q, Facebook had around 2.8 billion monthly active users from countries outside the U.S. and Canada, which is 100 million more than the previous year. Over the past eight years, Facebook’s International MAU count has doubled from 1.5 billion in 2016 to 2.8 billion as of 2023.
In contrast, Pinterest’s international MAU count was only 400 million as of 4Q 2023, representing 14% of Facebook’s user count. Since 2021, Pinterest’s International MAU has increased by 13%, from 354 million users in 2021 to 400 million as of 2023.
Both Facebook and Pinterest may rely more on international user growth in the future as the user base in the U.S. and Canada has been mostly stagnant.
Facebook MAU Growth Rates
Facebook MAU Growth Rates By Region
(click image to expand)
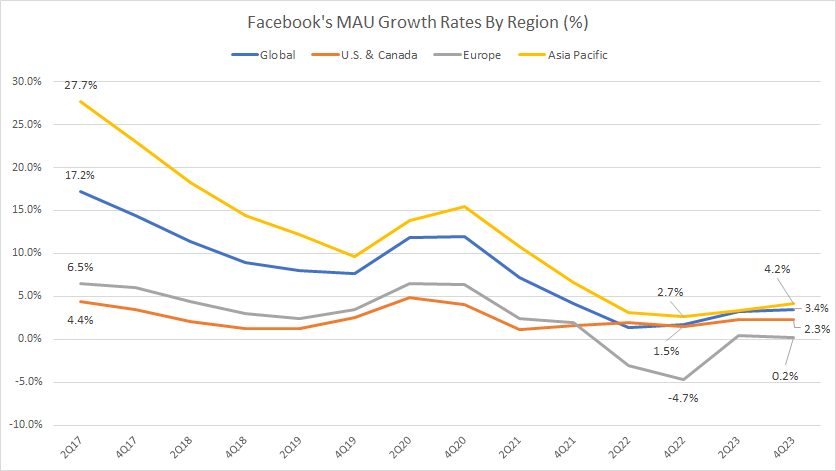
According to the chart above, Facebook’s MAU growth has significantly declined in all regions. For instance, the most apparent decline occurs in the Asia Pacific region. Facebook’s MAU growth in the Asia Pacific has plummeted from 27.7% in 2017 to only 4.2% as of 4Q 2023.
Similarly, Facebook’s MAU growth in Europe measured just 0.2% as of Q4 2023. The growth rates in the U.S. and Canada have remained at less than 5%. In fiscal 4Q 2023, Facebook’s North America MAU grew just 2.3% year-on-year, the lowest ever measured since 2017.
Globally, Facebook’s MAU growth came to 3.4% year-over-year as of 4Q 2023. In summary, Facebook’s growth rates have been in the low single digits across all regions.
Pinterest MAU Growth Rates
Pinterest MAU Growth Rates By Region
(click image to expand)
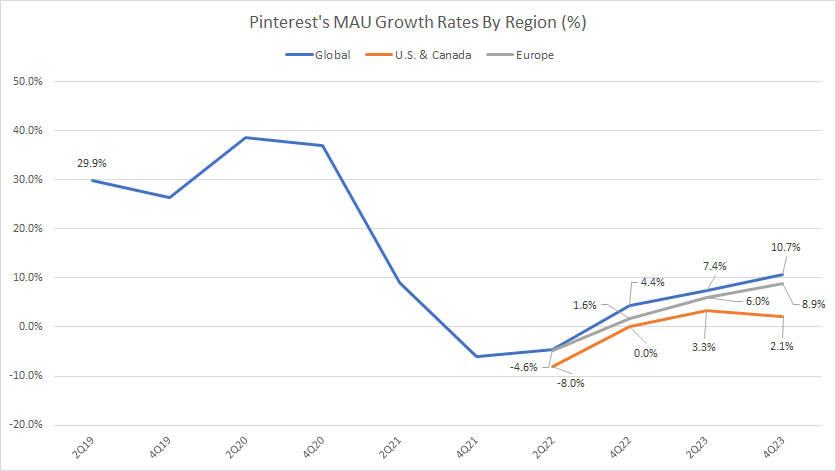
According to the chart, Pinterest’s monthly active user growth in all regions has significantly decreased during the period shown. For example, global MAU growth has plummeted from 30% in 2019 to 10.7% in 2023.
However, in recent quarters, Pinterest’s MAU growth has improved considerably in all regions. For instance, as of Q4 2023, Pinterest’s global MAU growth rose to 10.7%, a significant increase from 4.4% reported a year ago.
Similarly, Pinterest’s MAU growth in Europe has increased from 1.6% in 4Q 2022 to 8.9% in 4Q 2023. In the US and Canada, Pinterest’s MAU growth measured 2.1% as of 4Q 2023, a significant improvement from 0.0% reported a year ago.
Weibo MAU Growth Rates
Weibo MAU Growth Rates By Region
(click image to expand)
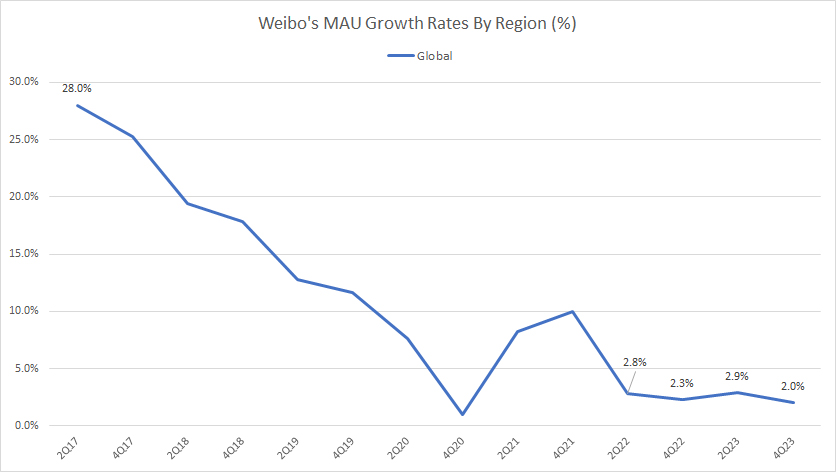
Weibo’s global MAU growth has decreased from 28% six years ago to just 2.0% in 2023. In recent quarters, Weibo has experienced mostly low single-digit MAU growth.
Conclusion
Facebook, Pinterest, and Weibo are experiencing low single-digit monthly active user (MAU) growth in most regions and countries. In Europe, the U.S., and Canada, Facebook and Pinterest’s MAU numbers have remained stagnant and have hardly shown any growth in recent years.
However, despite this slow growth, MAU growth outside of the U.S. and Canada, particularly in the Asia Pacific region, is still relatively strong for Facebook and Pinterest. As a result, these companies may rely on their user base outside of the U.S. and Canada to drive future growth.
References and Credits
1. All financial figures presented in this article were obtained and referenced from quarterly and annual statements, SEC filings, earnings releases, presentations, press releases, etc., which are available in the following links:
a) Facebook Investor Relations
b) Pinterest Investor Relations
c) Weibo Investor Relations
2. Featured images in this article are used under Creative Common Licenses and obtained from Nicole Yeary and Rosaura Ochoa.
Disclosure
References and examples such as tables, charts, and diagrams are constantly reviewed to avoid errors, but we cannot warrant the total correctness of all content.
The content in this article is for informational purposes only and is neither a recommendation nor a piece of financial advice to purchase a stock.
If you find the information in this article helpful, please consider sharing it on social media and provide a link back to this article from any website so that more articles like this can be created in the future.
Thank you!

