Web security. Pexels Images.
Palantir Technologies operates globally, with a presence in over 50 countries. Its software platforms are used by a wide range of clients, including government agencies, defense organizations, healthcare institutions, financial services, and manufacturing companies.
Palantir has offices and clients across North America, Europe, Asia, and other regions, enabling them to provide data solutions on a global scale.
This article looks at Palantir’s revenue breakdown by country. Palantir derives its revenue primarily from the United States. Apart from the U.S., it also generates significant sales in Europe.
Investors interested in Palantir’s specific statistics may find more resources on these pages:
- Palantir revenue breakdown by segment,
- Palantir profit breakdown by segment, and
- Palantir vs Nvidia in R&D expenses.
Let’s look at the details!
Please use the table of contents to navigate this page.
Table Of Contents
Definitions And Overview
O2. What contributes to Palantir Technologies’ significant revenue growth from the U.S.?
Revenue By Country
A1. Revenue From The U.S., U.K., France, etc.
A2. Percentage Of Revenue From The U.S., U.K., France, etc.
Growth Rates of Revenue By Segment
B1. Growth Rates Of Revenue From The U.S., U.K., France, etc.
Summary And Reference
S1. Summary
S2. References and Credits
S3. Disclosure
Definitions
To help readers understand the content better, the following terms and glossaries have been provided.
Revenue By Geography: Palantir’s revenue by geography is defined by the location of the customer’s headquarters or agency at the time of the sale, as stated in the company’s latest annual report.
What contributes to Palantir Technologies’ significant revenue growth from the U.S.?
Palantir Technologies’ significant revenue growth from the U.S. can be attributed to several key factors:
- Government Contracts: Palantir has secured numerous high-value contracts with U.S. government agencies, including defense and intelligence sectors. These contracts have been a substantial source of revenue.
- Commercial Sector Expansion: The company has seen impressive growth in its U.S. commercial sector, driven by the adoption of its AI-powered data analytics solutions. In 2024, Palantir’s commercial revenue grew by 29% year-over-year.
- AI Platform Adoption: Palantir’s AI Platform (AIP) has been a significant driver of growth. The increasing adoption of AIP led to a 134% jump in total contract value from U.S. commercial clients, according to Kontra Investments.
- Strategic Partnerships: Palantir has formed strategic partnerships with various organizations to enhance its offerings and expand its market reach. These partnerships have contributed to its revenue growth.
- Strong Operational Performance: The company’s strong operational performance, including high gross profit margins and efficient cost management, has bolstered its financial results.
These factors combined have positioned Palantir as a leader in the AI-driven analytics space, driving significant revenue growth from the U.S. market.
Revenue From The U.S., U.K., France, etc.
palantir-revenue-by-country
(click image to expand)
Palantir derives its revenue primarily from the United States Of America, the United Kingdom, France, etc. This section explains how Palantir defines its revenue by country: Palantir revenue by country.
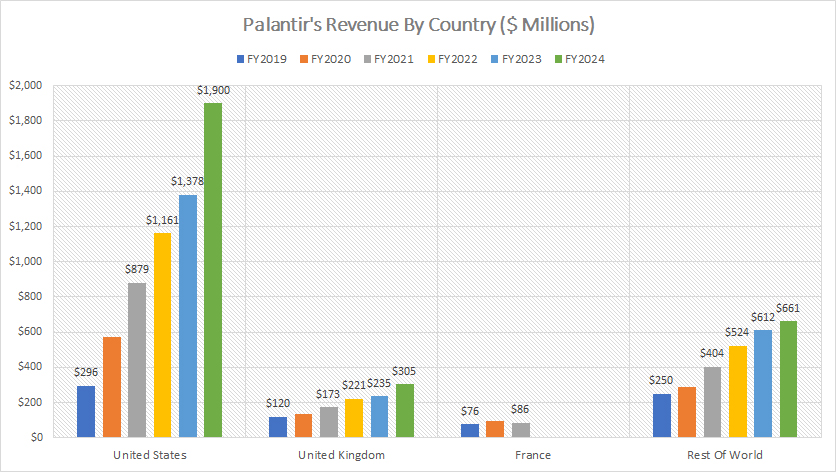
Palantir’s revenue primarily comes from the United States, as illustrated in the chart. In fiscal year 2024, the company earned $1.9 billion from its U.S. operations, making it the largest revenue contributor among all compared countries. In fiscal years 2023 and 2022, Palantir’s U.S. revenue continued to be the highest, with $1.4 billion and $1.2 billion, respectively.
The United Kingdom is Palantir’s second-largest revenue source, although the revenue figures are considerably smaller compared to the U.S. In fiscal year 2024, revenue from the U.K. amounted to $305 million, significantly lower than the $1.9 billion from the United States. In fiscal years 2023 and 2022, Palantir’s U.K. revenue was $235 million and $221 million, respectively.
In France, Palantir earned $86 million in fiscal year 2021. However, in subsequent years, the company stopped providing a separate revenue breakdown for France.
For other countries, Palantir generated a substantial revenue of $661 million in fiscal year 2024. This figure encompasses revenue from multiple regions, highlighting the global demand for Palantir’s data analytics and AI solutions.
Moreover, Palantir’s strategic focus on expanding its commercial sector, particularly in the U.S., has contributed significantly to its revenue growth. The increasing adoption of Palantir’s AI Platform (AIP) by commercial clients has been a major driver of this growth. Additionally, the company’s efforts to diversify its customer base and expand its presence in various industries have bolstered its financial performance.
The company’s robust financial strategy, which includes securing high-value government contracts and forming strategic partnerships, has further reinforced its position as a leader in the AI-driven analytics space. These combined efforts have enabled Palantir to achieve significant revenue growth, particularly in its key markets such as the United States and the United Kingdom.
Percentage Of Revenue From The U.S., U.K., France, etc.
palantir-revenue-by-country-in-percentage
(click image to expand)
Palantir derives its revenue primarily from the United States Of America, the United Kingdom, France, etc. This section explains how Palantir defines its revenue by country: Palantir revenue by country.
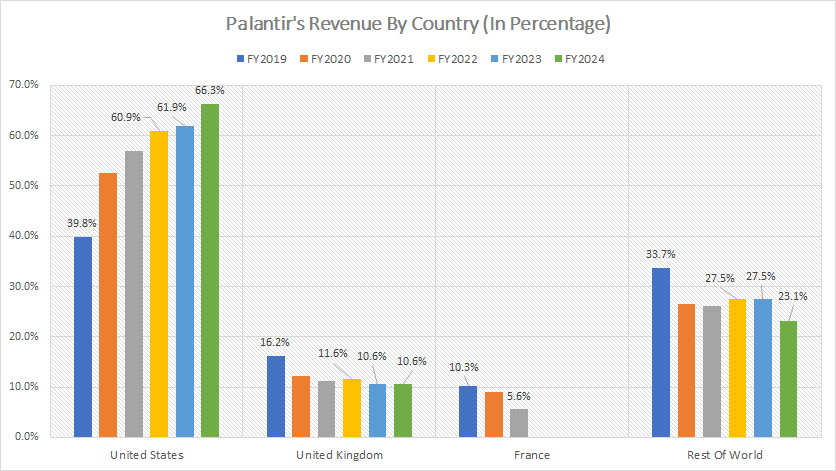
Palantir’s revenue from the U.S. has consistently accounted for over 60% of the total over the past several years. In fiscal year 2024, Palantir’s U.S. revenue share increased to 66% from 62% the previous year. Since fiscal year 2019, Palantir’s U.S. revenue share has risen significantly from 40% to 66% over the past five years.
On the other hand, Palantir’s revenue from the U.K. made up only 10.6% of the total in fiscal year 2024, down from 16.2% in 2019. This trend indicates that while the absolute revenue figures from the U.K. have increased, their overall contribution has decreased due to the much faster revenue growth from other regions, particularly the U.S.
Similarly, Palantir’s revenue contribution from France has experienced a decline. For example, the ratio was 10.3% in 2019, but it dropped to 5.6% by 2021. Since 2022, Palantir has ceased providing a separate revenue breakdown for France.
For other countries, the revenue contribution reached 23% in fiscal year 2024. This ratio has remained relatively lower in recent years, primarily driven by the faster revenue growth in other regions.
In summary, the U.S. is the only country that has experienced a significant increase in revenue contribution, highlighting its critical role in Palantir’s overall growth strategy. The company’s strong presence and strategic focus on the U.S. market have been the main drivers of this revenue growth.
Growth Rates Of Revenue From The U.S., U.K., France, etc.
palantir-growth-rates-of-revenue-by-country
(click image to expand)
Palantir derives its revenue primarily from the United States Of America, the United Kingdom, France, etc. This section explains how Palantir defines its revenue by country: Palantir revenue by country.
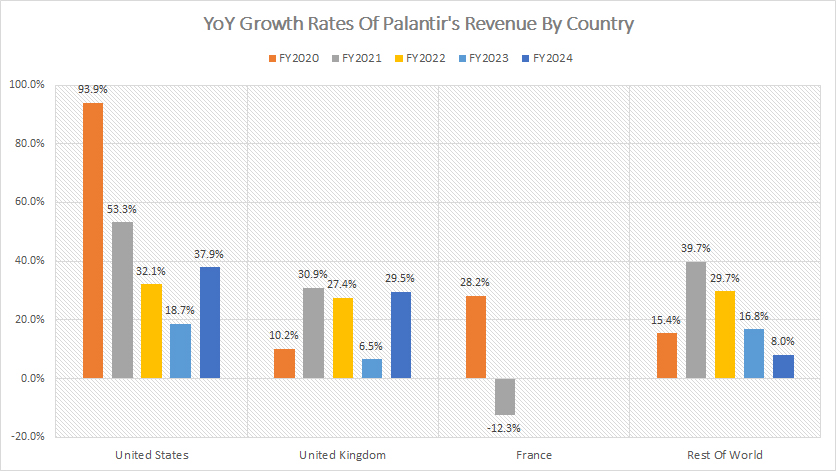
From the revenue growth chart above, it is evident that over the last several years, Palantir’s revenue from the U.S. has grown at significantly higher rates compared to other countries.
For instance, between 2022 and 2024, Palantir’s revenue from the U.S. experienced an impressive average annual growth rate of 29%, outpacing the U.K.’s average annual growth rate of 21%.
For the Rest of the World region, Palantir’s revenue growth averaged 18% annually between 2022 and 2024, reflecting a steady increase in global demand for Palantir’s services.
In contrast, Palantir’s revenue from France decreased by 12.3% in fiscal year 2021 compared to the previous year, making France the only country to experience a significant revenue decline during this period.
While the revenue growth from both the U.S. and the U.K. had previously surged, it slowed to 19% and 6.5%, respectively, in fiscal year 2023 for these countries. However, in fiscal year 2024, Palantir’s revenue growth from both regions rebounded, marking a significant comeback.
This trend highlights the U.S. as a critical driver of Palantir’s overall revenue growth, with the company’s strong market presence and strategic focus on the U.S. market playing a key role in its financial success. While other regions have shown growth, the U.S. stands out with its substantial contribution and higher growth rates.
Conclusion
In summary, the United States plays a critical role in Palantir’s overall revenue growth, demonstrating the company’s strong market presence and strategic focus on the U.S. market. The substantial increase in the U.S. revenue contribution highlights the effectiveness of Palantir’s efforts to secure high-value contracts and expand its commercial sector, particularly with the adoption of its AI Platform (AIP).
While other regions like the U.K. have shown growth in absolute terms, their overall contribution has decreased, indicating a faster pace of revenue growth in the U.S. The decline in revenue contribution from France further emphasizes the shift in Palantir’s focus towards more lucrative markets.
Overall, Palantir’s strategic focus on the U.S. market has been the primary driver of its significant revenue growth, positioning the company as a leader in the AI-driven analytics space.
References and Credits
1. All financial figures presented iwere obtained and referenced from Palantir’s annual reports published on the company’s investor relations page: PLTR Financial Reports.
2. Pexels Images.
Disclosure
We may use the assistance of artificial intelligence (AI) tools to produce some of the text in this article. However, the data is directly obtained from original sources and meticulously cross-checked by our editors multiple times to ensure its accuracy and reliability.
If you find the information in this article helpful, please consider sharing it on social media. Additionally, providing a link back to this article from any website can help us create more content like this in the future.
Thank you for your support and engagement! Your involvement helps us continue to provide high-quality, reliable content.


