Meta’s Family Of Apps. Pixabay Image.
This article presents the revenue and revenue breakdown of Meta Platforms, Inc. (NASDAQ: META).
In addition to the revenue, we also explore Meta’s profitability and margin.
Investors interested in Meta’s revenue by user geography may find more information on this page: Meta revenue by country and region.
Please use the table of contents to navigate this page.
Table Of Contents
Definitions And Overview
A2. Meta Products
A3. Meta Business Strategy
A4. How Meta Earns Revenue
Outlook
Annual Total Revenue
B1. Revenue By Year
B2. Growth Rates Of Revenue By Year
Quarterly Total Revenue
B3. Revenue By Quarter
B4. Revenue By TTM
B5. Growth Rates Of Revenue By TTM
Annual Advertising Revenue
C1. Advertising Revenue By Year
C2. Growth Rates Of Advertising Revenue By Year
Quarterly Advertising Revenue
C3. Advertising Revenue As A Percentage Of Total Revenue
C4. Growth Rates Of Advertising Revenue By TTM
Revenue By Segment
D1. Family Of Apps (FoA) Revenue
D2. Reality Labs (RL) Revenue
D3. FoA and RL Revenue In Percentage
Profitability And Margin By Segment
D4. FoA and RL Operating Income
D5. FoA and RL Operating Margin
Conclusion And Reference
S1. Conclusion
S2. References and Credits
S3. Disclosure
Definitions
To help readers understand the content better, the following terms and glossaries have been provided.
Advertising Revenue: Meta’s advertising revenue is generated by displaying ad products on its various platforms, such as Facebook, Instagram, Messenger, and third-party mobile applications.
Advertisers pay for these ad products based on the number of impressions delivered or the number of actions, such as clicks, taken by users. This revenue is a key source of income for Meta and allows the company to continue to invest in its products and services.
Reality Labs Revenue: Meta’s Reality Labs (RL) revenue is generated by selling and delivering consumer hardware products, such as Meta Quest, wearables, and related software and content.
Revenue is recognized when the time control of the products is transferred to customers, which is usually at the time of delivery, and it reflects the amount of consideration that Reality Labs expects to be entitled to in exchange for the products.
Other Revenue: Other revenue consists of revenue from WhatsApp Business Platform, net fees Meta receives from developers using its Payments infrastructure, and revenue from various other sources.
Meta Products
Family Of Apps
Facebook: Facebook is a social networking platform that allows users to connect with friends, family, and acquaintances from around the world. It was founded in 2004 by Mark Zuckerberg and is now one of the most widely used social media sites, with over 2 billion monthly active users.
Instagram: Instagram is a social media platform where users can share photos and videos, follow other users, and engage with content through likes, comments, and direct messages. It was launched in 2010 and has become one of the most popular social media platforms, with over a billion active users worldwide.
Messenger: Meta’s Messenger is a messaging platform developed by Meta (formerly known as Facebook) that allows users to communicate with each other via text, voice, and video calls. It was launched in 2011 as Facebook Messenger and has since evolved into a standalone app that can be used independently of Facebook.
Threads: Threads is an application for text-based updates and public conversations, where communities come together to discuss topics of interest. People can connect directly with their favorite creators and others who love the same things or build a loyal following to share their ideas, opinions, and creativity with the world.
WhatsApp: WhatsApp is a free messaging and voice-over IP (VoIP) application that allows users to send and receive text messages and voice messages, make voice and video calls, and share documents, photos, videos, and other media types. It was created in 2009 by two former Yahoo employees and later acquired by Facebook in 2014.
Reality Labs
Meta’s Reality Labs is a division of Meta that focuses on developing cutting-edge technologies for the metaverse, such as virtual reality (VR), augmented reality (AR), and artificial intelligence (AI). The division is responsible for creating products and experiences that enable people to feel more connected and engaged, regardless of their physical location.
Some of the products developed by Reality Labs include the Meta Quest devices, Meta Horizon Worlds, the Ray-Ban Meta smart glasses, and Meta Spark. The division’s efforts are primarily directed towards long-term research and development but include shorter-term projects developing specific products and services to market.
Meta Business Strategy
Meta aims to invest based on its priorities, focusing on six key investment areas: AI, the metaverse, discovery engine, monetization of products and services, regulatory readiness, and enhancing developer efficiency.
The company’s AI investments support initiatives across its products and services, helping power the systems that rank content in its apps, recommending relevant content, developing new generative AI experiences, and enhancing developer productivity.
Most of Meta’s investments are directed toward developing its family of apps, with significant investments in its metaverse efforts, including developing virtual and augmented reality devices, software for social platforms, neural interfaces, and other foundational technologies.
Despite operating at a loss for the foreseeable future in the Reality Labs segment, Meta believes investing in the metaverse will unlock monetization opportunities for businesses, developers, and creators, including advertising, hardware, and digital goods.
How Meta Earns Revenue
Meta revenue streams and products
(click image to expand)
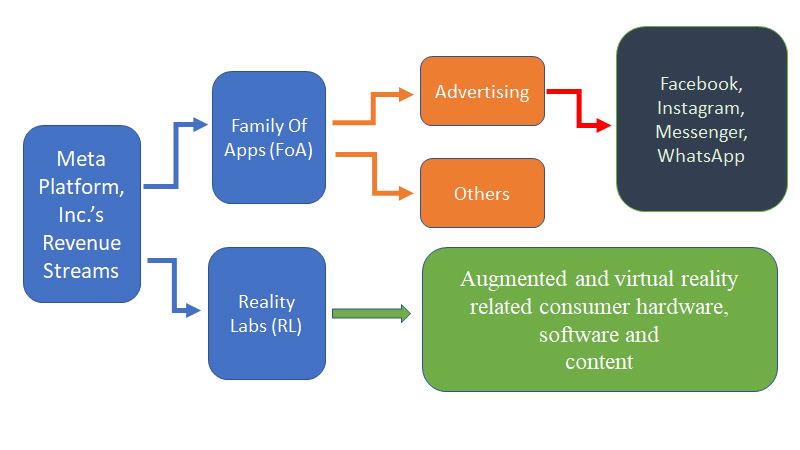
Meta Platforms, Inc.’s (META) revenue streams consist of two segments: Family Of Apps (FoA) and Reaility Labs (RL).
The definitions of FoA and RL revenue are available here: FoA Revenue and RL Revenue. For product definitions, please head to FoA and RL products.
Family of Apps gets its revenue primarily from selling advertising placements to marketers.
Marketers purchase ads that can appear in multiple places, including on Facebook, Instagram, Messenger, and third-party applications and websites.
On the other hand, Reality Labs reflects Meta’s efforts to develop the metaverse and gets its revenue from sales of consumer hardware products, software, and content.
These products include augmented and virtual reality-related consumer hardware, software, and content that help people feel connected anytime, anywhere.
The Meta Quest is one such product and service that helps friends and families stay connected and share the moments that matter in meaningful ways with cutting-edge VR hardware, software, and content.
CFO Outlook Commentary
Some key points of the outlook provided in the 4Q 2023 quarterly release:
-
The first quarter of 2024 total revenue is expected to be $34.5-37 billion.
For Reality Labs, we expect operating losses to increase meaningfully year-over-year due to our ongoing product development efforts in augmented reality/virtual reality and our further investments to scale our ecosystem.
We expect growth to be driven by investments in servers, including AI and non-AI hardware, and data centers as we ramp up site construction with our previously announced new data center architecture.
While we are not providing guidance for years beyond 2024, we expect our ambitious long-term AI research and product development efforts will require growing infrastructure investments beyond this year.
The first quarter of 2024 guided revenue of $35.75 billion midpoint is up significantly from the first quarter of 2023, at 25% year-on-year.
Reality Labs will continue to incur losses.
Meta will invest significantly in AI research and AI-related products.
Revenue By Year
Meta-total-revenue-by-year
(click image to expand)
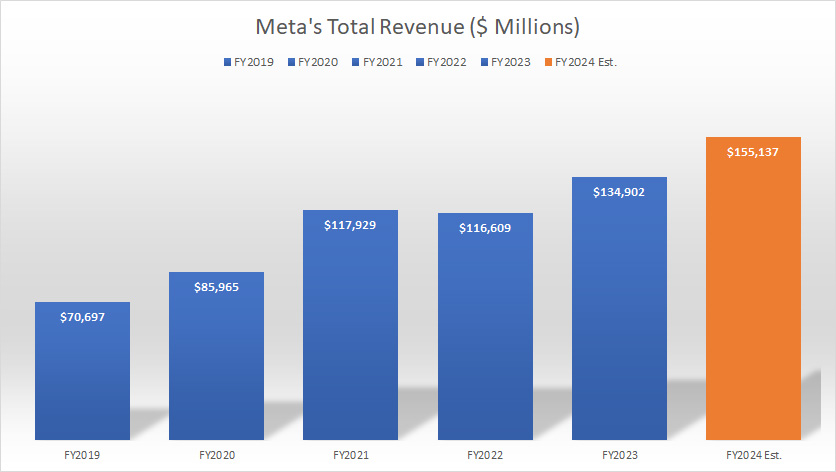
Meta earned US$134.9 billion, US$116.6 billion, and US$117.9 billion in the year ended on Dec 31, 2023, 2022, and 2021, respectively.
As Meta guided for significant revenue growth in 1Q 2024, its total revenue may conservatively land at US$155.1 billion by the end of fiscal 2024, representing a year-on-year growth of 15%, in line with the growth rate in 2023.
Growth Rates Of Revenue By Year
Meta-total-revenue-growth-rates
(click image to expand)
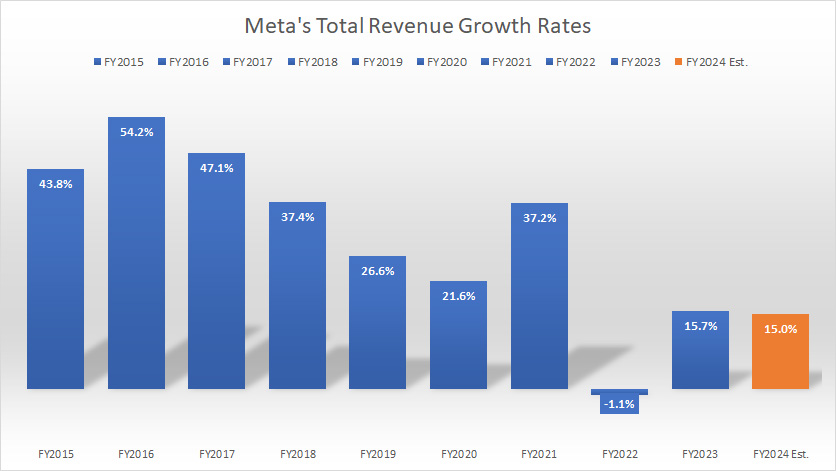
Meta’s revenue increased by 15% YoY in fiscal 2023. The average revenue growth rate came in at 17% between 2021 and 2023.
A noticeable trend is that Meta’s revenue declined in fiscal 2022 for the first after the COVID-19 pandemic.
Revenue By Quarter
Meta-total-revenue-by-quarter
(click image to expand)
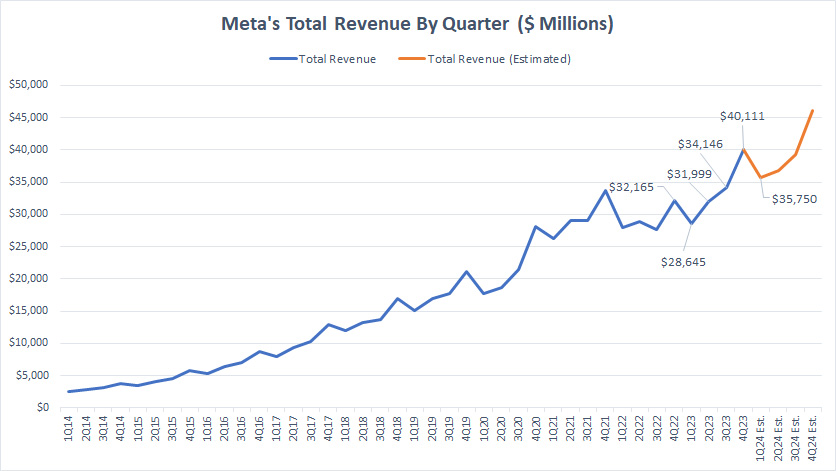
Meta generated US$40.1 billion, US$34.1 billion, US$32.0 billion, and US$28.6 billion in quarterly revenue over the four quarters of 2023.
The 4Q 2023 quarterly revenue was up 24% from a year ago.
Meta guided for quarterly revenue of US$35.75 midpoint for the fiscal quarter 1Q 2024, up 25% year-over-year.
Revenue By TTM
Meta-total-revenue-by-ttm
(click image to expand)
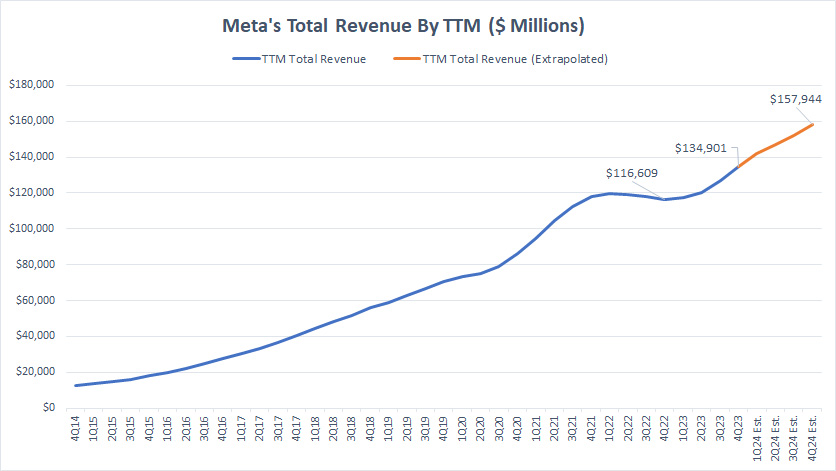
Meta earned over US$134.9 billion in total revenue as of 4Q 2023 on a TTM basis, up 16% over the same quarter a year ago.
The extrapolated plot shows that Meta’s TTM total revenue may reach US$158 billion by the end of fiscal 2024, a rise of 17% over 2023.
Growth Rates Of Revenue By TTM
Meta-growth-rates-of-total-revenue-by-ttm
(click image to expand)
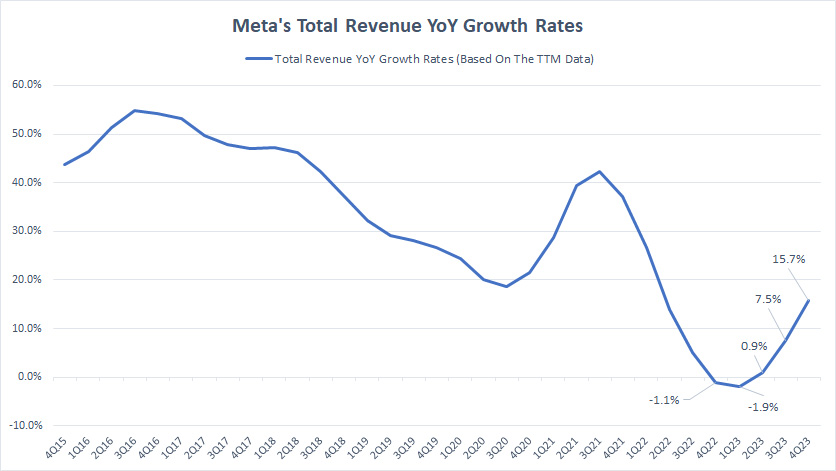
Meta’s revenue growth has considerably slowed in recent years, especially post-pandemic, as depicted in the chart above.
As seen, Meta’s revenue growth was down to low single digits between 2022 and 2023.
However, the latest growth rate gained 15.7% and significantly rose from -1.1% a year ago.
Besides, Meta has guided for a significant revenue rise in 1Q 2024 from a year ago, as shown here: Meta’s outlook.
Is Meta experiencing a potential turnaround in its revenue growth? Probably.
Advertising Revenue By Year
Meta-advertising-revenue
(click image to expand)
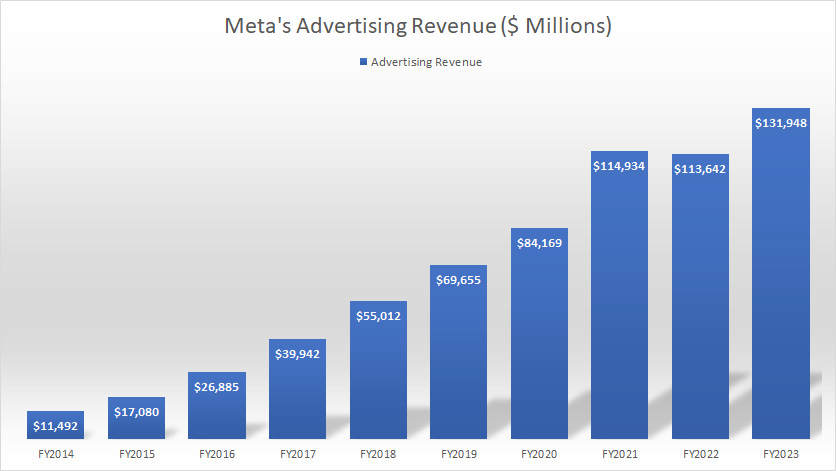
The definition of Meta’s advertising revenue is available here: advertising revenue. Advertising revenue is Meta’s most important revenue source.
Despite venturing into the metaverse, Meta continues to depend on advertising revenue.
Meta earned a record figure of US$131.9 billion in advertising revenue in fiscal 2023, a significant rise over US$113.6 billion in 2022.
Growth Rates Of Advertising Revenue By Year
Meta-advertising-revenue-growth-rates
(click image to expand)
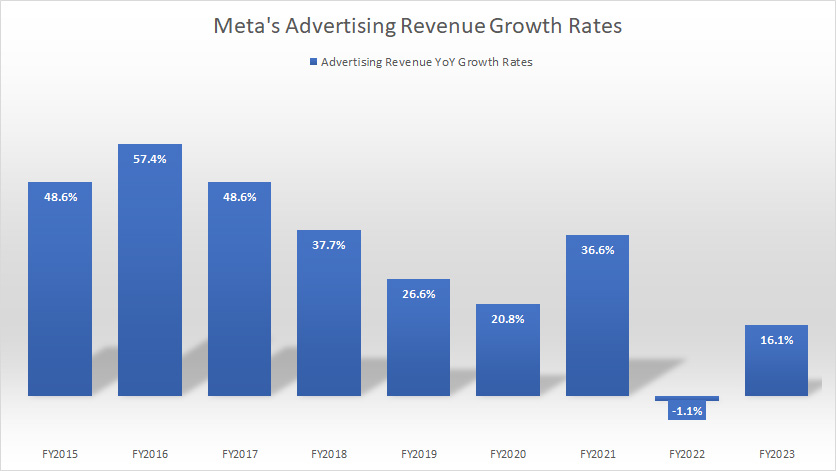
Meta’s advertising revenue in fiscal 2023 grew 16.1% over 2022.
A noticeable trend is that Meta’s advertising revenue growth has significantly slowed in recent years.
While Meta’s advertising revenue grew 16.1% in 2023, it was one of the lowest growth rates ever measured since 2015.
In addition, Meta’s advertising revenue actually declined by 1.1% in 2022, a decrease for the company since 2015.
Advertising Revenue As A Percentage Of Total Revenue
Meta-advertising-revenue-to-total-revenue-ratio
(click image to expand)
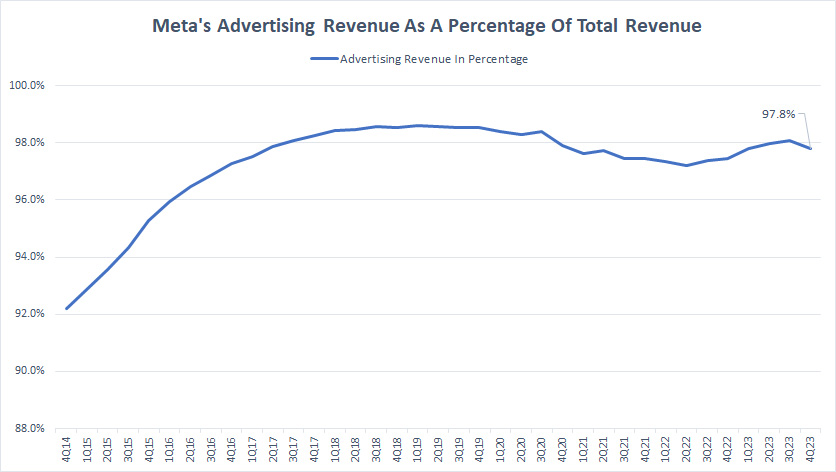
Meta’s advertising revenue consistently accounts for over 90% of its total revenue.
This figure has risen from 92% in 2014 to 97.8% as of 4Q 2023, indicating the growing importance of advertising revenue to Meta Platforms, Inc.
Despite the hype surrounding the metaverse, Meta Family of Apps’ advertising revenue continues to be the company’s primary revenue source.
This suggests that while the metaverse may hold great potential for Meta in the future, the company’s advertising business remains a crucial component of its success.
Growth Rates Of Advertising Revenue By TTM
Meta-growth-rates-of-advertising-revenue-by-ttm
(click image to expand)
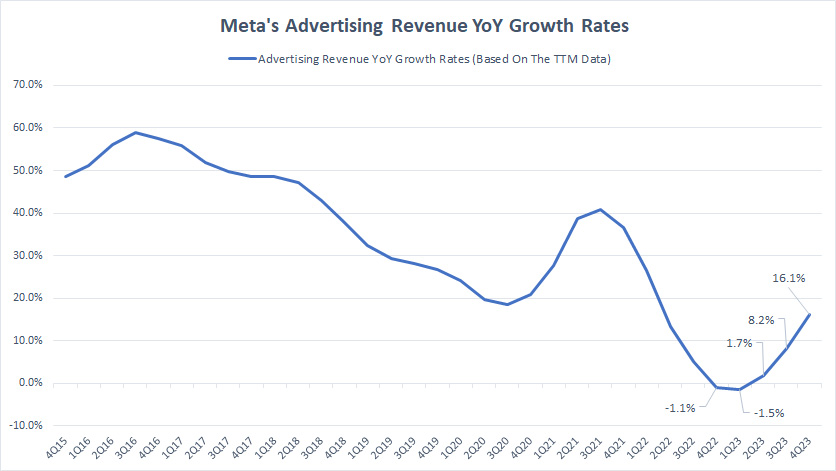
Similar to the consolidated revenue, Meta’s advertising revenue growth rates have significantly declined over the years.
Meta’s advertising revenue has only grown by low single digits in recent periods, as shown in the chart.
As of 4Q 2023, Meta’s advertising revenue grew to 16.1%, significantly higher than -1.1% a year ago.
Family Of Apps (FoA) Revenue
Family Of Apps Revenue
(click image to expand)
The definitions of FoA and Other revenue are available here: FoA revenue and Other revenue. For product definitions, please head to FoA products.
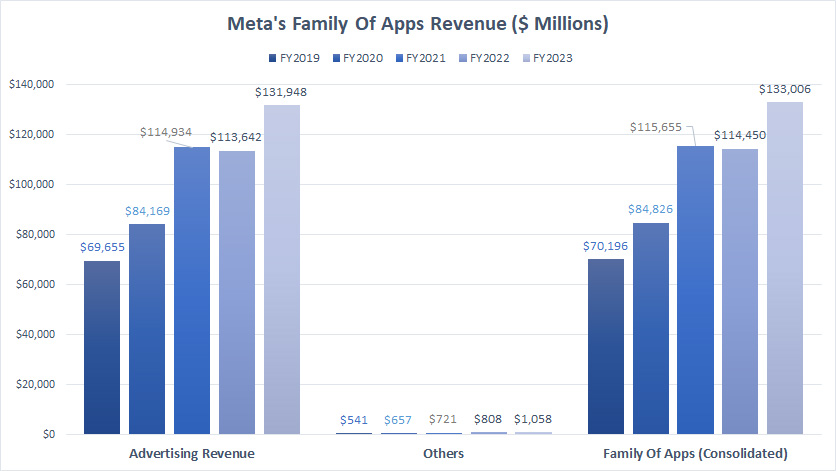
The Family of Apps (FoA) is a major segment of Meta Platforms, Inc., primarily generating revenue from advertising.
The chart above shows that advertising revenue accounts for the lion’s share of FoA’s consolidated revenue.
Meta’s FoA earned US$131.9 billion, US$113.6 billion, and US$114.9 billion in advertising revenue in the years ended on Dec 31, 2023, 2022, and 2021, respectively.
Meta’s Other revenue within the FoA sector totaled only US$1.1 billion as of fiscal 2023, which looked seemingly immaterial compared to the advertising revenue.
Reality Labs (RL) Revenue
Reality Labs Revenue
(click image to expand)
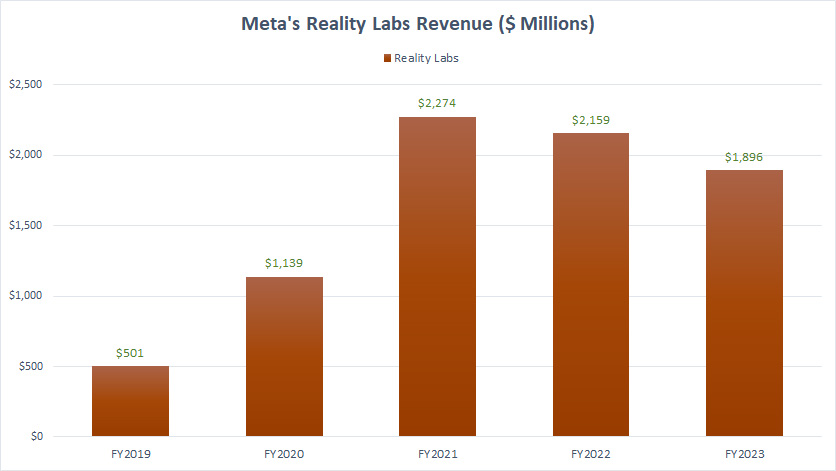
Meta’s Reality Labs (RL) is the division responsible for developing the metaverse. The definitions of RL revenue are available here: RL revenue. For product definitions, please head to RL products.
That said, Reality Labs’ revenue was much smaller than Family Of Apps, totalling only US$1.9 billion in fiscal 2023.
A noticeable trend is that Meta’s RL revenue has significantly decreased since 2021, from US$2.3 billion in 2021 to US$1.9 billion as of 2023.
Although RL’s revenue growth was lower in 2023 than in 2021, it was up 72% over 2020.
FoA And RL Revenue In Percentage
Meta-Family-of-Apps-and-Reality-Labs-revenue-in-percentage
(click image to expand)
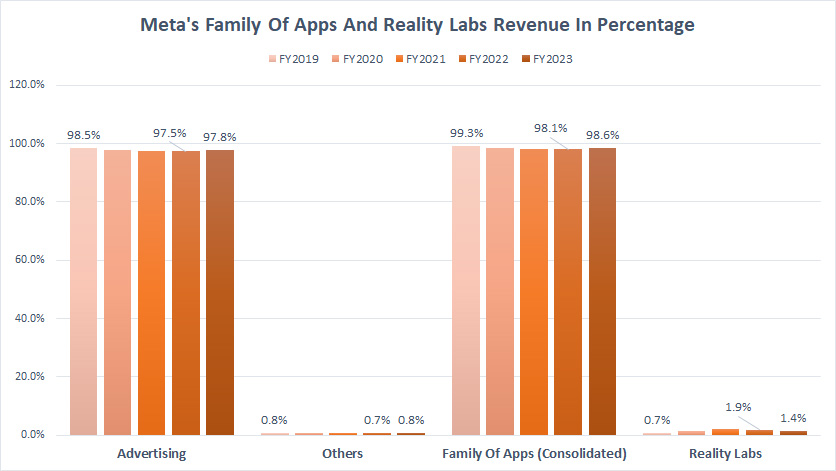
Family Of Apps’ revenue accounts for most of Meta’s total revenue, reaching 98.6% as of fiscal 2023.
This trend is expected as advertising revenue is Family of Apps’s primary income source.
In fiscal 2023, advertising revenue accounted for 97.8% of Meta’s total revenue.
On the other hand, Reality Labs’ revenue makes up only a small portion of Meta’s total revenue.
In fiscal 2023, Reality Labs’ revenue ratio was only 1.4%.
Despite the insignificant revenue contribution from Reality Labs, the ratio has considerably risen since fiscal 2019.
For example, Reality Labs contributed to only 0.7% of total revenue in 2019, and this ratio increased to 1.4% as of 2023.
FoA And RL Operating Income
Meta-operating-income-by-segment
(click image to expand)
The definitions of FoA and RL revenue are available here: FoA Revenue and RL Revenue. For product definitions, please head to FoA and RL products.
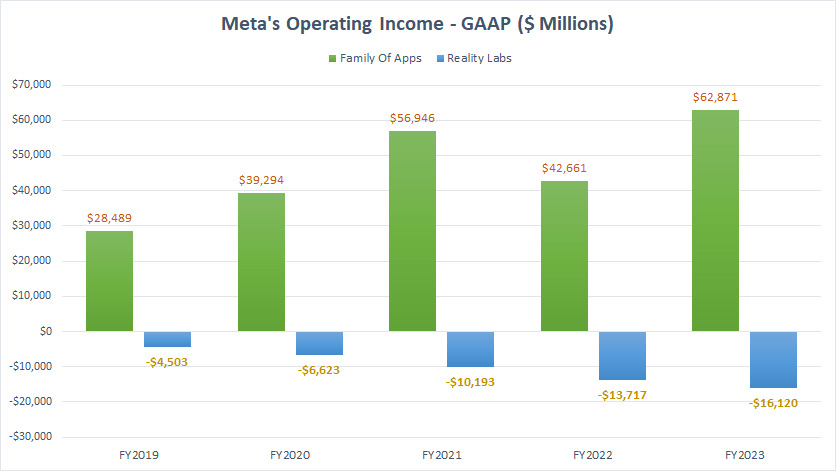
Family Of Apps is the only segment that has reported a profit all these years.
On the other hand, Reality Labs has yet to turn a profit and has continued to incur losses.
In fiscal 2023, Family Of Apps earned US$62.9 billion in operating income, a significant rise over US$42.7 billion in 2022.
On the other hand, Reality Labs’ operating loss increased to US$16.1 billion as of 2023, a much worse figure than in 2022.
A primary concern is Reality Labs’ increasing operating loss, which reached a record high of US$16.1 billion in 2023, the largest loss reported since 2019.
In summary, Meta’s advertising segment is a more profitable business than selling hardware and software in the metaverse.
FoA And RL Operating Margin
Meta-operating-margin-by-segment
(click image to expand)
The definitions of FoA and RL revenue are available here: FoA Revenue and RL Revenue. For product definitions, please head to FoA and RL products.
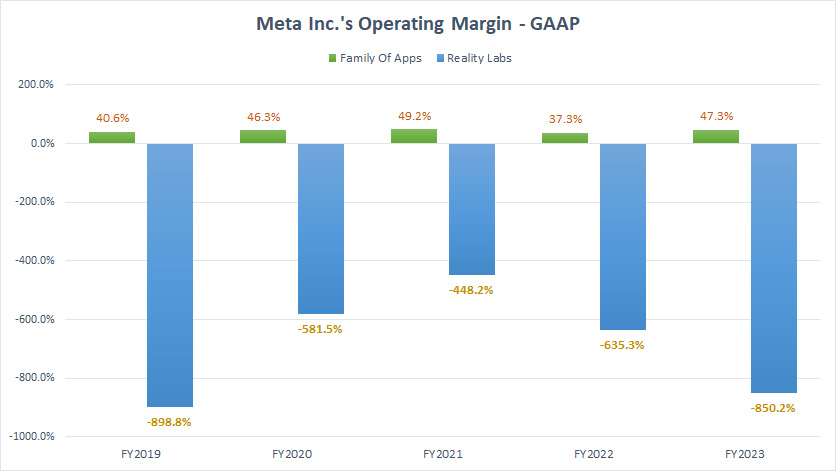
The Family of Apps has an operating margin exceeding 40%, while Reality Apps still operates at a loss.
In fiscal 2023, Family Of Apps’ operating margin arrived at 47.3%, up significantly from 37.3% in 2022.
On the other hand, Reality Labs’ operating loss slipped to -850% in 2023 compared to -635% in 2022.
Again, Meta’s Family of Apps is a much more profitable segment than Reality Labs.
Conclusion
Meta Platforms, Inc. makes money primarily from selling advertising space on its platforms, such as Facebook, WhatsApp, Messenger, and Instagram.
Meta Platforms operates in two reportable segments: Family of Apps and Reality Labs.
Family Of Apps is a much bigger revenue driver than Reality Labs and a much more profitable business segment.
Margin-wise, Family Of Apps’ operating margin topped 47.3% and 37.3% in 2023 and 2022, respectively, while Reality Labs’ figure declined to -850% in 2023.
In short, Family of Apps makes more money and is much more profitable than Reality Labs.
References and Credits
1. Meta Platform, Inc., financial figures are obtained from the company’s annual and quarterly reports, which are available in Meta Investor Relations.
2. Image by Gerd Altmann from Pixabay.
Disclosure
References and examples such as tables, charts, and diagrams are constantly reviewed to avoid errors, but we cannot warrant the total correctness of all content.
The content in this article is for informational purposes only and is neither a recommendation nor a piece of financial advice to purchase a stock.
If you find the information in this article helpful, please consider sharing it on social media and providing a link to this article from any website so that more articles like this can be created in the future.
Thank you!

