Lights on highway. Pexels Image.
This article presents BYD’s global revenue and revenue by segment.
BYD’s reportable segments consist of two major divisions, namely: mobile handset components and automobiles.
BYD derives its revenue primarily from the sales of automobile products. BYD’s revenue share of automobile products hit the highest level of 80% in fiscal year 2024.
Let’s dive into the details!
For other key statistics of BYD, you may find more information on these pages:
Sales
- BYD global car sales,
- BYD commercial vehicle sales,
- BYD sales breakdown of nev,
- BYD electric and hybrid vehicle sales,
Revenue
Profit Margin
- BYD profitability, vehicle margin, and profit per car,
- BYD vs Tesla: vehicle profit and margin analysis
R&D Budget
Please use the table of contents to navigate this page.
Table Of Contents
Definitions
- Automobiles and Related Products, and Others
- Mobile Handset Components, Assembly Service, and Others
- Yuan to USD conversion
Consolidated Results
A1. Total Revenue
Revenue By Segment
B1. Revenue from Mobile Handset Components and Automobiles Segments
B2. Revenue from Mobile Handset Components and Automobiles Segments in Percentage
Growth Rates
C1. Mobile Handset Components and Automobiles Revenue Growth
Conclusion And Reference
S1. Insight
S2. References and Credits
S3. Disclosure
Definitions
To help readers understand the content better, the following terms and glossaries have been provided.
Automobiles And Related Products, And Others: BYD’s Automobiles and Related Products, and Others segment encompasses the manufacture and sale of automobiles, including internal combustion, hybrid, and battery-electric passenger vehicles.
It also includes buses, coaches, taxis, logistics vehicles, construction vehicles, sanitation vehicles, and vehicles for warehousing, port, airport, and mining operations. Additionally, this segment covers auto-related molds and components, automobile leasing, after-sales services, and automobile power batteries.
Mobile Handset Components, Assembly Service, And Others: BYD’s Mobile Handset Components, Assembly Service, and Other Products segment involves the manufacture and sale of mobile handset components such as housings and electronic components.
Additionally, this segment provides assembly services for these components. Essentially, BYD acts as a one-stop supplier for mobile phone manufacturers, offering product design, manufacturing, testing, assembly, and after-sales services.
Renminbi (RMB): Renminbi or RMB is the official currency of the People’s Republic of China. The primary unit of the renminbi is the yuan. The symbol for the Chinese Yuan Renminbi is CN¥ or simply ¥.
BYD Company uses the Renminbi (RMB) for its financial transactions and reporting. The current exchange rate for the Chinese Yuan (CN¥) to the US Dollar (USD) is approximately 7.22 CN¥ for 1 USD.
Total Revenue
byd-global-revenue
(click image to expand)
BYD uses the Renminbi (RMB), also known as the Chinese Yuan (CNY), for its financial transactions and reporting. The exchange rate of the Chinese Yuan to USD is available here: Yuan to USD conversion.
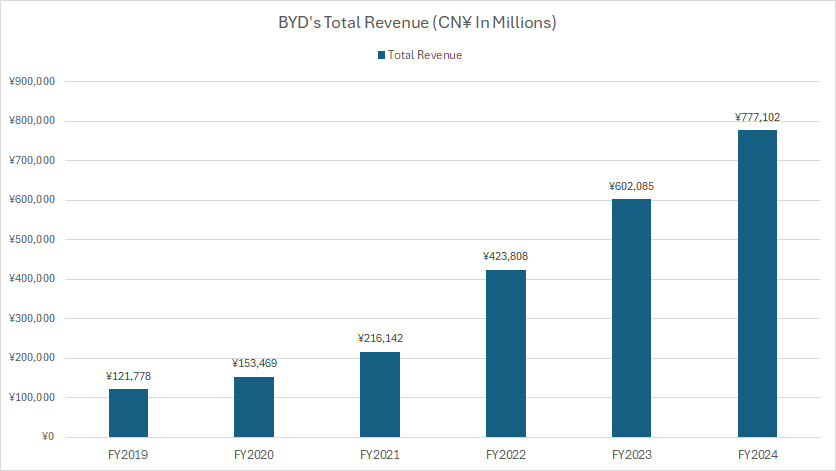
BYD’s total revenue has experienced substantial growth over the past several years, consistently reaching record highs in recent periods.
The following table shows more detailed results:
Total Revenue in FY2024:
| Segment | Revenue |
|---|---|
| (CN¥ Billions) | |
| Consolidated | ¥777.1 (US$108) |
3-Year Trend from FY2021 to FY2024:
| Segment | Revenue | % Changes |
|---|---|---|
| (CN¥ Billions) | ||
| Consolidated | ¥216.1 to ¥777.1 | +259.5% |
5-Year Trend from FY2019 to FY2024:
| Segment | Revenue | % Changes |
|---|---|---|
| (CN¥ Billions) | ||
| Consolidated | ¥121.8 to ¥777.1 | +538.1% |
Revenue from Mobile Handset Components and Automobiles Segments
byd-revenue-by-segment
(click image to expand)
BYD uses the Renminbi (RMB), also known as the Chinese Yuan (CNY), for its financial transactions and reporting. The exchange rate of the Chinese Yuan to USD is available here: Yuan to USD conversion.
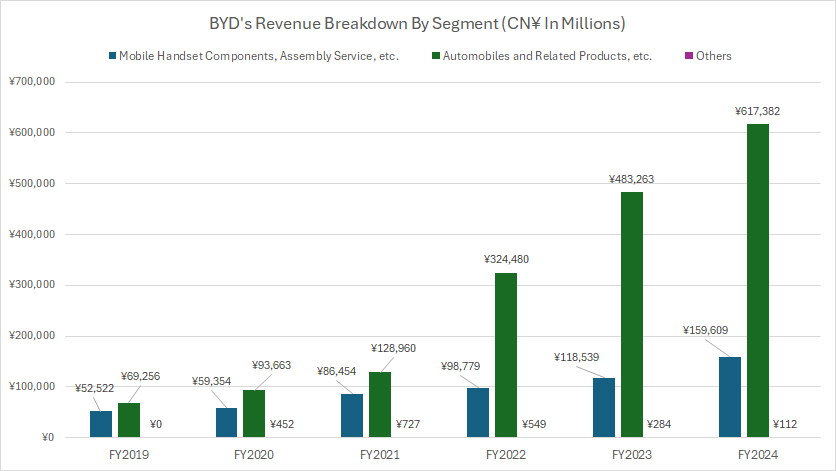
BYD’s businesses consist of two major segments: automobiles and mobile handset components. The definitions of BYD’s segments are available here: automobiles and mobile handset components.
BYD’s primary income stream is its automobile segment, which generated revenue of more than CN¥600 billion in fiscal year 2024. BYD’s mobile handset components segment also generated significant revenue, totaling nearly CN¥160 billion in fiscal year 2024.
The following table shows more detailed results:
Revenue Segment in FY2024:
| Segment | Revenue |
|---|---|
| (CN¥ Billions) | |
| Mobile Handset | ¥159.6 (US$22.2) |
| Automobile | ¥617.4 (US$85.9) |
3-Year Trend from FY2021 to FY2024:
| Segment | Revenue | % Changes |
|---|---|---|
| (CN¥ Billions) | ||
| Mobile Handset | ¥86.5 to ¥159.6 | +84.6% |
| Automobile | ¥129.0 to ¥617.4 | +378.7% |
5-Year Trend from FY2019 to FY2024:
| Segment | Revenue | % Changes |
|---|---|---|
| (CN¥ Billions) | ||
| Mobile Handset | ¥52.5 to ¥159.6 | +203.9% |
| Automobile | ¥69.3 to ¥617.4 | +791.5% |
Revenue from Mobile Handset Components and Automobiles Segments in Percentage
byd-revenue-by-segment-in-percentage
(click image to expand)
BYD uses the Renminbi (RMB), also known as the Chinese Yuan (CNY), for its financial transactions and reporting. The exchange rate of the Chinese Yuan to USD is available here: Yuan to USD conversion.
BYD’s businesses consist of two major segments: automobiles and mobile handset components. The definitions of BYD’s segments are available here: automobiles and mobile handset components.
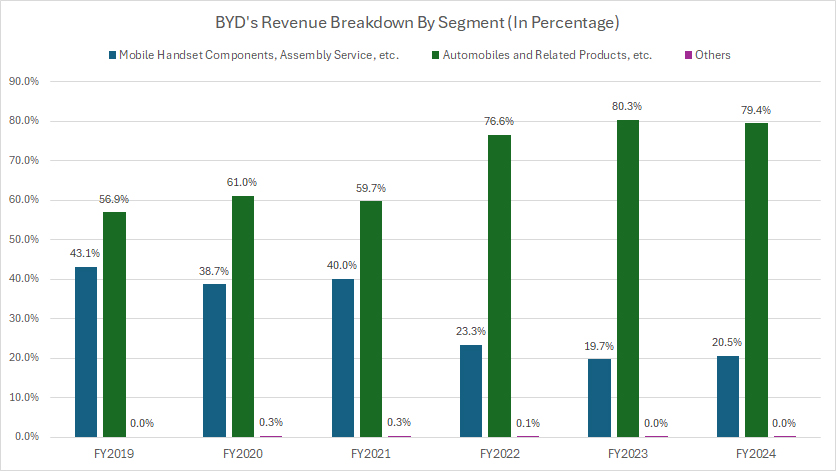
BYD’s automobiles segment’s share of total revenue surged to a record high of 79% in fiscal year 2024. Meanwhile, the mobile handset components segment’s revenue share declined to only 20.5% in the same period.
This trend highlights the much faster revenue growth in the automobiles division compared to the mobile handset components sector.
The following table shows more detailed results:
Revenue Segment in FY2024:
| Segment | Revenue Share (%) |
|---|---|
| Mobile Handset | 20.5% |
| Automobile | 79.4% |
3-Year Trend from FY2021 to FY2024:
| Segment | Revenue Share (%) | % Point Changes |
|---|---|---|
| Mobile Handset | 30.0% to 20.5% | -19.5% |
| Automobile | 59.7% to 79.4% | +19.8% |
5-Year Trend from FY2019 to FY2024:
| Segment | Revenue Share (%) | % Point Changes |
|---|---|---|
| Mobile Handset | 43.1% to 20.5% | -22.6% |
| Automobile | 56.9% to 79.4% | +22.6% |
Mobile Handset Components and Automobiles Revenue Growth
byd-yoy-revenue-growth
(click image to expand)
BYD uses the Renminbi (RMB), also known as the Chinese Yuan (CNY), for its financial transactions and reporting. The exchange rate of the Chinese Yuan to USD is available here: Yuan to USD conversion.
BYD’s businesses consist of two major segments: automobiles and mobile handset components. The definitions of BYD’s segments are available here: automobiles and mobile handset components.
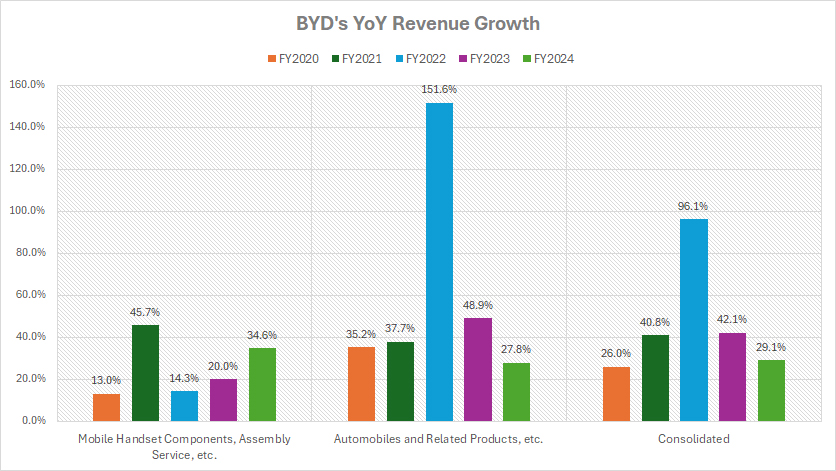
BYD’s automobiles segment has experienced a much faster revenue growth compared to the mobile handset components segment, as shown in the graph above.
The following table shows more detailed results:
Growth Rates in FY2024:
| Segment | Growth Rates (%) |
|---|---|
| Mobile Handset | +34.6% |
| Automobile | +27.8% |
| Consolidated | +29.1% |
3-Year Average Growth Rate from FY2022 to FY2024:
| Segment | Growth Rates (%) |
|---|---|
| Mobile Handset | +23.0% |
| Automobile | +76.1% |
| Consolidated | +55.7% |
5-Year Average Growth Rates from FY2020 to FY2024:
| Segment | Growth Rates (%) |
|---|---|
| Mobile Handset | +25.5% |
| Automobile | +60.2% |
| Consolidated | +46.8% |
Insight
BYD’s growing concentration of revenue in the automobile segment suggests an increasing dependency on the EV industry.
While this positions BYD well for continued expansion in the global transition to electrification, it also exposes the company to risks associated with market fluctuations, changing regulations, and intensifying competition from both established automakers and new entrants.
To sustain long-term growth, BYD may need to diversify its revenue streams further, ensuring that its mobile handset components business remains relevant and strategically positioned for future opportunities.
References and Credits
1. All financial figures presented were obtained and referenced from BYD’s quarterly and annual reports published on the company’s investors relations page: BYD Investors Relation.
2. Pexels Images.
Disclosure
We may use artificial intelligence (AI) tools to assist us in writing some of the text in this article. However, the data is directly obtained from original sources and meticulously cross-checked by our editors multiple times to ensure its accuracy and reliability.
If you find the information in this article helpful, please consider sharing it on social media. Additionally, providing a link back to this article from any website can help us create more content like this in the future.
Thank you for your support and engagement! Your involvement helps us continue to provide high-quality, reliable content.


