14 Wall Street. Source: Flickr
Why I think Meta will be paying cash dividends soon.
Meta Platforms (META) is one of the biggest players in the social media space.
Meta owns the popular Facebook which has a Monthly Active Users (MAU) of nearly 3 billion people as of Q4 2022.
This figure is insane considering that around one-third of the world’s total population hops on the social media platform at least once a month.
Mind you, this figure has not even included the data from Whatsapp and Instagram, other popular social media platforms also owned by Meta.
Despite the popularity of its social media platforms and the profits that they generate, Meta has never paid a cash dividend since its IPO in May 2012.
Here is a quote extracted from Meta’s 2022 annual report regarding its dividend policy:
-
Dividend Policy
We have never declared or paid any cash dividend on our common stock.We intend to retain any future earnings to finance the operation and expansion of our business and fund our share repurchase program, and we do not expect to pay cash dividends in the foreseeable future.
Therefore, Meta has not been paying a cash dividend.
Investors who have bought or are planning to buy Meta’s common stocks can only gain from the price appreciation of the common stocks.
However, this may change in the future and I think that Meta will soon be a credible dividend-paying stock.
The earliest that this may happen is 2023.
Here is why.
Meta Cash Dividend Topics
1. Facebook User Engagement
2. Profitability
3. Cash Flow
4. Leverage
5. Stock Buyback
6. 2023 Outlook
7. Potential Dividend Rate And Yield
8. Conclusion
9. References and Credits
10. Disclosure
Facebook User Engagement
META user metrics
Let’s talk about Meta’s largest, most popular, and most profitable social media platform, Facebook.
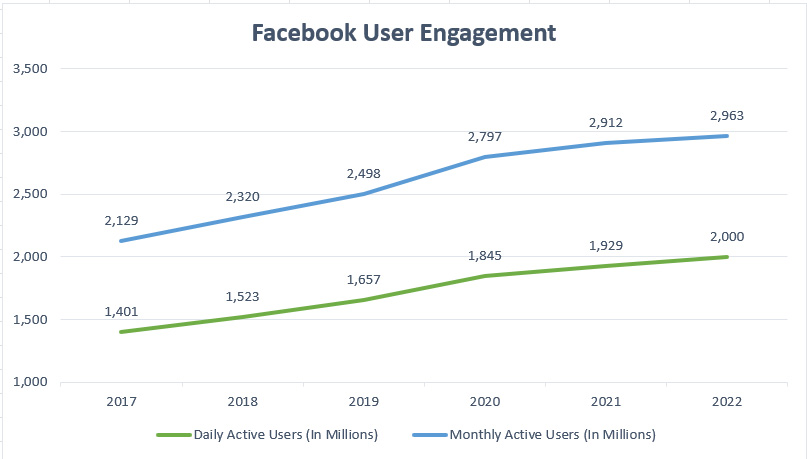
Despite the talk of the downfall of Facebook all these years and the rise of other social media platforms such as TikTok, Facebook’s user engagement is still on the rise as shown in the chart above.
As seen, Facebook MAU and DAU figures have increased by a minimum of 40% each since 2017 and reached new highs as of 2022.
For example, Facebook’s monthly active users topped nearly 3 billion while daily active users totaled 2 billion as of Q4 2022.
What these figures mean is that out of the world’s population of 8 billion people, about one-third of the world’s total engages Facebook at least once a month while one-fourth of the world’s total engages Facebook on a daily basis.
These figures are insane and were the largest among Twitter, Pinterest, Weibo, and Snapchat.
Therefore, Facebook was still the most-used social media platform as of Q4 2022.
Of course, the higher the user engagement, the more money Facebook will make as reflected in the Average Revenue Per User (ARPU).
In short, Facebook has a steady stream of users and they contribute stable advertising revenue to the parent company, Meta.
Therefore, Facebook’s rising user engagement coupled with the huge as well as stable user pool makes the case for a cash dividend coming from Meta very promising and highly likely.
Meta’s Profitability
META profitability metrics
Meta is not just a profitable company but an insanely profitable one.
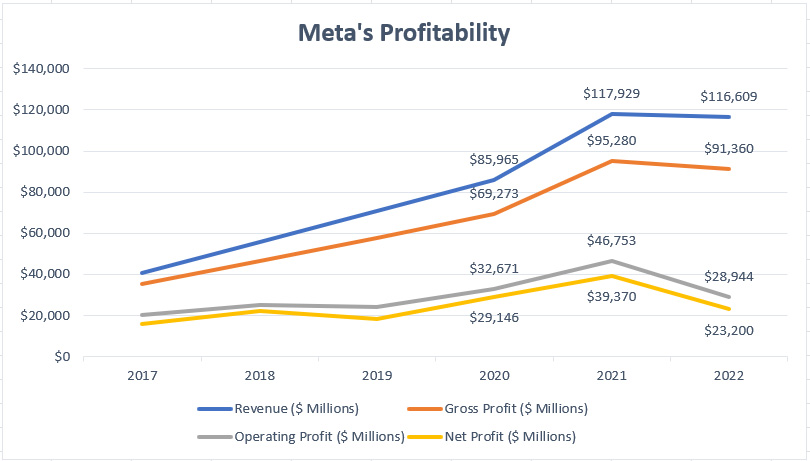
As seen in the chart above, Meta made $90 billion in gross profit in 2022 out of $117 billion in revenue, giving the company a gross margin close to 80%.
Also, Meta’s gross profit has been on a rise since 2017 and topped record highs in the last 3 years.
Far from over, Meta’s operating profit averaged $36 billion between 2020 and 2022 while net profit averaged $30 billion in the same period.
Margin-wise, Meta’s operating margin averaged 34% while its net margin came in at 29% in the last 3 years on average.
These ratios were the best in the industry and Meta has been the most profitable company in so many years among Twitter, Pinterest, and Snapchat, according to this article – Meta Profit And Margin Vs Pins, Snap Inc., and Twitter.
As dividends come from profit and cash, Meta Platforms’ insane profitability can definitely afford the cash dividends.
Meta’s Cash Flow
META cash flow metrics
In addition, Meta is not only an insanely profitable company but also one that produces enormous cash.
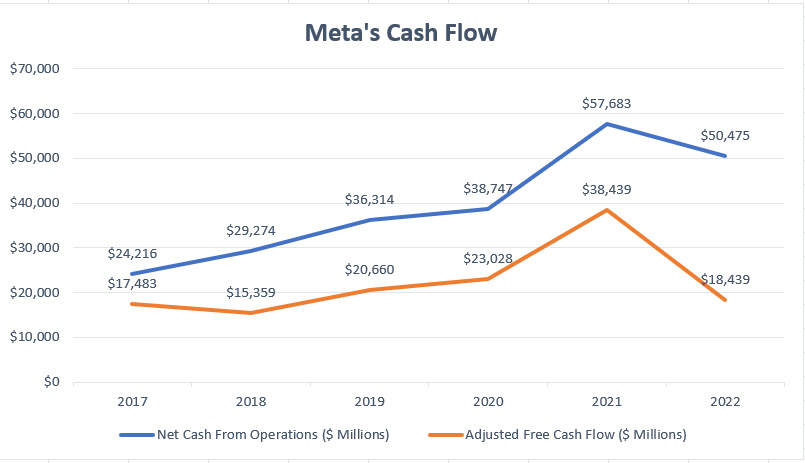
As shown in the chart above, Meta’s net cash from operations averaged $49 billion in the last 3 years while adjusted free cash flow topped $27 billion since 2020 on average.
Margin-wise, these figures provide an operating net cash margin and adjusted free cash flow margin of 46% and 25%, respectively, between 2020 and 2022 on average.
Again, these ratios were the best in the industry, and compared to Twitter, Pinterest, and Snap Inc., Meta’s cash flow margins sit at the top of the chart, according to this article – Meta Free Cash Flow Vs Pins, Snap, and Twitter.
As cash dividends come mainly from cash flow, Meta Platforms’ huge cash flow should provide the company with enough resources to pay out the dividends.
Meta’s Leverage
Meta’s Leverage Metrics As At The End Of The Financial Year
| As at 31 December | |||
|---|---|---|---|
| 2022 | 2021 | 2020 | |
| Total Debt ($ Millions) | $9,923 | $0 | $0 |
| Net Debt ($ Millions) | -$31,730 | -$47,998 | -$61,954 |
| Debt To Equity Ratio (%) | 7.9% | 0% | 0% |
| Debt To Asset Ratio (%) | 5.3% | 0% | 0% |
In terms of debt and liabilities, Meta is minimally leveraged.
Meta has only taken on long-term debt as of 2022, reportedly at $10 billion USD as shown in the table above.
Prior to 2022, Meta had been debt-free as shown in the net debt section.
While Meta’s long-term debt totaled a massive $10 billion as of 2022, it was barely leveraged.
As shown, Meta’s net debt came in at -$32 billion as of 2022, illustrating the greater amount of cash than debt.
Apart from that, Meta’s debt-to-equity ratio totaled only 8% in 2022 while the debt-to-asset ratio came in at only 5% in the same fiscal year.
These ratios were some of the lowest among Twitter, Pinterest, and Snapchat, according to this article – Meta Debt Vs Twitter, Pinterest, And Snap.
Therefore, Meta’s debt barely makes any difference to the company’s leverage.
From the perspective of dividends, Meta’s bare-minimum leverage should not deter the company from becoming a dividend-paying stock.
Meta’s Share Buyback
META share buybacks
Meta will not hesitate to return capital to shareholders.
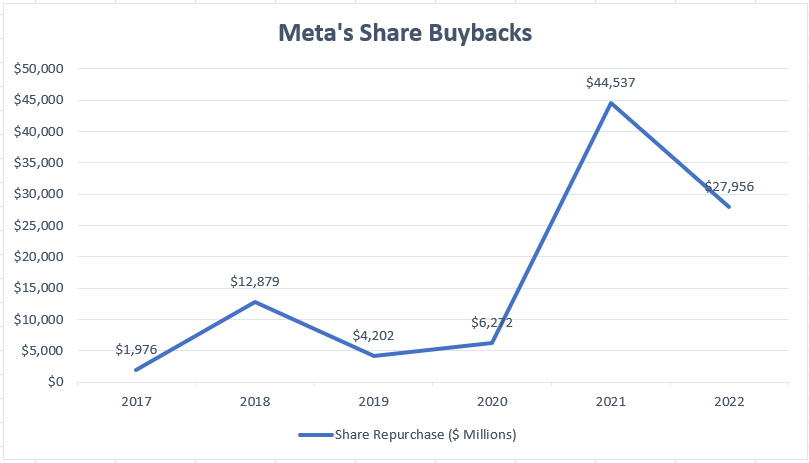
As seen in the chart above, Meta has been buying back shares since 2017, at an average rate of $26 billion annually.
Far from over, Meta’s share repurchase program will continue into the future until the remaining amount of nearly $11 billion is used up.
Moreover, Meta added an additional stock repurchase amount of $40 billion in Jan 2023 which does not have an expiration date.
Therefore, as of Jan 2023, Meta’s unused amount of share buyback totaled a massive $51 billion.
Imagine if Meta channeled this amount into cash dividends.
If Meta can spend an average of $26 billion on stock buybacks, it can definitely afford a cash dividend.
The cash dividends do not have to be as big as the share repurchase amount.
For example, a declaration of $5 billion in cash dividends alone will translate to approximately $1.90 USD in dividends per share or 1% in dividend yield for a stock price of $170 USD.
If you had bought Meta’s stock price at a lower rate, like $120 USD per share, your dividend yield may come to 1.6%.
Imagine if Meta declared a massive $26 billion in cash dividends.
Your dividend rate will approximately be $10 USD per share or a dividend yield of nearly 6% annually.
Again, Meta has been quite generous in returning capital to stockholders in the form of stock buybacks and may do so in the future in the form of cash dividends.
Meta’s 2023 Outlook
Meta’s 2023 Outlook
| Estimate And Actual Results | ||
|---|---|---|
| 2023 Estimate | 2022 Actual | |
| First Quarter Revenue ($ Billions) | $26 – $28.5 | $28 |
| Total Expenses ($ Billions) | $89 – $95 | $88 |
| Capital Expenditure ($ Billions) | $30 – $33 | $31 |
Meta’s 2023 outlook plays a crucial role in determining whether the company will initiate a cash dividend in 2023.
For example, Meta’s 1Q 2023 revenue estimate is roughly in line with that of 1Q 2022 as shown in the table above.
In terms of total expenses, Meta’s 2023 full-year estimate came in at $89 billion at the lower end and $95 billion at the higher end of the estimate.
Therefore, Meta expects 2023 total expenses to be slightly higher than that of 2022.
For capital expenditure, Meta’s estimate for 2023 was also slightly higher than that of 2022.
Therefore, Meta expects the company to earn a flat revenue while expenses will be slightly higher.
What this means is that Meta’s profitability and cash flow in 2023 will both be slightly lower but not significantly lower.
Despite the lower guidance for 2023, Meta will still be making an insane amount of money.
For example, assuming that Meta’s net margin stayed flat in 2023 at roughly 20%, Meta’s net income will be in the ballpark of $24 billion based on an average revenue estimate of around $122 billion.
In addition, Meta’s net cash from operations is estimated to come in at $53 billion while free cash flow totals $19 billion, assuming a flat cash flow margin in 2023.
As a matter of fact, Meta will still be very much a highly profitable and cash-flow-rich company in 2023 in spite of the lower guidance for 2023.
Therefore, the case of a cash dividend coming from Meta Platforms still holds firmly and looks promising.
Not to mention that Meta had just jacked up its share buybacks amount by a massive $40 billion in 2023.
In short, Meta won’t blindly top up the share buyback without fully knowing its fundamentals.
Potential Dividend Rate And Yield
Meta’s 2023 Dividend Rate And Yield
| Estimate And Actual Results | ||
|---|---|---|
| 2023 Estimate | 2022 Actual | |
| Annual Revenue ($ Billions) | $122 | $117 |
| Net Profit ($ Billions) | $24 | $23 |
| Net Cash From Operations ($ Billions) | $52 | $50 |
| Adjusted Free Cash Flow ($ Billions) | $19 | $18 |
| Dividends Declared ($ Billions) | $2 | – |
| Dividend To Net Income Payout Ratio (%) | 8% | – |
| Dividend To FCF Payout Ratio (%) | 11% | – |
| Dividend Rate (US$) | $0.80 | – |
| Dividend Yield (%) | 0.5% | – |
As shown in the table above, just a $2 billion cash dividend from Meta would generate a dividend rate of $0.80 USD per share or a dividend yield of 0.5% based on a stock price of $170.
From the perspective of the payout ratio, a $2 billion dividend declared consumes only 8% of Meta’s 2023 net profit and 11% of Meta’s 2023 free cash flow.
These are very low ratios which show that Meta not only can afford the cash dividends but potentially increase the rate by a very large margin.
Again, Meta is profitable and cash-flow-rich enough for a dividend.
Conclusion
To recap, these are the reasons that Meta will be a credible dividend-paying stock.
First, the huge user pool and the rising user engagement on Facebook provide a steady income for Meta.
Second, Meta makes incredible profits and generates huge cash flow.
Third, Meta is barely leveraged, with a debt-to-equity ratio of only 8% as of 2022 while total debt made up only 5% of its total assets.
Fourth, Meta also has been generous in capital return for its shareholders, giving back an average of $26 billion since 2020 in stock repurchases.
Keep in mind that Meta’s stock repurchases may serve as the basis for a larger capital return in the future which may include a cash dividend.
Therefore, if Meta could spend an average of $26 billion per year buying back its stocks, a $2 billion cash dividend is nothing compared to the size of the share buybacks.
Moreover, Meta guided for an inline 2023 result which will still provide the company with huge profitability and cash flow.
Lastly, Meta is profitable and cash-flow-rich enough to cover a $2 billion or more cash dividend.
While Meta is potentially a cash-paying dividend stock, there is still a slight chance that this will not happen.
For example, a black-swan event like the COVID-19 pandemic will absolutely delay the company from giving a bigger capital return to stockholders.
References and Credits
1. All financial figures in this article were obtained and referenced from financial statements as well as earnings releases which are available in the following links:
a) Meta Investor Relations
b) META – Yahoo Finance
2. Featured images in this article are used under creative commons license and sourced from the following websites: 14 Wall Street and Financial District.
Disclosure
The content in this article is for informational purposes only and is neither a recommendation nor a piece of financial advice to purchase a stock.
If you find the information in this article helpful, please consider sharing it on social media and also provide a link back to this article from any website so that more articles like this one can be created in the future.
Thank you for the help!

