
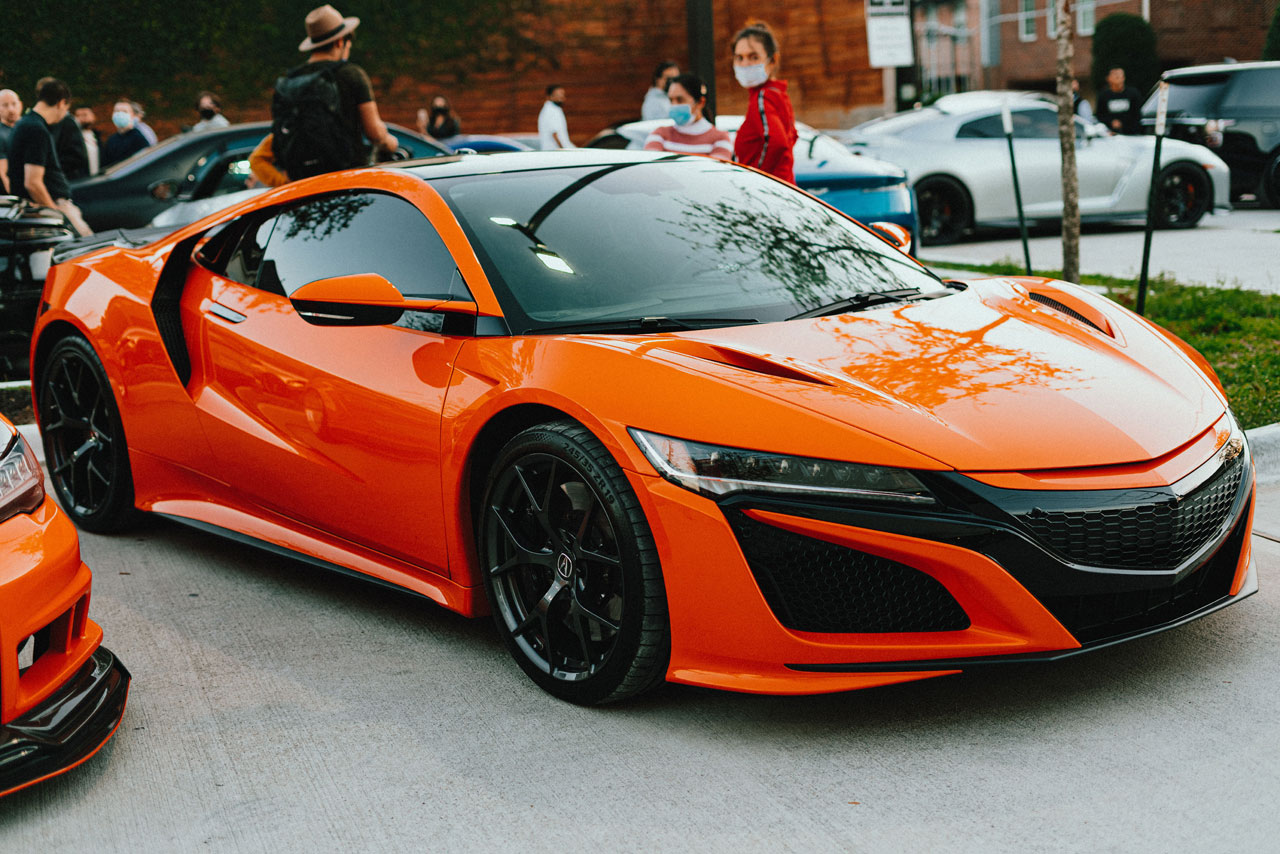
Sports car. Pixabay Image.
This article covers Ferrari’s vehicle sales breakdown by region and country. Ferrari’s vehicle sales span across regions such as EMEA, Americas, Greater China, and Asia Pacific.
Keep in mind that the sale figures presented here represent mostly the wholesale figures in which Ferrari ships its vehicles to dealerships.
Ferrari do deliver directly to the end customer, but only in small numbers and is limted to supercars.
Let’s look at the sales distribution results.
For other key statistics of Ferrari N.V., you may find more resources on this page: Ferrari key stats.
Please use the table of contents to navigate this page.
Table Of Contents
Insight & Summary of Observed Trends
Z1. Insight & Summary of Ferrari’s Vehicle Sales Breakdown By Region and Country
Sales By Region Results
A1. Sales breakdown by region
A2. Sales mix by region
A3. Sales growth by region
Sales By Country Results
B1. Sales breakdown by country
B2. Sales mix by country
B3. Sales growth by country
Reference, Credits, and Disclosure
S1. References and Credits
S2. Disclosure
Insight & Summary of Ferrari’s Sales Breakdown By Region and Country
Ferrari’s total car sales (unit shipments) grew from 7,000 units in FY2013 to 13,640 units in FY2025 — roughly a 1.95x increase, or a ~5.5% compound annual growth rate. Growth was steady through most of the period, interrupted only by the FY2020 pandemic shock (-10.0%), before decelerating sharply in the most recent two years (+0.7% in FY2024, -0.8% in FY2025) — the first outright volume decline since the pandemic. Beneath a broadly stable regional structure, the country-level data shows two distinct stories: a genuine structural rebalancing toward the U.S. and Rest of APAC, and a sharp, recent deterioration in Greater China and the U.K.
-
EMEA — the resilient anchor, gaining share again. Total EMEA has held 43%–53% of shipments in every year of the dataset, the widest swing being a pandemic-era spike to 52.8% (FY2020) as other regions fell faster. After settling into the mid-40s through FY2021–FY2023, EMEA’s mix climbed back to 46.5% by FY2025 — its highest level since the pandemic — even as EMEA unit growth itself slowed to just 2.3% in both FY2024 and FY2025. The gain in relative share, despite flat absolute growth, reflects EMEA’s comparative stability while other regions weakened faster.
-
Americas — a strong recovery now losing momentum. Americas’ mix fell from 34.0% (FY2013) to a low of 25.4% (FY2021) before rebuilding to 28.9% by FY2025, driven by two consecutive +21.8% growth years in FY2021–FY2022. That recovery has since cooled sharply: growth decelerated from +10.6% (FY2023) to +5.0% (FY2024) to -1.6% (FY2025) — the region’s first shipment decline since FY2020. At the country level, the U.S. mix followed the same arc, rising from 21.2% (FY2021) to a peak of 25.1% (FY2024) before slipping to 24.9% (FY2025), confirming the Americas slowdown is concentrated in its largest single market rather than broadly distributed.
-
Greater China — the most persistent source of weakness. Mainland China, Hong Kong and Taiwan’s mix swung from a pandemic low of 5.0% (FY2020) to a post-reopening peak of 11.7% (FY2022, on +97.1% and +72.6% growth in the two prior years), then fell for three consecutive years (-4.0%, -22.0%, -19.0% in FY2023–FY2025) to just 6.9% by FY2025. Mainland China specifically — isolated from Hong Kong and Taiwan — declined even faster, with its mix nearly halving from a 9.8% peak (FY2022) to 4.3% (FY2025) on growth of -5.3%, -33.3%, and -28.3% in the same three years. This is the steepest and most sustained regional contraction anywhere in the dataset.
-
Rest of APAC — the only unbroken growth streak. Rest of APAC is the sole segment with positive shipment growth in every single year from FY2014 through FY2025, expanding its mix from 10.5% to 17.7% — now larger than Greater China’s share for the first time in the dataset’s history. This marks a structural shift in Ferrari’s Asia-Pacific base: demand has broadened well beyond Mainland China, Hong Kong and Taiwan even as that core market has weakened.
-
U.K. — the standout outlier. After holding a stable 9.6%–11.1% mix through FY2013–FY2020, U.K. shipments have fallen in four of the last five years, capped by a -38.8% collapse in FY2025 alone — the single largest one-year decline of any country or region in the entire dataset. The U.K.’s mix has been cut by more than half, from 8.9% (FY2021) to just 4.2% (FY2025), making it the clearest country-level red flag in an otherwise resilient European base.
-
Italy, Middle East and Other EMEA — pockets of re-acceleration. Italy’s home-market mix has nearly doubled since FY2013 (2.9% to 6.6%) and re-accelerated in FY2024–FY2025 (+7.7%, +12.8%). Middle East swung from a -24.6% trough (FY2017) to +30.7% growth (FY2025), lifting its mix back to 4.6% — its highest since FY2014. Other EMEA (the broad secondary-market basket) has grown its mix from 9.5% to 12.2% over the period, the fastest-growing segment within EMEA and a sign of geographic diversification beyond Ferrari’s core markets.
-
Structural Takeaway: Structurally, Ferrari’s volume base has diversified: EMEA remains the stable core, the U.S. has become the dominant single country market, and Rest of APAC has overtaken Greater China as the larger Asia-Pacific contributor. The notable changing trend is a broad-based deceleration setting in in FY2024–FY2025 — Americas, EMEA, and Total Car Sales all posted their weakest growth of the recovery era, with Total Car Sales turning negative in FY2025 for the first time since the pandemic. Two markets are driving this disproportionately: Greater China’s three-year losing streak and the U.K.’s sudden FY2025 collapse. If both continue into FY2026, offsetting growth will need to come from Rest of APAC’s steady compounding and a stabilization in the U.S. and EMEA — making China and U.K. trajectories the key swing factors for Ferrari’s near-term unit volume growth.
The table below combines all key Ferrari’s regional car shipment volumes into a single view for the latest three fiscal years.
Ferrari's Car Sales by Region and Country — Averages (FY2023–FY2025)
| Metric | 3-Year Average (FY2023–FY2025) |
|---|---|
| Car Sales Breakdown by Region | |
| EMEA | 6,204 cars |
| Americas | 3,917 cars |
| Mainland China, Hong Kong and Taiwan | 1,198 cars |
| Rest of APAC | 2,366 cars |
| Total Car Sales | 13,685 cars |
| Car Sales Mix by Region | |
| EMEA | 45.3% |
| Americas | 28.6% |
| Mainland China, Hong Kong and Taiwan | 8.7% |
| Rest of APAC | 17.3% |
| Car Sales Growth by Region | |
| EMEA | 2.1% |
| Americas | 4.7% |
| Mainland China, Hong Kong and Taiwan | -15.0% |
| Rest of APAC | 2.2% |
| Total Car Sales | 1.1% |
| Car Sales Breakdown by Country | |
| Germany | 1,476 cars |
| Italy | 812 cars |
| France | 545 cars |
| U.K. | 838 cars |
| Switzerland | 490 cars |
| Middle East | 519 cars |
| Other EMEA | 1,524 cars |
| U.S. | 3,372 cars |
| Mainland China | 873 cars |
| Car Sales Mix by Country | |
| Germany | 10.8% |
| Italy | 5.9% |
| France | 4.0% |
| U.K. | 6.1% |
| Switzerland | 3.6% |
| Middle East | 3.8% |
| Other EMEA | 11.1% |
| U.S. | 24.6% |
| Mainland China | 6.4% |
| Car Sales Growth by Country | |
| Germany | 1.0% |
| Italy | 8.3% |
| France | 8.2% |
| U.K. | -15.0% |
| Switzerland | 0.7% |
| Middle East | 13.2% |
| Other EMEA | 5.9% |
| U.S. | 5.3% |
| Mainland China | -22.3% |
Averages cover FY2023–FY2025. Unit figures rounded to nearest whole car. Mix and growth rounded to one decimal place. Country-level figures are subsets of the broader regional totals and are not separately additive to Total Car Sales.
Sales breakdown by region
View data as table
Ferrari Car Sales Breakdown by Region — All Metrics by Fiscal Year
| Fiscal Year | EMEA | Americas | Mainland China, Hong Kong and Taiwan | Rest of APAC | Total Car Sales |
|---|---|---|---|---|---|
| 2013 | 3,309 cars | 2,382 cars | 572 cars | 737 cars | 7,000 cars |
| 2014 | 3,274 cars | 2,462 cars | 675 cars | 844 cars | 7,255 cars |
| 2015 | 3,351 cars | 2,640 cars | 610 cars | 1,063 cars | 7,664 cars |
| 2016 | 3,610 cars | 2,687 cars | 619 cars | 1,098 cars | 8,014 cars |
| 2017 | 3,737 cars | 2,811 cars | 617 cars | 1,233 cars | 8,398 cars |
| 2018 | 4,227 cars | 3,000 cars | 695 cars | 1,329 cars | 9,251 cars |
| 2019 | 4,895 cars | 2,900 cars | 836 cars | 1,500 cars | 10,131 cars |
| 2020 | 4,818 cars | 2,325 cars | 456 cars | 1,520 cars | 9,119 cars |
| 2021 | 5,492 cars | 2,831 cars | 899 cars | 1,933 cars | 11,155 cars |
| 2022 | 5,958 cars | 3,447 cars | 1,552 cars | 2,264 cars | 13,221 cars |
| 2023 | 6,063 cars | 3,811 cars | 1,490 cars | 2,299 cars | 13,663 cars |
| 2024 | 6,204 cars | 4,003 cars | 1,162 cars | 2,383 cars | 13,752 cars |
| 2025 | 6,346 cars | 3,937 cars | 941 cars | 2,416 cars | 13,640 cars |
Car Sales Breakdown by Region — Averages (FY2023–FY2025)
| Metric | 3-Year Average (FY2023–FY2025) |
|---|---|
| EMEA | 6,204 cars |
| Americas | 3,917 cars |
| Mainland China, Hong Kong and Taiwan | 1,198 cars |
| Rest of APAC | 2,366 cars |
| Total Car Sales | 13,685 cars |
Averages cover FY2023–FY2025. Unit figures rounded to nearest whole car.
Sales mix by region
View data as table
Ferrari Car Sales Mix by Region — All Metrics by Fiscal Year
| Fiscal Year | EMEA | Americas | Mainland China, Hong Kong and Taiwan | Rest of APAC |
|---|---|---|---|---|
| 2013 | 47.3% | 34.0% | 8.2% | 10.5% |
| 2014 | 45.1% | 33.9% | 9.3% | 11.6% |
| 2015 | 43.7% | 34.4% | 8.0% | 13.9% |
| 2016 | 45.0% | 33.5% | 7.7% | 13.7% |
| 2017 | 44.5% | 33.5% | 7.3% | 14.7% |
| 2018 | 45.7% | 32.4% | 7.5% | 14.4% |
| 2019 | 48.3% | 28.6% | 8.3% | 14.8% |
| 2020 | 52.8% | 25.5% | 5.0% | 16.7% |
| 2021 | 49.2% | 25.4% | 8.1% | 17.3% |
| 2022 | 45.1% | 26.1% | 11.7% | 17.1% |
| 2023 | 44.4% | 27.9% | 10.9% | 16.8% |
| 2024 | 45.1% | 29.1% | 8.4% | 17.3% |
| 2025 | 46.5% | 28.9% | 6.9% | 17.7% |
Car Sales Mix by Region — Averages (FY2023–FY2025)
| Metric | 3-Year Average (FY2023–FY2025) |
|---|---|
| EMEA | 45.3% |
| Americas | 28.6% |
| Mainland China, Hong Kong and Taiwan | 8.7% |
| Rest of APAC | 17.3% |
Averages cover FY2023–FY2025. Mix rounded to one decimal place.
Sales growth by region
View data as table
Ferrari Car Sales Growth by Region — All Metrics by Fiscal Year
| Fiscal Year | EMEA | Americas | Mainland China, Hong Kong and Taiwan | Rest of APAC | Total Car Sales |
|---|---|---|---|---|---|
| 2014 | -1.1% | 3.4% | 18.0% | 14.5% | 3.6% |
| 2015 | 2.4% | 7.2% | -9.6% | 25.9% | 5.6% |
| 2016 | 7.7% | 1.8% | 1.5% | 3.3% | 4.6% |
| 2017 | 3.5% | 4.6% | -0.3% | 12.3% | 4.8% |
| 2018 | 13.1% | 6.7% | 12.6% | 7.8% | 10.2% |
| 2019 | 15.8% | -3.3% | 20.3% | 12.9% | 9.5% |
| 2020 | -1.6% | -19.8% | -45.5% | 1.3% | -10.0% |
| 2021 | 14.0% | 21.8% | 97.1% | 27.2% | 22.3% |
| 2022 | 8.5% | 21.8% | 72.6% | 17.1% | 18.5% |
| 2023 | 1.8% | 10.6% | -4.0% | 1.5% | 3.3% |
| 2024 | 2.3% | 5.0% | -22.0% | 3.7% | 0.7% |
| 2025 | 2.3% | -1.6% | -19.0% | 1.4% | -0.8% |
Car Sales Growth by Region — Averages (FY2023–FY2025)
| Metric | 3-Year Average (FY2023–FY2025) |
|---|---|
| EMEA | 2.1% |
| Americas | 4.7% |
| Mainland China, Hong Kong and Taiwan | -15.0% |
| Rest of APAC | 2.2% |
| Total Car Sales | 1.1% |
Averages cover FY2023–FY2025. Growth rounded to one decimal place.
Sales breakdown by country
View data as table
Ferrari Car Sales Breakdown by Country — All Metrics by Fiscal Year
| Fiscal Year | Germany | Italy | France | U.K. | Switzerland | Middle East | Other EMEA | U.S. | Mainland China |
|---|---|---|---|---|---|---|---|---|---|
| 2013 | 659 cars | 206 cars | 273 cars | 686 cars | 350 cars | 472 cars | 663 cars | n.a. | n.a. |
| 2014 | 616 cars | 243 cars | 253 cars | 705 cars | 332 cars | 521 cars | 604 cars | n.a. | n.a. |
| 2015 | 595 cars | 285 cars | 274 cars | 740 cars | 340 cars | 456 cars | 661 cars | n.a. | n.a. |
| 2016 | 675 cars | 364 cars | 306 cars | 769 cars | 333 cars | 439 cars | 724 cars | n.a. | n.a. |
| 2017 | 710 cars | 417 cars | 346 cars | 843 cars | 339 cars | 331 cars | 751 cars | n.a. | n.a. |
| 2018 | 803 cars | 479 cars | 399 cars | 981 cars | 380 cars | 326 cars | 859 cars | n.a. | n.a. |
| 2019 | 967 cars | 559 cars | 452 cars | 1,120 cars | 454 cars | 309 cars | 1,034 cars | n.a. | n.a. |
| 2020 | 995 cars | 574 cars | 463 cars | 971 cars | 456 cars | 304 cars | 1,055 cars | n.a. | n.a. |
| 2021 | 1,252 cars | 668 cars | 473 cars | 996 cars | 481 cars | 334 cars | 1,288 cars | 2,362 cars | 681 cars |
| 2022 | 1,439 cars | 708 cars | 473 cars | 997 cars | 497 cars | 439 cars | 1,405 cars | 2,924 cars | 1,290 cars |
| 2023 | 1,472 cars | 740 cars | 490 cars | 1,011 cars | 482 cars | 451 cars | 1,417 cars | 3,262 cars | 1,221 cars |
| 2024 | 1,476 cars | 797 cars | 547 cars | 933 cars | 481 cars | 479 cars | 1,491 cars | 3,452 cars | 814 cars |
| 2025 | 1,481 cars | 899 cars | 598 cars | 571 cars | 507 cars | 626 cars | 1,664 cars | 3,401 cars | 584 cars |
Car Sales Breakdown by Country — Averages (FY2023–FY2025)
| Metric | 3-Year Average (FY2023–FY2025) |
|---|---|
| Germany | 1,476 cars |
| Italy | 812 cars |
| France | 545 cars |
| U.K. | 838 cars |
| Switzerland | 490 cars |
| Middle East | 519 cars |
| Other EMEA | 1,524 cars |
| U.S. | 3,372 cars |
| Mainland China | 873 cars |
Averages cover FY2023–FY2025. Unit figures rounded to nearest whole car.
Sales mix by country
View data as table
Ferrari Car Sales Mix by Country — All Metrics by Fiscal Year
| Fiscal Year | Germany | Italy | France | U.K. | Switzerland | Middle East | Other EMEA | U.S. | Mainland China |
|---|---|---|---|---|---|---|---|---|---|
| 2013 | 9.4% | 2.9% | 3.9% | 9.8% | 5.0% | 6.7% | 9.5% | n.a. | n.a. |
| 2014 | 8.5% | 3.3% | 3.5% | 9.7% | 4.6% | 7.2% | 8.3% | n.a. | n.a. |
| 2015 | 7.8% | 3.7% | 3.6% | 9.7% | 4.4% | 5.9% | 8.6% | n.a. | n.a. |
| 2016 | 8.4% | 4.5% | 3.8% | 9.6% | 4.2% | 5.5% | 9.0% | n.a. | n.a. |
| 2017 | 8.5% | 5.0% | 4.1% | 10.0% | 4.0% | 3.9% | 8.9% | n.a. | n.a. |
| 2018 | 8.7% | 5.2% | 4.3% | 10.6% | 4.1% | 3.5% | 9.3% | n.a. | n.a. |
| 2019 | 9.5% | 5.5% | 4.5% | 11.1% | 4.5% | 3.1% | 10.2% | n.a. | n.a. |
| 2020 | 10.9% | 6.3% | 5.1% | 10.6% | 5.0% | 3.3% | 11.6% | n.a. | n.a. |
| 2021 | 11.2% | 6.0% | 4.2% | 8.9% | 4.3% | 3.0% | 11.5% | 21.2% | 6.1% |
| 2022 | 10.9% | 5.4% | 3.6% | 7.5% | 3.8% | 3.3% | 10.6% | 22.1% | 9.8% |
| 2023 | 10.8% | 5.4% | 3.6% | 7.4% | 3.5% | 3.3% | 10.4% | 23.9% | 8.9% |
| 2024 | 10.7% | 5.8% | 4.0% | 6.8% | 3.5% | 3.5% | 10.8% | 25.1% | 5.9% |
| 2025 | 10.9% | 6.6% | 4.4% | 4.2% | 3.7% | 4.6% | 12.2% | 24.9% | 4.3% |
Car Sales Mix by Country — Averages (FY2023–FY2025)
| Metric | 3-Year Average (FY2023–FY2025) |
|---|---|
| Germany | 10.8% |
| Italy | 5.9% |
| France | 4.0% |
| U.K. | 6.1% |
| Switzerland | 3.6% |
| Middle East | 3.8% |
| Other EMEA | 11.1% |
| U.S. | 24.6% |
| Mainland China | 6.4% |
Averages cover FY2023–FY2025. Mix rounded to one decimal place.
Sales growth by country
View data as table
Ferrari Car Sales Growth by Country — All Metrics by Fiscal Year
| Fiscal Year | Germany | Italy | France | U.K. | Switzerland | Middle East | Other EMEA | U.S. | Mainland China |
|---|---|---|---|---|---|---|---|---|---|
| 2014 | -6.5% | 18.0% | -7.3% | 2.8% | -5.1% | 10.4% | -8.9% | n.a. | n.a. |
| 2015 | -3.4% | 17.3% | 8.3% | 5.0% | 2.4% | -12.5% | 9.4% | n.a. | n.a. |
| 2016 | 13.4% | 27.7% | 11.7% | 3.9% | -2.1% | -3.7% | 9.5% | n.a. | n.a. |
| 2017 | 5.2% | 14.6% | 13.1% | 9.6% | 1.8% | -24.6% | 3.7% | n.a. | n.a. |
| 2018 | 13.1% | 14.9% | 15.3% | 16.4% | 12.1% | -1.5% | 14.4% | n.a. | n.a. |
| 2019 | 20.4% | 16.7% | 13.3% | 14.2% | 19.5% | -5.2% | 20.4% | n.a. | n.a. |
| 2020 | 2.9% | 2.7% | 2.4% | -13.3% | 0.4% | -1.6% | 2.0% | n.a. | n.a. |
| 2021 | 25.8% | 16.4% | 2.2% | 2.6% | 5.5% | 9.9% | 22.1% | n.a. | n.a. |
| 2022 | 14.9% | 6.0% | 0.0% | 0.1% | 3.3% | 31.4% | 9.1% | 23.8% | 89.4% |
| 2023 | 2.3% | 4.5% | 3.6% | 1.4% | -3.0% | 2.7% | 0.9% | 11.6% | -5.3% |
| 2024 | 0.3% | 7.7% | 11.6% | -7.7% | -0.2% | 6.2% | 5.2% | 5.8% | -33.3% |
| 2025 | 0.3% | 12.8% | 9.3% | -38.8% | 5.4% | 30.7% | 11.6% | -1.5% | -28.3% |
Car Sales Growth by Country — Averages (FY2023–FY2025)
| Metric | 3-Year Average (FY2023–FY2025) |
|---|---|
| Germany | 1.0% |
| Italy | 8.3% |
| France | 8.2% |
| U.K. | -15.0% |
| Switzerland | 0.7% |
| Middle East | 13.2% |
| Other EMEA | 5.9% |
| U.S. | 5.3% |
| Mainland China | -22.3% |
Averages cover FY2023–FY2025. Growth rounded to one decimal place.
References and Credits
1. All financial figures presented were obtained and referenced from Ferrari N.V.’s annual and quarterly filings, which are available in Ferrari investor relations.
2. Pexels images.
Back To Table Of Contents
Disclosure
We may use artificial intelligence (AI) tools to assist us in writing some of the text in this article. However, the data is directly obtained from original sources (usually the quarterly and annual reports) and meticulously cross-checked by our editors multiple times to ensure its accuracy and reliability.
If you find the information in this article helpful, please consider sharing it on social media. Additionally, providing a link back to this article from any website can help us create more content like this in the future.
Thank you for your support and engagement! Your involvement helps us continue to provide high-quality, reliable content.