
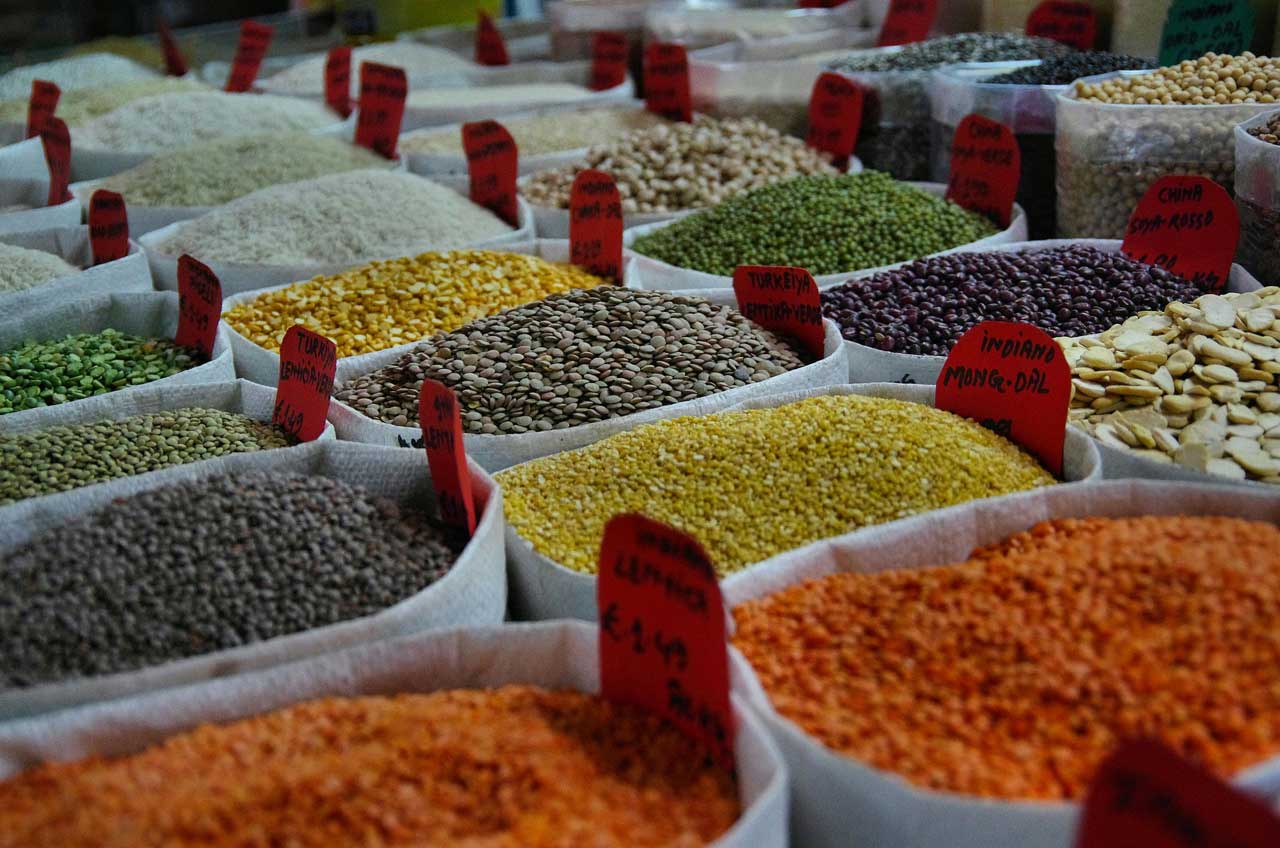
Dried foods. Pexels Images.
This article covers Costco’s revenue breakdown by segment. Costco derives its revenue from several business divisions, including foods and sundries, non-foods, fresh foods, warehouse ancillary and other businesses.
You may find more information about Costco’s business segments here: foods and sundries, non-foods, fresh foods, warehouse ancillary, and other businesses.
For other key statistics of Costco, you may find more resources on this page: Costco key stats.
Let’s look at the revenue breakdown!
Please use the table of contents to navigate this page.
Table Of Contents
Definitions And Overview
O2. Why is Costco getting the majority of its revenue from the Foods and Sundries segment?
Insight & Summary of Observed Trends
Z1. Insight & Summary of Costco’s Revenue by Merchandise Category
Merchandise Sales Results
A1. Sales breakdown by merchandise category
A2. Sales mix by merchandise category
A3. Sales growth by merchandise category
Reference, Credits, and Disclosure
S1. References and Credits
S2. Disclosure
Definitions Of Segments
To help readers understand the content better, the following terms and glossaries have been provided.
Foods and Sundries: Costco’s Foods and Sundries segment includes sales of sundries, dry grocery, candy, cooler, freezer, deli, liquor, and tobacco.
Non-Foods: Costco’s Non-Foods segment includes sales of major appliances, small electronics, health and beauty aids, hardware, lawn and garden, sporting goods, tires, toys and seasonal, office supplies, automotive, stamps, tickets, apparel, furniture, domestics, housewares, special order kiosk, and jewelry.
Fresh Foods: Costco’s Fresh Foods segment includes sales of meat, produce, service deli, and bakery.
Warehouse Ancillary: Costco’s Warehouse Ancillary segment includes sales of gasoline, pharmacy, optical, food court, hearing aids, and tire installation.
Other Businesses: Costco’s Other Businesses segment includes sales from e-commerce, business centers, travel, and other.
Why is Costco getting the majority of its revenue from the Foods and Sundries segment?
Costco’s Foods and Sundries segment is a major revenue driver for several reasons:
- High Demand for Essentials: This segment includes everyday essentials like packaged foods, snacks, beverages, and household items, which are consistently in high demand. These products are staples in most households, ensuring steady sales.
- Competitive Pricing: Costco’s business model focuses on offering high-quality products at competitive prices. This attracts a large customer base looking for value, especially in the Foods and Sundries segment where price sensitivity is high.
- Bulk Sales: Costco’s strategy of selling products in bulk quantities appeals to customers who want to save money by buying in larger volumes. This is particularly effective for non-perishable items in the Foods and Sundries segment.
- Private Label Success: The Kirkland Signature brand, Costco’s private label, is known for its quality and value. Many products in the Foods and Sundries segment are sold under this brand, boosting sales and customer loyalty.
- Membership Model: Costco’s membership model encourages repeat purchases. Members are more likely to shop frequently to maximize the value of their membership, leading to higher sales in essential categories like Foods and Sundries.
- Wide Product Range: The Foods and Sundries segment covers a broad range of products, catering to diverse customer needs and preferences. This variety helps attract a wide customer base.
These factors combined make the Foods and Sundries segment a cornerstone of Costco’s revenue generation strategy.
Insight & Summary of Costco’s Revenue by Merchandise Category
The following analysis consolidates the trends observed across Costco’s merchandise sales revenue by category for the 2016–2025 period.
-
Costco’s merchandise portfolio demonstrates a highly resilient, defensive structural mix optimized for continuous foot traffic and volume leverage.
-
Foods & Sundries remains the foundational bedrock of the business, accounting for 40.6% of the revenue mix and generating an average of $102,401 million annually over the last three periods.
-
This category’s steady 8.6% average growth over the same timeframe highlights Costco’s pricing authority and its ability to capture market share in non-discretionary consumables, even amid fluctuating macro environments.
-
Fresh Foods complements this core perfectly, driving frequency with a consistent 13.8% mix and a robust 8.8% three-year average growth rate.
-
Conversely, the Non-Foods segment serves as a critical margin enhancer and discretionary growth lever. Representing 25.9% of the mix, it experienced higher cyclicality — contracting by 0.4% in 2023 before rebounding sharply to 11.3% growth in 2025 — yielding an average growth rate of 5.3%.
-
Meanwhile, Warehouse Ancillary & Others (heavily weighted by fuel sales) stabilized at a 19.8% mix with a muted 3.3% average growth, largely reflecting a normalization in fuel pricing after preceding hyper-inflationary spikes.
-
Ultimately, this blended category architecture successfully insulated the broader topline, allowing Costco to sustain an impressive consolidated net sales average of $252,416 million with an aggregate 6.6% growth rate across the latest three periods (2023-2025).
The table below combines all Costco’s merchandise sales revenue metrics into a single view for the latest three fiscal years.
Costco’s Revenue Breakdown by Merchandise Category — Averages (FY2023–FY2025)
| Metric | 3-Year Average (FY2023–FY2025) |
|---|---|
| Merchandise Sales Breakdown by Category | |
| Foods & Sundries | $102,401M |
| Non-Foods | $65,343M |
| Fresh Foods | $34,728M |
| Warehouse Ancillary and Other Businesses | $49,944M |
| Total Merchandise Sales | $252,416M |
| Merchandise Sales Mix by Category | |
| Foods & Sundries | 40.6% |
| Non-Foods | 25.9% |
| Fresh Foods | 13.8% |
| Warehouse Ancillary and Other Businesses | 19.8% |
| Total Merchandise Sales | 100.0% |
| Merchandise Sales Growth by Category | |
| Foods & Sundries | 8.6% |
| Non-Foods | 5.3% |
| Fresh Foods | 8.8% |
| Warehouse Ancillary and Other Businesses | 3.3% |
| Total Merchandise Sales | 6.6% |
Averages cover FY2023–FY2025. Revenue rounded to nearest whole unit. Mix and growth rounded to one decimal place.
Merchandise sales breakdown by category
View data as table
Costco Merchandise Sales Breakdown by Category — All Metrics by Fiscal Year
| Fiscal Year | Foods & Sundries | Non-Foods | Fresh Foods | Warehouse Ancillary and Other Businesses | Total Merchandise Sales |
|---|---|---|---|---|---|
| 2016 | $49,911M | $32,500M | $16,250M | $17,411M | $116,073M |
| 2017 | $51,731M | $35,328M | $17,664M | $21,449M | $126,172M |
| 2018 | $56,073M | $38,007M | $18,879M | $25,475M | $138,434M |
| 2019 | $59,672M | $41,160M | $19,948M | $28,571M | $149,351M |
| 2020 | $68,659M | $44,807M | $23,204M | $26,550M | $163,220M |
| 2021 | $77,277M | $55,966M | $27,183M | $31,626M | $192,052M |
| 2022 | $85,629M | $61,100M | $29,527M | $46,474M | $222,730M |
| 2023 | $96,175M | $60,865M | $31,977M | $48,693M | $237,710M |
| 2024 | $101,463M | $63,973M | $34,220M | $49,969M | $249,625M |
| 2025 | $109,564M | $71,190M | $37,988M | $51,170M | $269,912M |
Costco’s merchandise revenue consists of sales from several categories. The definitions of these merchandise revenue segments are available here: Foods & Sundries, Non-Foods, Fresh Foods, Warehouse Ancillary, and Other Businesses.
Merchandise Sales Breakdown by Category — Averages (FY2023–FY2025)
| Metric | 3-Year Average (FY2023–FY2025) |
|---|---|
| Foods & Sundries | $102,401M |
| Non-Foods | $65,343M |
| Fresh Foods | $34,728M |
| Warehouse Ancillary and Other Businesses | $49,944M |
| Total Merchandise Sales | $252,416M |
Averages cover FY2023–FY2025. Revenue rounded to nearest whole unit. Mix and growth rounded to one decimal place.
Merchandise sales mix by category
View data as table
Costco Merchandise Sales Mix by Category — All Metrics by Fiscal Year
| Fiscal Year | Foods & Sundries | Non-Foods | Fresh Foods | Warehouse Ancillary and Other Businesses |
|---|---|---|---|---|
| 2016 | 43.0% | 28.0% | 14.0% | 15.0% |
| 2017 | 41.0% | 28.0% | 14.0% | 17.0% |
| 2018 | 40.5% | 27.5% | 13.6% | 18.4% |
| 2019 | 40.0% | 27.6% | 13.4% | 19.1% |
| 2020 | 42.1% | 27.5% | 14.2% | 16.3% |
| 2021 | 40.2% | 29.1% | 14.2% | 16.5% |
| 2022 | 38.4% | 27.4% | 13.3% | 20.9% |
| 2023 | 40.5% | 25.6% | 13.5% | 20.5% |
| 2024 | 40.6% | 25.6% | 13.7% | 20.0% |
| 2025 | 40.6% | 26.4% | 14.1% | 19.0% |
Costco’s merchandise revenue consists of sales from several categories. The definitions of these merchandise revenue segments are available here: Foods & Sundries, Non-Foods, Fresh Foods, Warehouse Ancillary, and Other Businesses.
Merchandise Sales Mix by Category — Averages (FY2023–FY2025)
| Metric | 3-Year Average (FY2023–FY2025) |
|---|---|
| Foods & Sundries | 40.6% |
| Non-Foods | 25.9% |
| Fresh Foods | 13.8% |
| Warehouse Ancillary and Other Businesses | 19.8% |
| Total Merchandise Sales | 100.0% |
Averages cover FY2023–FY2025. Revenue rounded to nearest whole unit. Mix and growth rounded to one decimal place.
Merchandise sales growth by category
View data as table
Costco Merchandise Sales Growth by Category — All Metrics by Fiscal Year
| Fiscal Year | Foods & Sundries | Non-Foods | Fresh Foods | Warehouse Ancillary and Other Businesses | Total Merchandise Sales |
|---|---|---|---|---|---|
| 2017 | 3.6% | 8.7% | 8.7% | 23.2% | 8.7% |
| 2018 | 8.4% | 7.6% | 6.9% | 18.8% | 9.7% |
| 2019 | 6.4% | 8.3% | 5.7% | 12.2% | 7.9% |
| 2020 | 15.1% | 8.9% | 16.3% | -7.1% | 9.3% |
| 2021 | 12.6% | 24.9% | 17.1% | 19.1% | 17.7% |
| 2022 | 10.8% | 9.2% | 8.6% | 46.9% | 16.0% |
| 2023 | 12.3% | -0.4% | 8.3% | 4.8% | 6.7% |
| 2024 | 5.5% | 5.1% | 7.0% | 2.6% | 5.0% |
| 2025 | 8.0% | 11.3% | 11.0% | 2.4% | 8.1% |
Costco’s merchandise revenue consists of sales from several categories. The definitions of these merchandise revenue segments are available here: Foods & Sundries, Non-Foods, Fresh Foods, Warehouse Ancillary, and Other Businesses.
Merchandise Sales Growth by Category — Averages (FY2023–FY2025)
| Metric | 3-Year Average (FY2023–FY2025) |
|---|---|
| Foods & Sundries | 8.6% |
| Non-Foods | 5.3% |
| Fresh Foods | 8.8% |
| Warehouse Ancillary and Other Businesses | 3.3% |
| Total Merchandise Sales | 6.6% |
Averages cover FY2023–FY2025. Revenue rounded to nearest whole unit. Mix and growth rounded to one decimal place.
References and Credits
1. All financial figures presented were obtained and referenced from Costco’s annual reports published on the company’s investor relations page: Costco Investor Relations.
2. Pexels Images.
Disclosure
We may use the assistance of artificial intelligence (AI) tools to produce some of the text in this article. However, the data is directly obtained from original sources and meticulously cross-checked by our editors multiple times to ensure its accuracy and reliability.
If you find the information in this article helpful, please consider sharing it on social media. Additionally, providing a link back to this article from any website can help us create more content like this in the future.
Thank you for your support and engagement! Your involvement helps us continue to provide high-quality, reliable content.