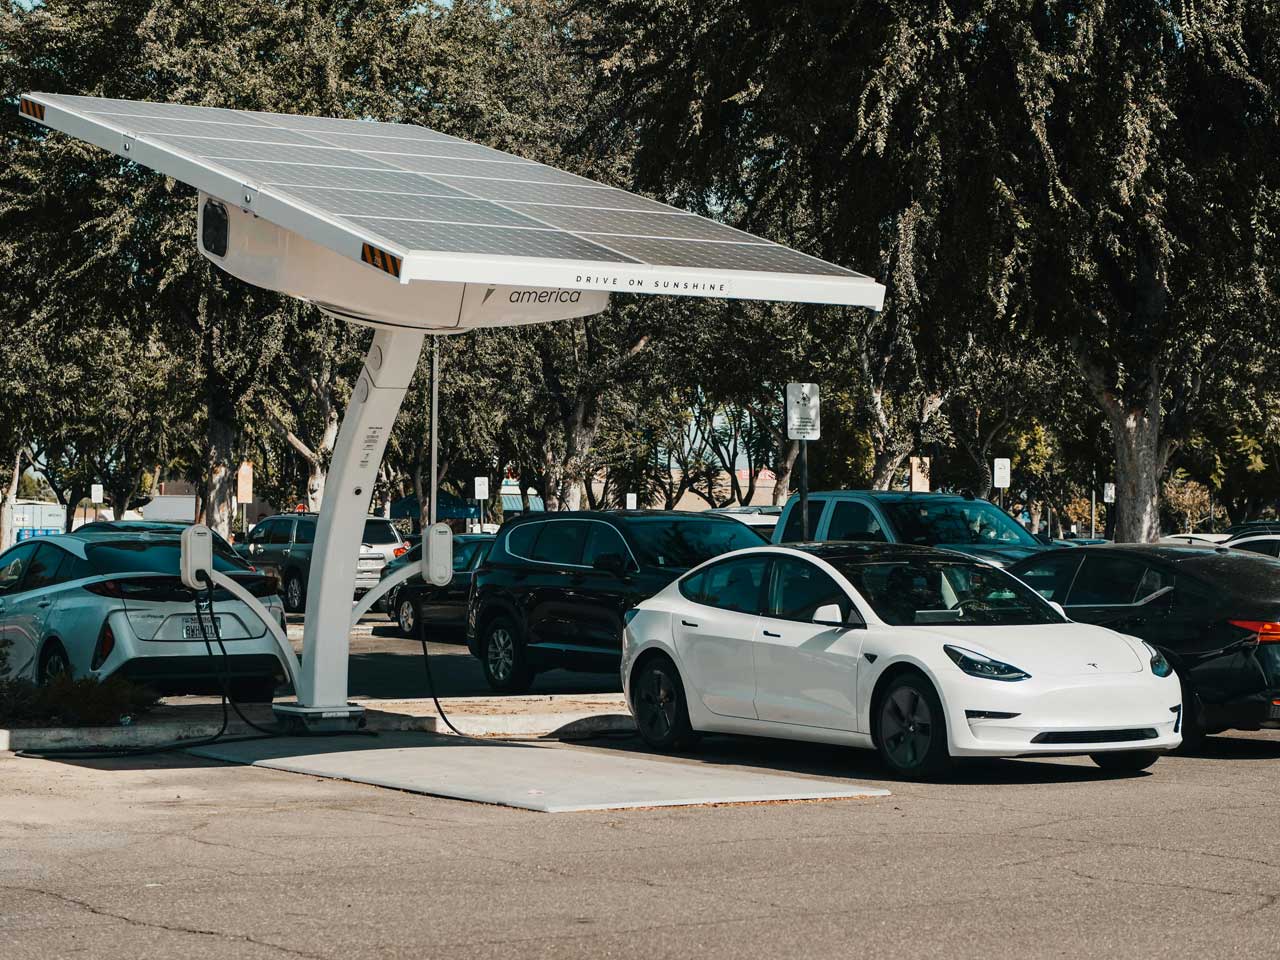
An electric vehicles charging bay. Pexels Image
This article presents the statistics of Tesla’s margins. We will look at Tesla’s margins on a different segment. This includes the consolidated results, automotive segment, energy, services and other, and margin per vehicle.
The margins are presented by quarter based on the TTM or trailing 12-months results. The reason I used the TTM data instead of the annual results is that the changes in margins are more gradual in the quarterly plot.
Let’s take a look!
Please use the table of contents to navigate this page.
Table Of Contents
Definitions And Overview
O2. How Does Tesla Improve Its Profit Margins?
Consolidated Results
A1. Gross Margin
A2. Operating Margin
A3. Net Profit Margin
A4. Adjusted EBITDA Margin
Automotive Segment
B1. Automotive Sales Gross Margin
B2. Automotive Leasing Gross Margin
B3. Total Automotive Gross Margin
B4. Total Automotive Gross Margin (Excluding Carbon Credits)
Energy And Services Segment
C1. Energy Generation And Storage Gross Margin
C2. Services And Other Gross Margin
Margin Per Car
Conclusion And Reference
S1. Conclusion
S2. References and Credits
S3. Disclosure
Definitions
To help readers understand the content better, the following terms and glossaries have been provided.
Adjusted EBITDA: Adjusted EBITDA, which stands for Earnings Before Interest, Taxes, Depreciation, and Amortization, refers to a financial performance measure that adds back certain items to EBITDA to provide a more accurate picture of a company’s operational profitability and cash flow.
The adjustments made to EBITDA typically include non-recurring, irregular, or one-time expenses or incomes that are not considered part of the regular operating activities of a company. These adjustments can include items such as stock-based compensation, litigation expenses, restructuring costs, and gains or losses from asset sales.
By making these adjustments, Adjusted EBITDA aims to provide a clearer view of a company’s underlying operational performance and its ability to generate cash flow from its core business activities, excluding the effects of financing decisions, capital structure, and tax environment.
Management, investors, and analysts commonly use this metric to compare profitability among companies and industries, as it eliminates the effects of financing and accounting decisions.
How Does Tesla Improve Its Profit Margins?
Tesla has pursued several strategies to boost its margins:
1. **Vertical Integration**: Tesla controls much of its supply chain and manufacturing process. This includes producing many components in-house, such as batteries, and owning its sales and service centers. This control can lead to cost savings and efficiencies, reducing reliance on external suppliers and mitigating risks related to price fluctuations and supply chain disruptions.
2. **Innovations in Manufacturing**: The company continuously seeks to innovate in the manufacturing process. For instance, Tesla has introduced large-scale casting machines, known as Giga Presses, to produce larger parts of a car in a single piece, reducing production steps and costs and increasing the structural integrity of its vehicles. Additionally, Tesla aims for highly automated production lines to improve efficiency and reduce labour costs.
3. **Economies of Scale**: As Tesla’s production volume increases, the company benefits from economies of scale. The cost per unit of production decreases as fixed costs are spread over larger units. This is particularly significant in the battery production segment, where Tesla has been investing heavily in Gigafactories to scale up production and reduce the cost of batteries, a major component cost of EVs.
4. **Software and Services Revenue**: Tesla is not just a car manufacturer; it also generates revenue through software and services. This includes its Full Self-Driving (FSD) package, over-the-air (OTA) software updates that improve vehicle performance or add new features, and energy products and services. The margins on software are significantly higher than those on hardware, contributing positively to Tesla’s overall margins.
5. **Direct Sales Model**: Tesla uses a direct sales model, selling vehicles directly to consumers rather than through franchised dealerships. This model eliminates the dealership markup, potentially increasing Tesla’s margins. It also allows Tesla to control the customer experience and pricing more directly.
6. **Continuous Improvement and Cost Reduction**: Tesla operates on a principle of continuous improvement (referred to as ‘Kaizen’ in manufacturing circles), where it constantly seeks ways to reduce costs and improve efficiency in all aspects of its business, from manufacturing to logistics to procurement.
By focusing on these strategies, Tesla aims to boost its margins while scaling its production and expanding its product lineup. This approach helps the company sustain its growth and supports its mission to accelerate the world’s transition to sustainable energy.
Gross Margin
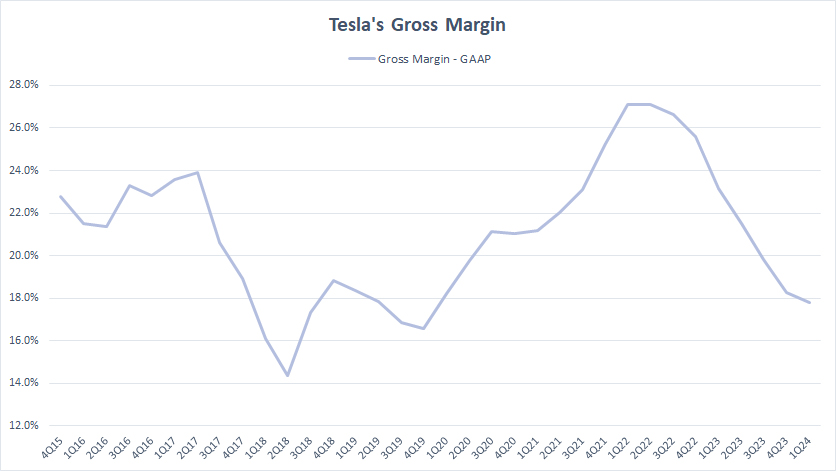
Tesla’s gross margin
(click image to expand)
Tesla’s gross margin has considerably deteriorated in recent periods, reaching around 18% as of 1Q 2024, the lowest level ever measured since 2022.
Tesla’s gross margin has averaged 20% each quarter on a TTM basis since 1Q 2023.
Operating Margin
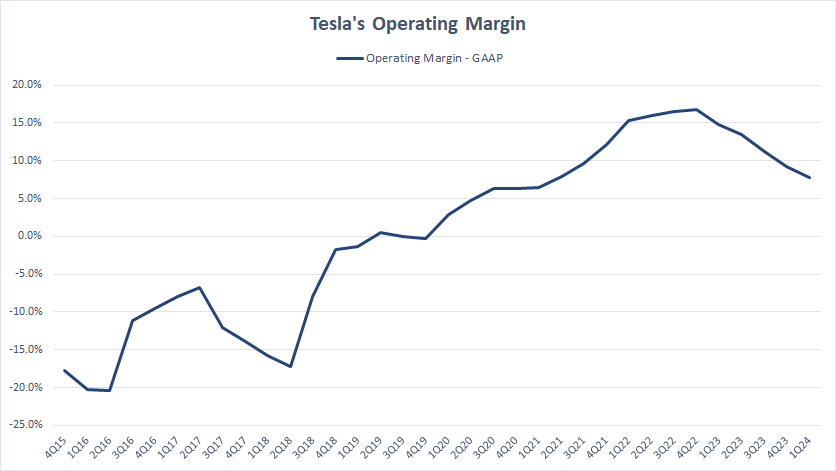
Tesla’s operating margin
(click image to expand)
Tesla’s gross margin considers only the costs of goods sold while leaving out other expenses, including the R&D, SG&A, etc.
When these expenses are taken into consideration, Tesla’s operating margin is much smaller compared to the gross margin.
As shown in the chart, Tesla’s operating profit margin hovered below 10% as of 1Q 2024 for the first time since 2022. On average, Tesla operating margin has amounted to 11% per quarter since 1Q 2023.
Net Profit Margin
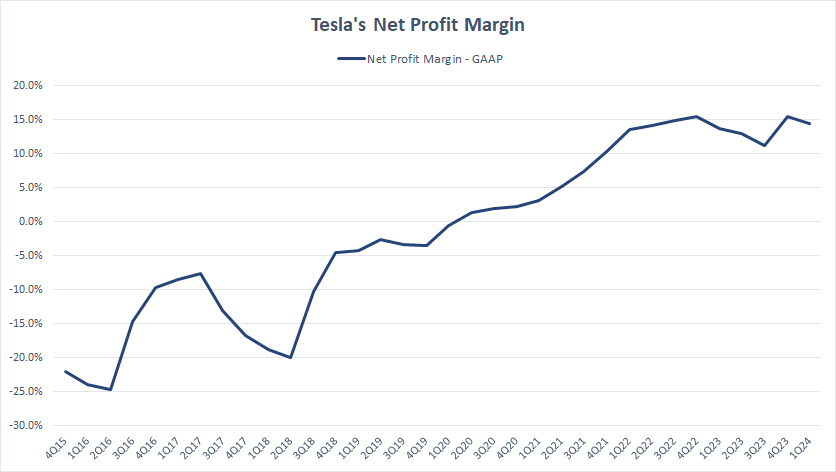
Tesla’s net profit margin
(click image to expand)
The net profit margin accounts for all costs and expenses of doing business, including costs of goods sold, R&D, SG&A, taxes, and interest expenses.
As seen, Tesla’s net profit margin is comparable with the operating profit margin. The latest figure even exceeded the operating margin.
As of 1Q 2024, Tesla’s net profit margin reached nearly 15%, a record figure. On average, Tesla has generated a net profit margin of 13.5% per quarter since 1Q 2023.
Adjusted EBITDA Margin
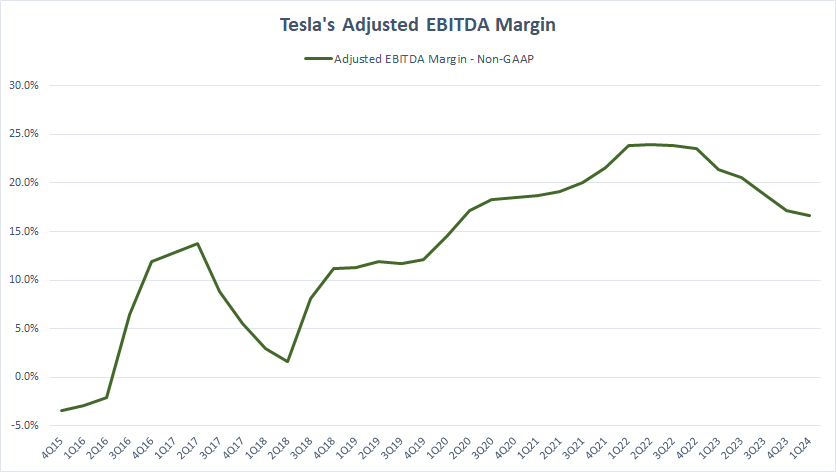
Tesla’s EBITDA margin
(click image to expand)
Thhe definition of Tesla’s adjusted EBITDA is available here: adjusted EBITDA. Basically, the adjusted EBITDA is the cash earnings before changes in working capital and is similar to net cash provided by operating activities. However, the EBITDA is a non-GAAP measure in which certain expense items are excluded during the adjustment.
That said, Tesla’s adjusted EBITDA margin has dived recently, driven by lower profitability. As of fiscal 2024 Q1, Tesla’s adjusted EBITDA margin plummeted to nearly 15%, a record low since 2022.
Automotive Sales Gross Margin
tesla-automotive-sales-gross-margin
(click image to expand)
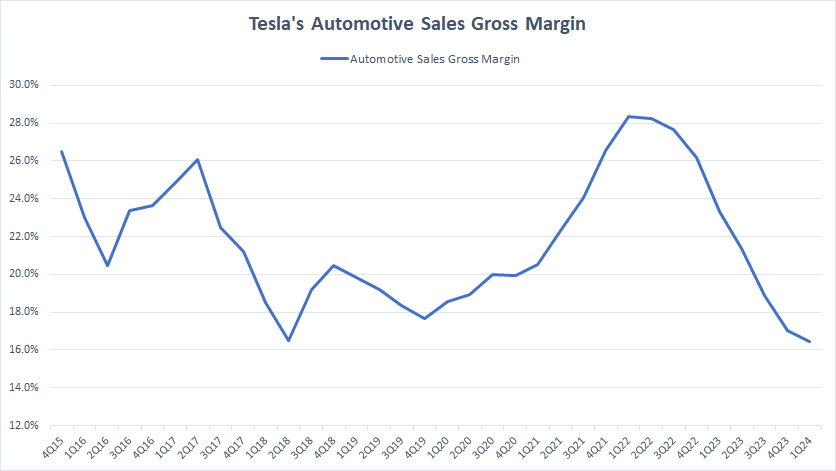
Tesla’s car sales revenue is available here: Tesla car sales revenue.
You can see that Tesla’s car sales gross margin has significantly slumped starting in fiscal 2022, plummeting close to 16% as of 1Q 2024.
For your information, Tesla has made strategic price cuts on some of its vehicle models to stimulate demand and compete more effectively in the global electric vehicle market. This has contributed to the reduction in the automotive gross margin.
Automotive Leasing Gross Margin
tesla-automotive-leasing-gross-margin
(click image to expand)
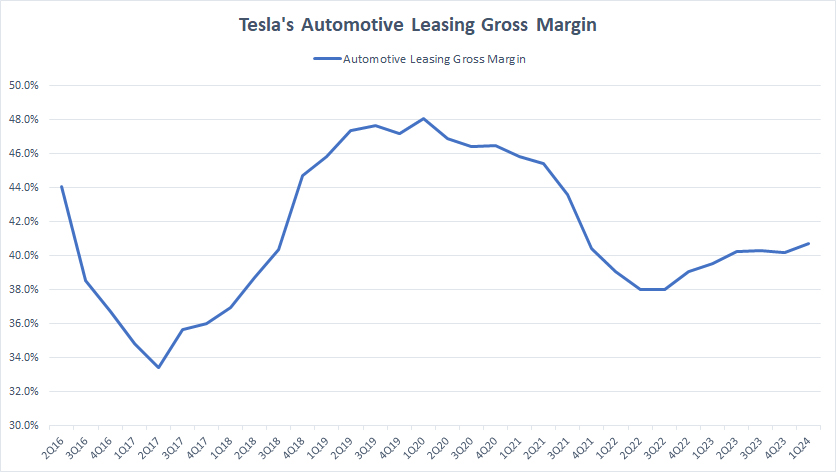
Tesla’s automotive leasing revenue is available here: Tesla automotive leasing revenue.
In contrast, Tesla’s automotive leasing gross margin has not been impacted as much as its automotive sales, as shown in the chart above. Since fiscal year 2022, Tesla’s automotive leasing gross margin has actually been increasing, as opposed to the decreasing ratio seen in automotive sales.
As of 1Q 2024, Tesla’s automotive leasing gross margin exceeded 40%, one of the highest levels ever measured over the last three years.
Total Automotive Gross Margin
tesla-total-automotive-gross-margin
(click image to expand)
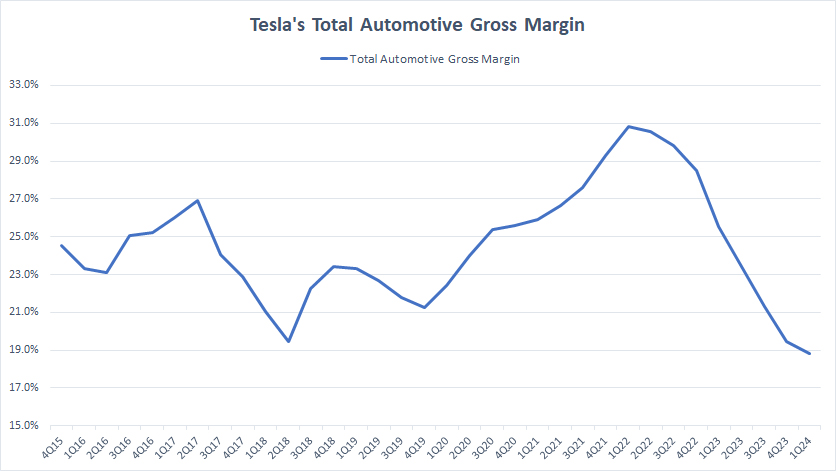
Tesla’s total automotive is a combination of its automotive sales and automotive leasing. Tesla’s total automotive revenue is available here: Tesla total automotive revenue.
Tesla’s total automotive gross margin tumbled to 19% as of 1Q 2024 from a record figure of 31% in 2022, primarily impacted by the strategic price cuts on some of its vehicle models.
Since fiscal 1Q 2023, Tesla’s total automotive gross margin has averaged 22% per quarter.
Total Automotive Gross Margin (Excluding Carbon Credits)
tesla-total-automotive-gross-margin-without-carbon-credits
(click image to expand)
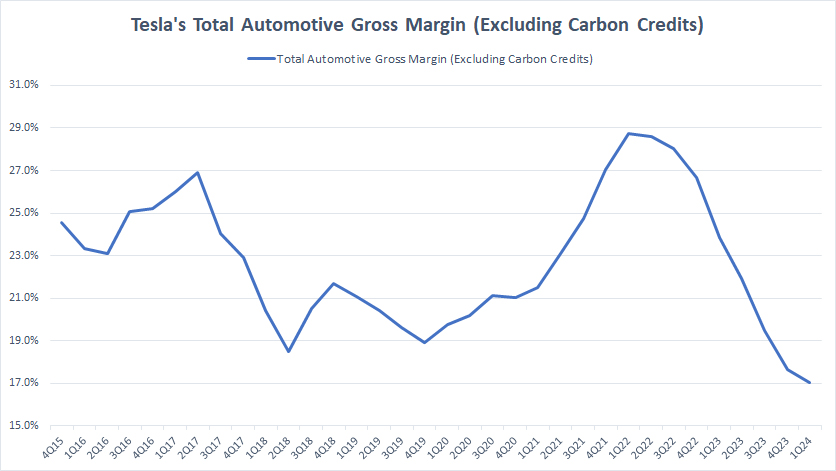
Tesla’s carbon credit per car is available here: Tesla carbon credit per car.
Excluding carbon credit revenue, Tesla’s total automotive gross margin has gone much lower. In fiscal 1Q 2024, Tesla’s total automotive gross margin totaled just 17%, compared to 19% with carbon credit revenue included which we saw earlier.
A notable trend is that Tesla’s carbon credit revenue does not help much in terms of margin recovery. Even with carbon credit revenue included, Tesla’s automotive gross margin has continued to tumble, implying that the carbon credit revenue making up only a tiny portion of its automotive sales.
Energy Generation And Storage Gross Margin
tesla-energy-gross-margin
(click image to expand)
Tesla’s energy generation and storage revenue is available here: Tesla energy generation and storage revenue.
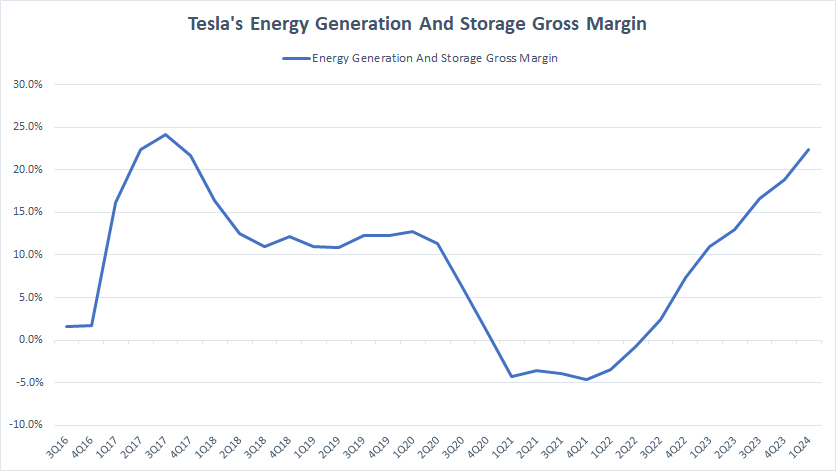
In contrast with the automotive gross margin, Tesla’s energy gross margin has been increasing since fiscal year 2022, as depicted in the chart above.
As of 1Q 2024, Tesla’s energy gross margin hovered around 22%, the highest level ever measured since 2018. Since fiscal 1Q 2023, Tesla’s energy gross margin has averaged 16% each quarter.
Services And Other Gross Margin
tesla-services-gross-margin
(click image to expand)
Tesla’s services and other revenue is available here: Tesla services and other revenue.
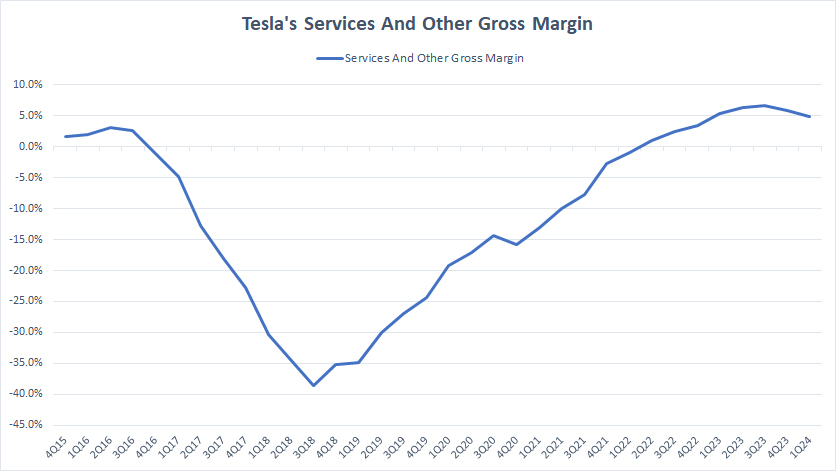
Tesla’s services and other segment has experienced a long recovery in gross margin, as illustrated in the graph above. The service segment has become pretty much a profitable segment.
As of 1Q 2024, Tesla’s services gross margin reached 5%, one of the highest levels that it has achieved. On average, Tesla’s services and other gross margin has amounted to 6% per quarter since 1Q 2023.
Gross Margin Per Vehicle
Tesla’s vehicle margin
(click image to expand)
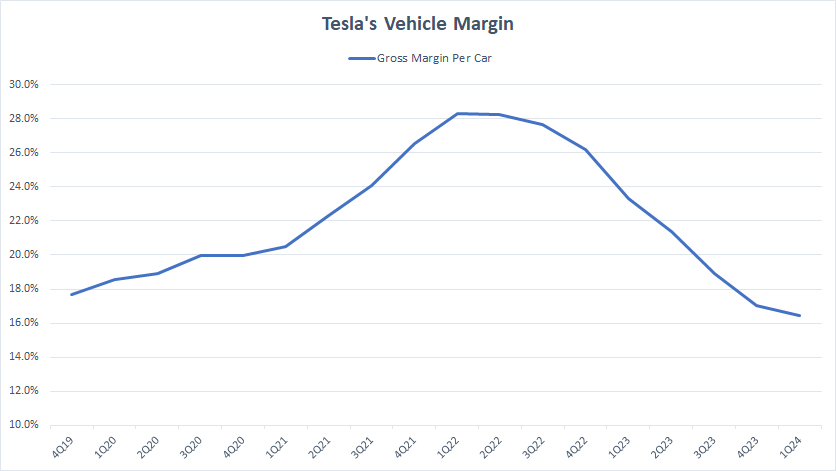
Tesla’s vehicle margin shown in the chart above is represented by the gross margin per car sold. It is measured by using the automotive sales revenue excluding carbon credit and automotive leasing revenue. The number of vehicle sold involves only vehicles delivered not subject to lease accounting.
All told, Tesla’s vehicle gross margin tumbled to around 16% as of fiscal 1Q 2024 from its record high of 28% in 2022.
For profit per car, Tesla managed to earn a gross profit of more than US$10,000 per vehicle as presented in the article – Tesla Profit Per Car.
Conclusion
To recap, most of Tesla’s margins have deteriorated from record highs in recent periods, primarily driven by the dip in margins within the automotive segment.
On the other hand, Tesla’s other segments such as energy and services have seen their margins expanding in recent periods.
References and Credits
1. All financial figures presented in this article were obtained and referenced from Tesla’s quarterly and annual reports, earnings releases, investors presentations, update letters, webcast, etc., which are available in Tesla Press Releases.
2. Pexels Images.
Disclosure
References and examples such as tables, charts, and diagrams are constantly reviewed to avoid errors, but we cannot warrant the full correctness of all content.
The content in this article is for informational purposes only and is neither a recommendation nor a piece of financial advice to purchase a stock.
If you find the information in this article helpful, please consider sharing it on social media and also provide a link back to this article from any website so that more articles like this one can be created in the future.
Thank you!


