Social media like. Pexels Image.
Meta Platforms, Inc., (NASDAQ: META), incurs a significant portion of costs and expenses.
This article delves into the cost of revenue and operating expenses of the social media giant.
Let’s take a look!
Investors interested in the comparison of Meta’s profits and margins with other social media platforms may find more information on this page: Meta profit margin versus Snapchat, Pinterest, and Twitter.
Please use the table of contents to navigate this page.
Table Of Contents
Definitions And Overview
- Cost Of Revenue
- Operating Expenses
- Research And Development
- Marketing And Sales
- General And Administrative
- Advertising Expenses
O2. What Contributes To The Rise In Meta’s Costs And Expenses And Is There A Concern
Consolidated Results
Breakdown Of Total Costs And Expenses
B1. Cost Of Revenue And Operating Expenses
B2. Percentage Of Cost Of Revenue And Operating Expenses
B3. Growth Rates Of Cost Of Revenue And Operating Expenses
Breakdown Of Operating Expenses
C1. R&D, Marketing And Sales, And General And Administrative Expenses
C2. Percentage Of R&D, Marketing And Sales, And General And Administrative Expenses
C3. Growth Rates Of R&D, Marketing And Sales, And General And Administrative Expenses
Ratio To Revenue
D1. Total Costs And Expenses To Revenue Ratio
D2. Operating Expenses And Cost Of Revenue To Revenue Ratio
D3. Operating Expenses Breakdown To Revenue Ratio
Advertising Spending
E1. Advertising Expense
E2. Advertising Expense As A Percentage Of Marketing And Sales
Conclusion And Reference
S1. Conclusion
S2. References and Credits
S3. Disclosure
Definitions
To help readers understand the content better, the following terms and glossaries have been provided.
Cost Of Revenue: Based on the 2023 annual report, Meta’s cost of revenue consists of expenses associated with the delivery and distribution of its products.
These mainly include expenses related to the operation of data centers and technical infrastructure, such as depreciation expense from servers, network infrastructure and buildings, as well as payroll and related expenses which include share-based compensation for employees on the company’s operations teams, and energy and bandwidth costs.
Cost of revenue also includes costs associated with partner arrangements, including traffic acquisition costs and credit card and other fees related to processing customer transactions; Reality Labs inventory costs, which consist of cost of products sold and estimated losses on non-cancelable contractual commitments; and content costs.
Operating Expenses: Operating expenses refer to the costs associated with the day-to-day operations of a business.
These expenses include rent, utilities, payroll, and costs related to the administration and general operations of the company. Operating expenses do not include costs associated with the production of goods or direct costs of services provided.
They are considered when calculating a company’s operating income and are crucial for analysing its financial health.
Research And Development Expenses: According to the 2023 annual report, Meta’s research and development expenses consist mostly of payroll and related expenses which include share-based compensation, Reality Labs technology development costs, facilities-related costs for employees on engineering and technical teams who are responsible for developing new products as well as improving existing products, and restructuring charges.
Marketing And Sales expense: According to the 2023 annual report, Meta’s marketing and sales expenses consist mainly of marketing and promotional expenses as well as payroll and related expenses which include share-based compensation for employees engaged in sales, sales support, marketing, business development, and customer service functions.
In addition, Meta’s marketing and sales expenses also include professional services such as content reviewers to support its community and product operations and restructuring charges.
General And Administrative Expenses: According to the 2023 annual report, Meta’s general and administrative expenses consist primarily of legal-related costs, which include estimated fines, settlements, or other losses in connection with legal and related matters, as well as other legal fees; payroll and related expenses which include share-based compensation for certain of its executives as well as legal, finance, human resources, corporate communications and policy, and other administrative employees; other taxes, such as digital services taxes and other non-income-based tax levies; professional services and restructuring charges.
Advertising Expenses: Advertising expense is the cost of promoting a product, service, or brand to potential customers. It is a type of expenditure that businesses incur to create awareness, generate interest, and ultimately drive sales.
This expense can take various forms, including but not limited to costs for online ads (such as social media and search engines), television and radio commercials, print advertisements (in magazines and newspapers), billboards, and other forms of media.
Advertising expenses are often categorized as operating expenses in financial statements and can significantly impact a company’s profitability depending on the strategy and budget allocated.
According to the 2023 annual report, Meta’s advertising costs are expensed when incurred and are included in marketing and sales expenses on its consolidated statements of income.
What Contributes To The Rise In Meta’s Costs And Expenses And Is There A Concern
Meta Platforms’ rising costs and expenses have indeed raised concerns among investors and industry observers. These increased expenditures can affect the company’s profitability and financial health in several ways.
Firstly, as Meta continues to invest heavily in areas like augmented and virtual reality and the ambitious project of building the metaverse, its operational costs have surged. While potentially transformative in the long run, these investments require significant upfront capital and ongoing expenses without guaranteeing immediate returns. This scenario pressures the company’s margins and could impact short-term profitability.
Secondly, the company is also facing rising costs due to regulatory scrutiny and privacy-related adjustments. Adapting to new regulations, improving data security, and dealing with legal challenges involve substantial legal and operational expenses. These costs can detract from the company’s bottom line and divert resources from product development and other growth initiatives.
Moreover, competition in the social media and tech space is intensifying. To maintain its market position and user base, Meta Platforms must continuously innovate and enhance its offerings, further contributing to its rising expenses. Investments in content moderation, cybersecurity, and user experience enhancements are necessary to sustain user engagement but also add to the company’s operational costs.
While these rising costs and expenses are undoubtedly a concern, it’s also essential to consider them within the context of Meta’s long-term strategy. The company’s investments in new technologies and platforms could secure its position as a leader in future digital landscapes. However, balancing these ambitious projects with sound financial management will ensure the company’s ongoing success and stability.
Total Costs And Expenses
Meta-total-costs-and-expenses
(click image to expand)
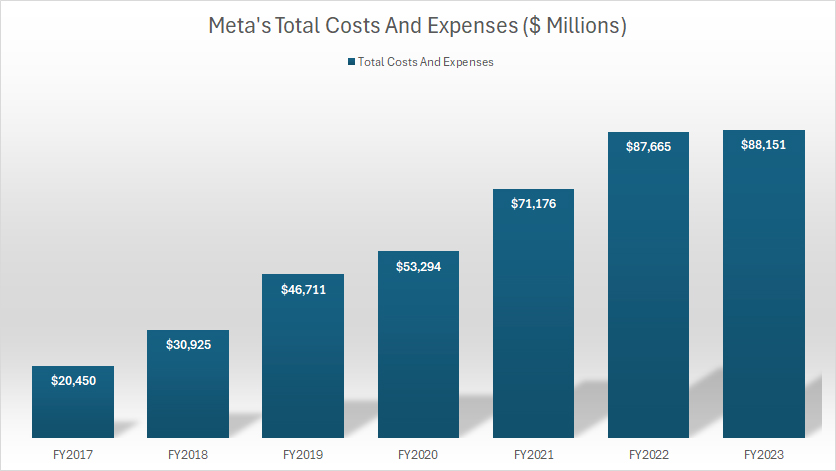
Meta’s total costs and expenses measured $88.2 billion in fiscal year 2023, according to the 2023 annual report, roughly the same as the $87.7 billion reported in 2022 but 24% higher than the $71.2 billion reported in 2021.
Since 2017, Meta’s total costs and expenses have increased by more than fourfold, from $20.5 billion in 2017 to $88.2 billion in 2023.
Cost Of Revenue And Operating Expenses
Meta-cost-of-revenue-and-operating-expenses
(click image to expand)
Meta’s definitions of cost of revenue and operating expenses are available here: cost of revenue and operating expenses.
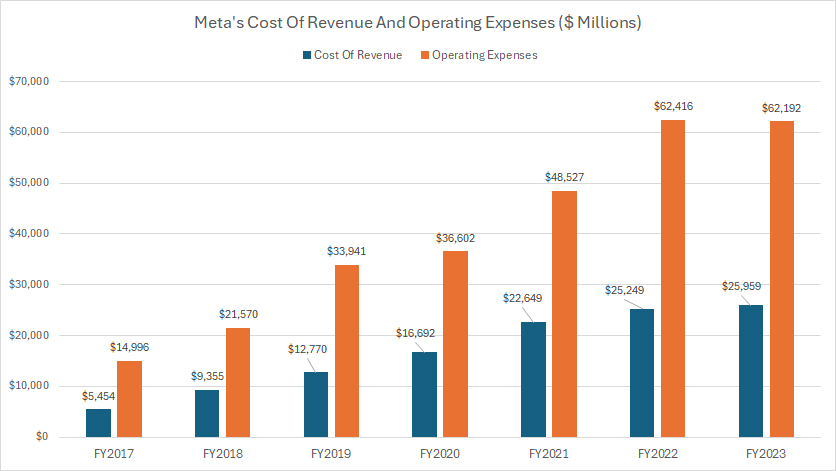
Meta’s total costs and expenses consist of two main categories: cost of revenue and operating expenses, according to its annual reports.
The amount of Meta’s operating expenses is much higher than the amount of cost of revenue. In fiscal year 2023, Meta’s operating expenses topped $62.2 billion, roughly 2.4X higher than the $26 billion in cost of revenue in the same period.
Meta’s cost of revenue and operating expenses have significantly increased since 2017, with the cost of revenue rising slightly at a higher rate. For example, Meta’s cost of revenue has increased by 375% over the last six years, while operating expenses have surged by 300% during the same period.
Percentage Of Cost Of Revenue And Operating Expenses
Meta-percentage-of-cost-of-revenue-and-operating-expenses
(click image to expand)
Meta’s definitions of cost of revenue and operating expenses are available here: cost of revenue and operating expenses.
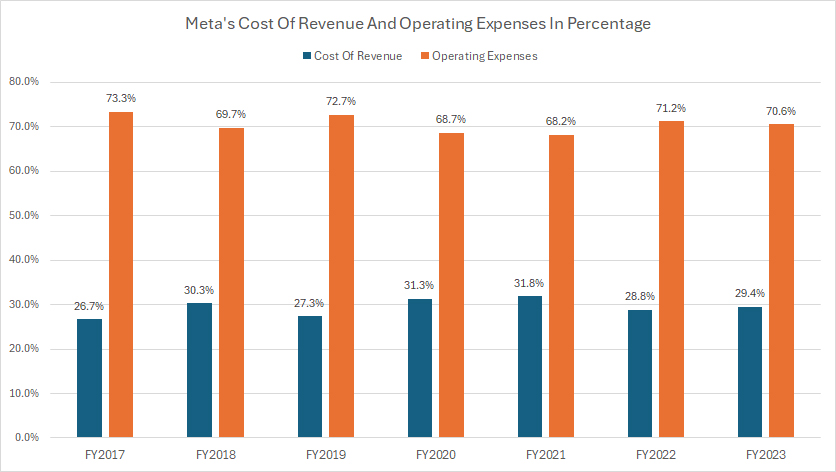
Meta’s operating expenses have accounted for the majority of the company’s total costs and expenses. The percentage reached 70.6% in fiscal year 2023 and has averaged 70% between 2021 and 2023.
On the other hand, Meta’s cost of revenue accounted for just 29.4% of the company’s total costs and expenses in fiscal year 2023. The average ratio has amounted to 30% over the last three years.
Growth Rates Of Cost Of Revenue And Operating Expenses
Meta-growth-rates-of-cost-of-revenue-and-operating-expenses
(click image to expand)
Meta’s definitions of cost of revenue and operating expenses are available here: cost of revenue and operating expenses.
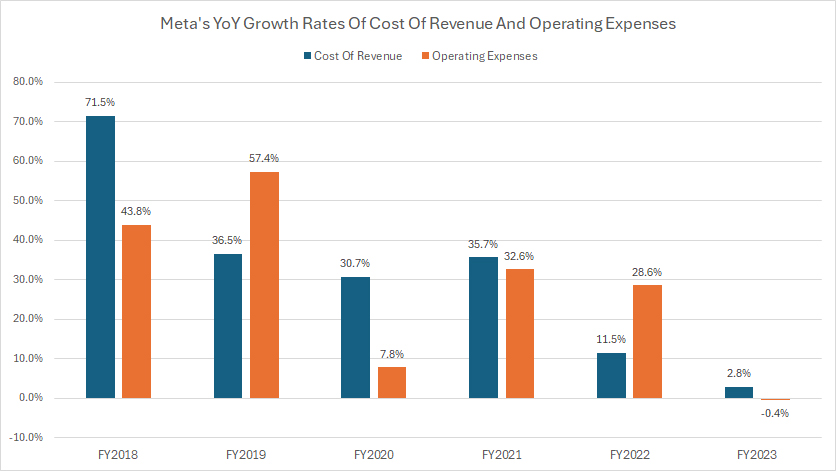
The growth of Meta’s cost of revenue and operating expenses has significantly slowed in recent years, as seen in the chart above.
For example, the growth of Meta’s cost of revenue measured just 2.8% in fiscal year 2023, compared to 11.5% in 2022 and 35.7% in 2021.
Similarly, Meta’s operating expenses decreased by 0.4% in fiscal year 2023, compared to a growth rate of 28.6% in 2022 and 32.6% in 2021.
In short, Meta has significantly cut its cost of revenue and operating expenses in post-COVID periods, with growth rates reaching record lows in fiscal year 2023 for both types of expenses.
R&D, Marketing And Sales, And General And Administrative Expenses
Meta-operating-expenses-breakdown
(click image to expand)
Meta’s definitions of R&D, marketing and sales, and general and administrative expenses are available here: R&D, marketing and sales, and general and administrative.
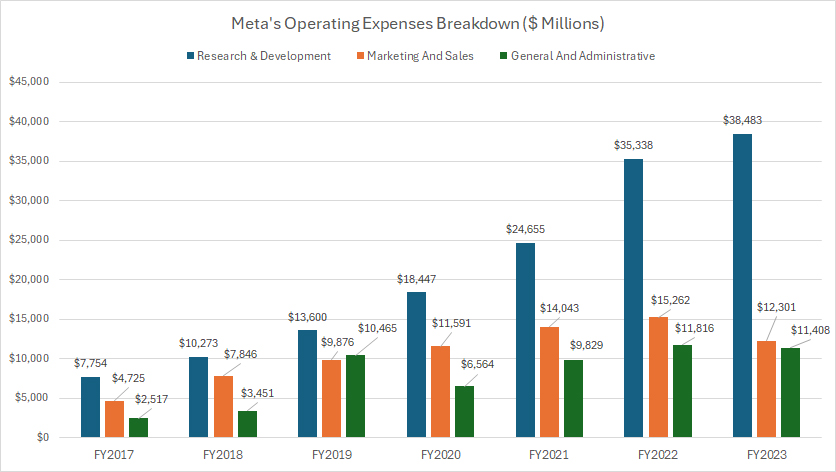
Meta’s operating expenses consist of three major categories: research and development, marketing and sales, and general and administrative, according to its annual reports.
Among the three categories of operating expenses, Meta’s research and development expense comprises the biggest portion, totaling slightly over $38 billion in fiscal year 2023. Since 2017, Meta’s R&D expense has surged considerably. In just six years, the R&D figure has risen by fivefold.
Meta’s marketing and sales expense forms the second-highest portion of its operating expenses, while its general and administrative cost is among the smallest expenses.
In fiscal year 2023, Meta’s marketing and sales expense totaled $12.3 billion, compared to $11.4 billion in general and administrative expense. These expenses also have significantly increased since fiscal year 2017, reaching record highs in some of the latest results.
Percentage Of R&D, Marketing And Sales, And General And Administrative Expenses
Meta-operating-expenses-breakdown-in-percentage
(click image to expand)
Meta’s definitions of R&D, marketing and sales, and general and administrative expenses are available here: R&D, marketing and sales, and general and administrative.
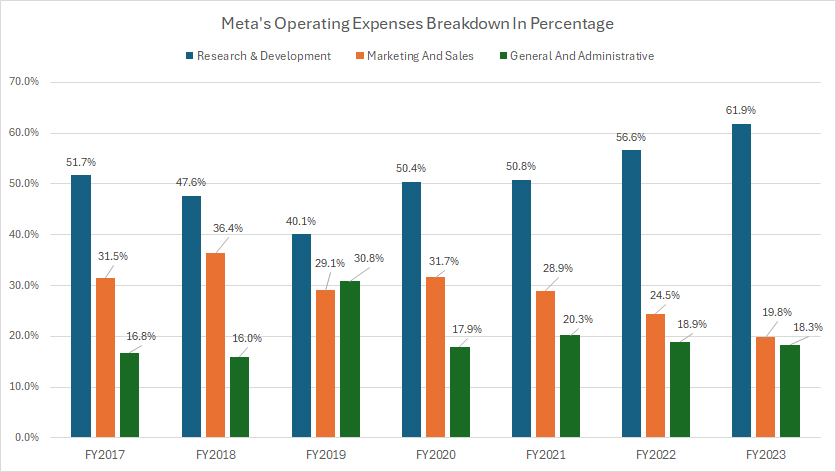
Meta’s R&D expense consists of the largest portion, accounting for 61.9% of the total operating expenses in fiscal year 2023, the highest level ever measured. This ratio has significantly increased since fiscal year 2017 and has averaged 56% over the last three years.
Therefore, the majority of Meta’s operating expenses is being spent on research and development. Meta’s increasing R&D budget implies the significant importance of research and development to the company and the highest priority and attention given to this category of operating expense compared to other expenses.
In contrast, the percentage of Meta’s marketing and sales expense has declined considerably since 2017, down from 31.5% in 2017 to 19.8% as of 2023.
The percentage of Meta’s general and administrative expense has remained relatively stable at an average ratio of 19% over the last three years.
Growth Rates Of R&D, Marketing And Sales, And General And Administrative Expenses
Meta-growth-rates-of-operating-expenses-breakdown
(click image to expand)
Meta’s definitions of R&D, marketing and sales, and general and administrative expenses are available here: R&D, marketing and sales, and general and administrative.
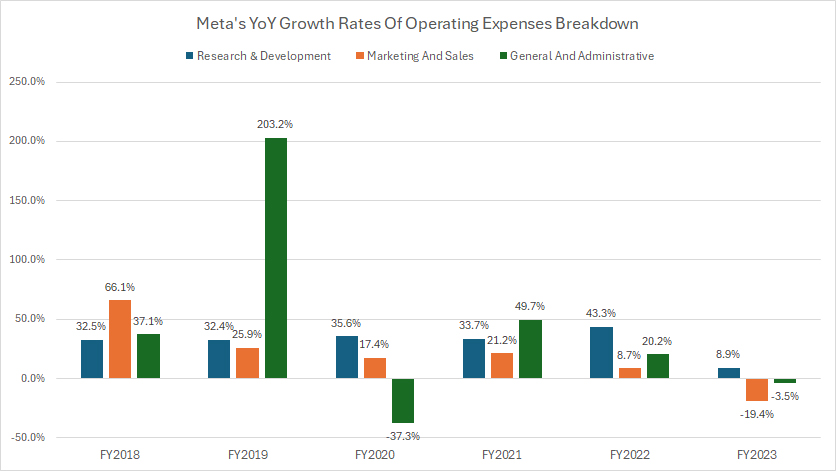
Meta’s R&D expense is the only category of operating expenses that has registered a positive growth rate in all periods shown. However, Meta’s R&D expense grew just 8.9% in fiscal year 2023, the lowest growth ever seen since 2018. On average, Meta’s R&D expense has grown by 28.6% annually between 2021 and 2023, still the most significant compared to other categories of operating expenses.
On the other hand, Meta’s marketing and sales expense decreased by 19.4% in fiscal year 2023 and the general and administrative expense also experienced a decrease in the same year, albeit at a much slower rate.
Nevertheless, these types of operating expenses still registered positive growth in the last three years on average. For example, Meta’s marketing and sales expense has grown by 3.5% annually on average between 2021 and 2023, while the general and administrative expense has grown by 22% annually on average during the same period.
Total Costs And Expenses To Revenue Ratio
Meta-total-costs-and-expenses-to-revenue-ratio
(click image to expand)
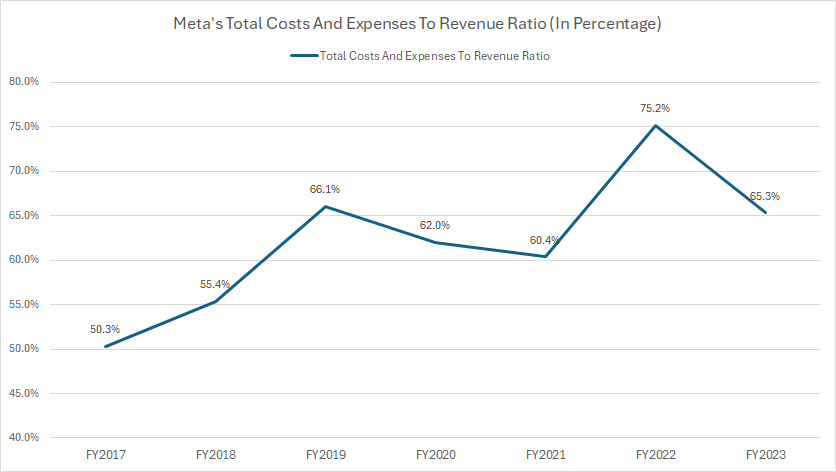
Meta’s total costs and expenses consumed roughly 65% of its total revenue in fiscal year 2023. This ratio was much higher at 75% in fiscal year 2022 and 60% in 2021.
On average, Meta’s total costs and expenses have accounted for 66% of its total revenue over the last five years.
Since 2017, Meta’s total costs and expenses to revenue ratio has considerably increased, implying the much faster growth of the company’s costs and expenses than revenue.
While the ratio subsided in 2023, it was still a significant increase compared to the 50% measured six years ago.
The good news is that the ratio decreased to 65% in 2023 after reaching a record figure of 75% in 2022, indicating Meta’s determination in reducing and cutting its costs and expenses.
Operating Expenses And Cost Of Revenue To Revenue Ratio
Meta-cost-of-revenue-and-operating-expenses-to-revenue-ratio
(click image to expand)
Meta’s definitions of cost of revenue and operating expenses are available here: cost of revenue and operating expenses.
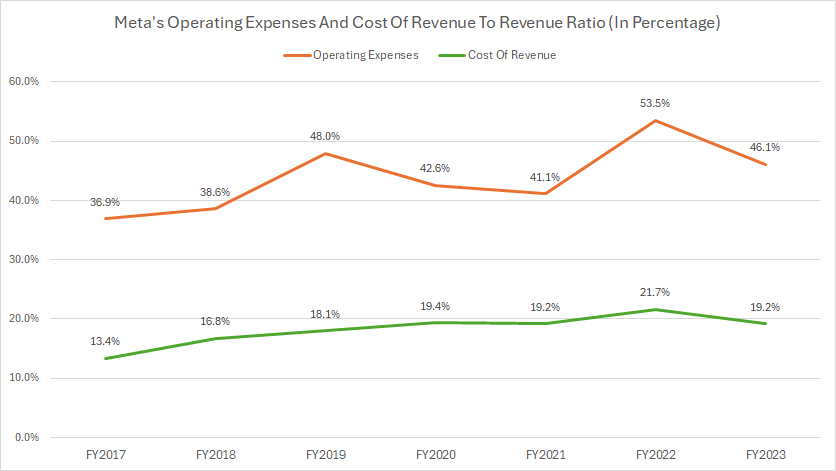
Within Meta’s costs and expenses, the operating expenses have consumed the largest amount of revenue, reaching over 46% of sales as of fiscal year 2023.
On the other hand, Meta’s costs of revenue accounted for just 19.2% of its sales in fiscal year 2023.
Both expenses have consumed 47% and 20%, respectively, of revenue on average in the last three years.
Operating Expenses Breakdown To Revenue Ratio
Meta-operating-expenses-breakdown-to-revenue-ratio
(click image to expand)
Meta’s definitions of R&D, marketing and sales, and general and administrative expenses are available here: R&D, marketing and sales, and general and administrative.
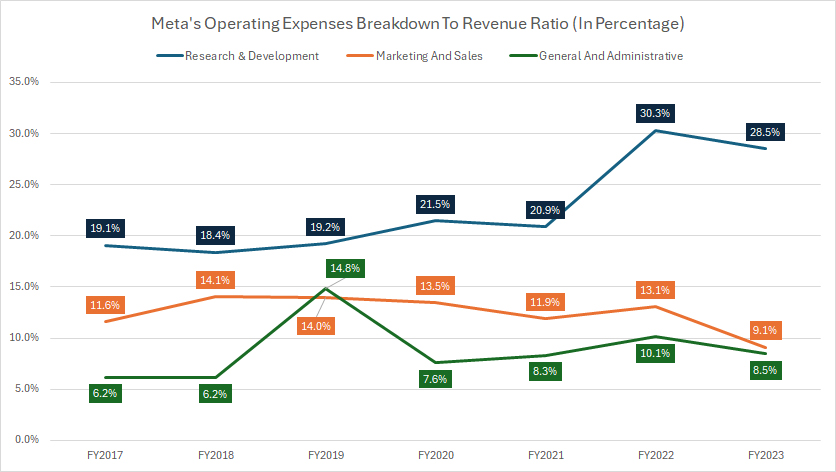
Within Meta’s operating costs, the R&D expense has consumed a significant portion of revenue, totaling 28.5% of sales in fiscal year 2023, making this category of expense the largest expense with respect to revenue.
On average, Meta’s R&D expense has accounted for 27% of its total revenue since fiscal year 2021.
On the contrary, Meta’s marketing and sales expense has accounted for just 11% of its revenue on average over the last three years, while its general and administrative expense has taken up only 9% of its revenue on average in the same period, the lowest among all costs and expenses.
Advertising Expense
Meta-advertising-expense
(click image to expand)
Meta’s definitions of advertising spending are available here: advertising expense.
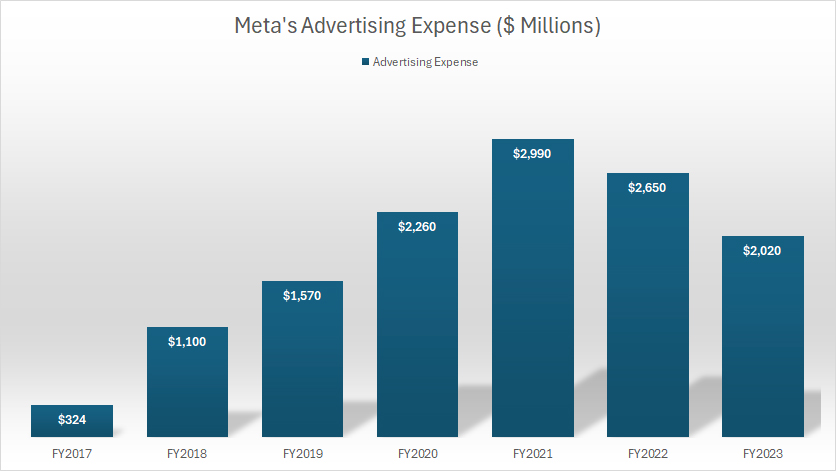
Although Meta derives the majority of its revenue from advertising, it spends a considerable amount on advertising as well.
As shown in the chart above, Meta’s advertising expense exceeded $2 billion in fiscal year 2023, and has averaged $2.6 billion in the last three years.
In addition, Meta’s advertising spending reached a record figure of nearly $3 billion in fiscal year 2021. Since 2021, Meta has considerably reduced its advertising expense.
The most notable expense cut that Meta has done is reducing its advertising spending by nearly $1 billion, from $3 billion in fiscal year 2021 to $2 billion as of 2023.
Advertising Expense As A Percentage Of Marketing And Sales
Meta-advertising-expense-to-marketing-and-sales-expense-ratio
(click image to expand)
Meta’s definitions of advertising spending are available here: advertising expense.
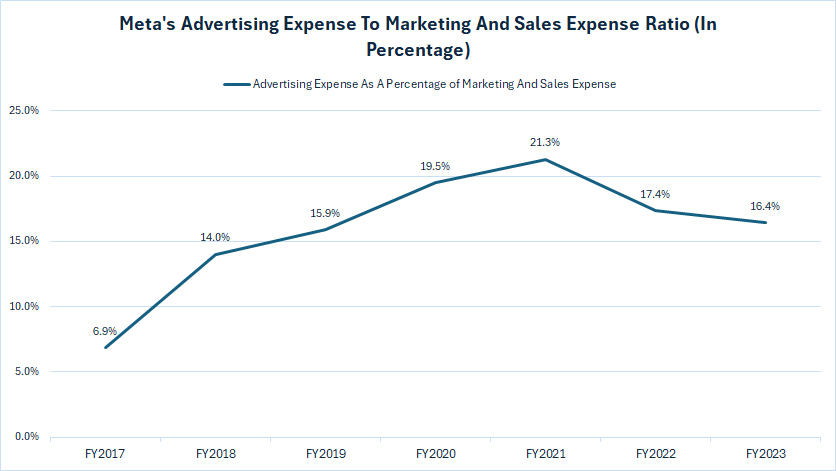
According to Meta’s annual reports, Meta has stated that its advertising expense has been part of its marketing and sales expense. It is included within the expense of marketing and sales.
Therefore, as a percentage of the marketing and sales expense, Meta’s advertising spending of $2 billion in fiscal year 2023 accounted for roughly 16% of the marketing and sales expense.
This ratio has decreased slightly since 2021 and has averaged 18% in the last three years.
Conclusion
Meta incurs a considerable amount of costs and expenses. The total figure reached $88 billion as of 2023, taking up 65% of its revenue. The total costs and expenses to revenue ratio has significantly increased since 2017, implying the much faster growth of costs and expenses than revenue.
The continuous growth of Meta’s costs and expenses and its ratio to revenue is scary and a real concern to investors. The good news is that the growth of the total costs and expenses have significantly slowed in post-COVID time, with YoY growth coming in at less than 1% in fiscal year 2023.
Besides, the tota costs and expenses to revenue ratio also decreased considerably to 65% in 2023. However, at 65%, it was still a significant rise from the 50% measured in 2017.
It is not all doom and disaster for Meta’s total costs and expenses. We have seen that Meta has kept its its most prized asset – the R&D budget – relatively intact. In fact, the R&D expense to operating expense ratio has significantly increased, hitting an all-time high of 62% as of 2023, implying the company’s relentless focus and attention on research and development as the major driver for future growth.
In addition, Meta also has cut and reduced several expenses, including marketing and sales, as well as general and administrative. The marketing and sales expense has decreased the most, plunging 19.4% in fiscal year 2023, while the general and administrative expense plummeted 3.5%.
Similarly, the growth of Meta’s cost of revenue also has significantly slowed since 2021, with YoY growth coming in at just 2.8% in 2023, compared to 11.5% in 2022 and 35.7% in 2021.
Moreover, Meta has reduced its advertising spending by $1 billion since 2021.
In short, Meta knows that it has a costs and expenses problem and it has taken steps to address it.
References and Credits
1. Meta Platform, Inc., financial figures and causes of rising costs and expenses are obtained from the company’s annual and quarterly reports, earnings presentations, webcast, investor slides, etc., which are available in Meta Investor Relations.
2. Pexels Images.
Disclosure
References and examples such as tables, charts, and diagrams are constantly reviewed to avoid errors, but we cannot warrant the total correctness of all content.
The content in this article is for informational purposes only and is neither a recommendation nor a piece of financial advice to purchase a stock.
If you find the information in this article helpful, please consider sharing it on social media and providing a link to this article from any website so that more articles like this can be created in the future.
Thank you!

