Black berries. Pexels Images.
This article compares the operating profit of Walmart and Costco. We will look at the operating profit of Walmart U.S. and Costco U.S.
In addition to the U.S. segment, we also compare the operating profit of both retailers’ international segments.
Let’s dive in!
For the detailed statistics of Walmart and Costco’s profitability and margins, you may find more resources on these pages:
Walmart
Costco
Walmart vs Costco
- Walmart vs Costco: profit margin comparison,
- Walmart vs Costco: total locations and average store size,
Please use the table of contents to navigate this page.
Table Of Contents
Definitions And Overview
O2. Why does Walmart generate significantly more profit than Costco?
U.S. Segment
A1. Walmart U.S. vs Costco U.S.
Sam’s Club
International Segment
C1. Walmart International vs Costco International
Summary And Reference
S1. Insight
S2. References and Credits
S3. Disclosure
Definitions
To help readers understand the content better, the following terms and glossaries have been provided.
Walmart vs Costco in Fiscal Schedules: Walmart’s FY2025 financial results are compared against Costco’s FY2024 results due to differences in their fiscal year reporting.
Walmart operates on a fiscal calendar that ends on January 31, meaning its FY2025 includes February 2024 to January 2025. In contrast, Costco follows a fiscal year ending in August, making its FY2024 cover September 2023 to August 2024.
Since Costco’s FY2025 results are not yet available at the time of Walmart’s latest fiscal report, analysts and industry comparisons often use Costco’s FY2024 as the closest match when evaluating the two retailers’ financial performance.
This approach ensures that the most recent annual results for both companies are used while accounting for their differing fiscal schedules.
Why does Walmart generate significantly more profit than Costco?
Walmart generates significantly more profit than Costco due to several key factors related to scale, business model, and operational efficiency.
First, Walmart operates on a much larger scale, with over 10,000 stores worldwide, compared to Costco’s 876 warehouses. This extensive footprint allows Walmart to reach a broader customer base and generate higher overall revenue. In fiscal year 2025, Walmart reported $674 billion in total revenue, significantly surpassing Costco’s $254 billion reported in fiscal year 2024.
Second, Walmart’s business model is designed for high-volume, low-margin sales across a vast range of products. Unlike Costco, which relies on a membership-based model and bulk sales, Walmart attracts a wider range of customers by offering everyday low prices without requiring a membership. This accessibility drives higher foot traffic and sales volume.
Additionally, Walmart benefits from diverse revenue streams, including its Sam’s Club warehouse division, e-commerce operations, and international markets. Costco, while highly profitable, has a more concentrated revenue model, relying heavily on membership fees and bulk purchases.
Finally, Walmart’s supply chain and operational efficiencies contribute to its profitability. The company leverages advanced logistics and economies of scale to keep costs low while maintaining competitive pricing. Costco, on the other hand, focuses on a limited product selection and bulk discounts, which can restrict overall revenue growth.
While both retailers are highly successful, Walmart’s broader market reach, diversified revenue streams, and operational scale give it a significant advantage in generating higher profits.
Walmart U.S. vs Costco U.S.
U.S.-segment-operating-profit
(click image to expand)
For the definition of the fiscal schedules of Walmart and Costco, you may refer to this section: Walmart vs Costco in fiscal schedules.
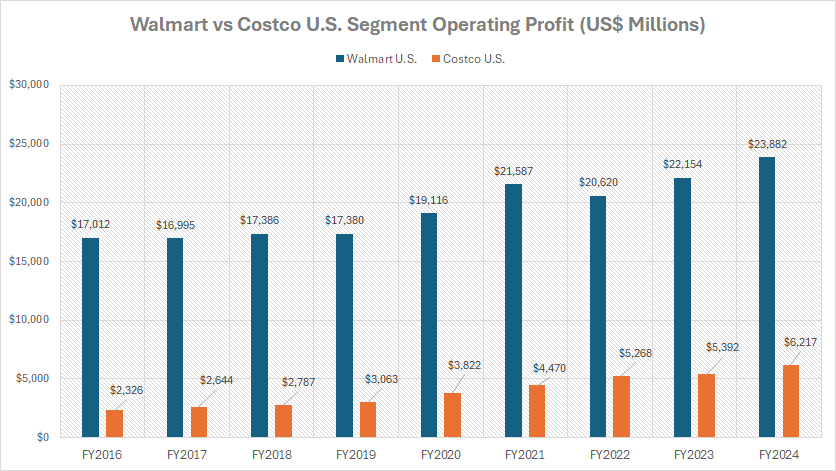
Walmart U.S. generates significantly higher operating profit than Costco U.S., as shown in the chart above. In fiscal year 2024, Walmart U.S. segment’s operating profit was nearly 4X larger than that of Costco U.S. segment.
The following table shows more detailed results:
Operating Profit in FY2024:
| Retailer | Operating Profit (US$ Billions) |
|---|---|
| Walmart U.S. | $23.9 |
| Costco U.S. | $6.2 |
3-Year Trend from FY2021 to FY2024:
| Retailer | Operating Profit (US$ Billions) | % Changes |
|---|---|---|
| Walmart U.S. | $21.6 – $23.9 | +10.6% |
| Costco U.S. | $4.5 – $6.2 | +39.1% |
5-Year Trend from FY2019 to FY2024:
| Retailer | Operating Profit (US$ Billions) | % Changes |
|---|---|---|
| Walmart U.S. | $17.4 – $23.9 | +37.4% |
| Costco U.S. | $3.1 – $6.2 | +103.0% |
8-Year Trend from FY2016 to FY2024:
| Retailer | Operating Profit (US$ Billions) | % Changes |
|---|---|---|
| Walmart U.S. | $17.0 – $23.9 | +40.4% |
| Costco U.S. | $2.3 – $6.2 | +167.3% |
Sam’s Club vs Costco U.S.
Sams-Club-vs-Costco-operating-profit
(click image to expand)
For the definition of the fiscal schedules of Walmart and Costco, you may refer to this section: Walmart vs Costco in fiscal schedules.
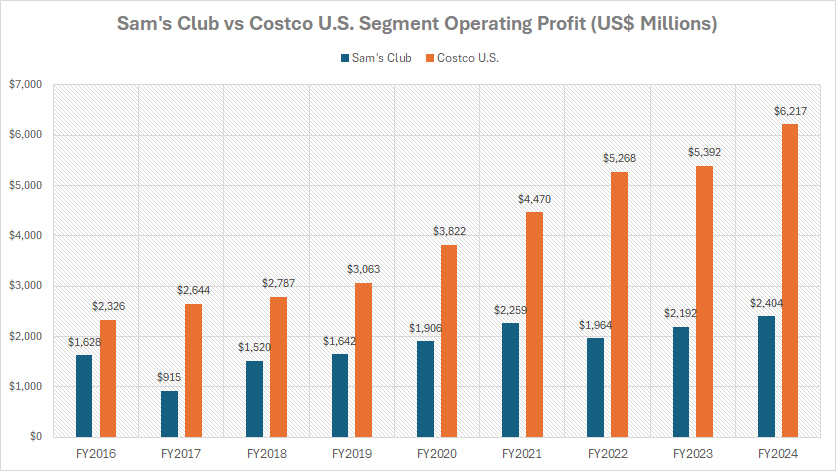
Sam’s Club’s operating profit falls far short of Costco U.S., as illustrated in the chart above. In fiscal year 2024, Costco U.S. achieved an operating profit approximately 2.5 times greater than that of Sam’s Club.
The following table shows more detailed results:
Operating Profit in FY2024:
| Retailer | Operating Profit (US$ Billions) |
|---|---|
| Sam’s Club | $2.4 |
| Costco U.S. | $6.2 |
3-Year Trend from FY2021 to FY2024:
| Retailer | Operating Profit (US$ Billions) | % Changes |
|---|---|---|
| Sam’s Club | $2.3 – $2.4 | +6.4% |
| Costco U.S. | $4.5 – $6.2 | +39.1% |
5-Year Trend from FY2019 to FY2024:
| Retailer | Operating Profit (US$ Billions) | % Changes |
|---|---|---|
| Sam’s Club | $1.6 – $2.4 | +46.4% |
| Costco U.S. | $3.1 – $6.2 | +103.0% |
8-Year Trend from FY2016 to FY2024:
| Retailer | Operating Profit (US$ Billions) | % Changes |
|---|---|---|
| Sam’s Club | $1.6 – $2.4 | +47.7% |
| Costco U.S. | $2.3 – $6.2 | +167.3% |
Walmart International vs Costco International
International-segment-operating-profit
(click image to expand)
For the definition of the fiscal schedules of Walmart and Costco, you may refer to this section: Walmart vs Costco in fiscal schedules.
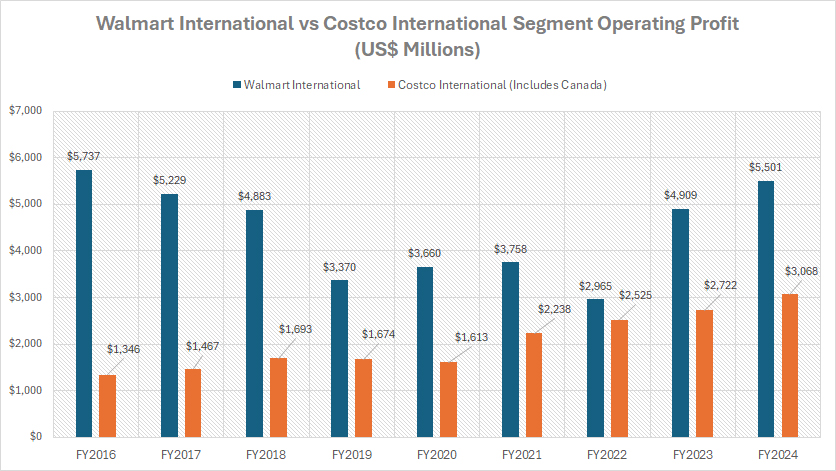
Outside of the U.S., Walmart International generates significantly more profit than Costco International (inclusive of Canada), with the operating profit nearly twice as much as that of Costco in fiscal year 2024, as shown in the chart above.
The following table shows more detailed results:
Operating Profit in FY2024:
| Retailer | Operating Profit (US$ Billions) |
|---|---|
| Walmart International | $5.5 |
| Costco International (Canada included) | $3.1 |
3-Year Trend from FY2021 to FY2024:
| Retailer | Operating Profit (US$ Billions) | % Changes |
|---|---|---|
| Walmart International | $3.8 – $5.5 | +46.4% |
| Costco International (Canada included) | $2.2 – $3.1 | +37.1% |
5-Year Trend from FY2019 to FY2024:
| Retailer | Operating Profit (US$ Billions) | % Changes |
|---|---|---|
| Walmart International | $3.4 – $5.5 | +63.2% |
| Costco International (Canada included) | $1.7 – $3.1 | +83.3% |
8-Year Trend from FY2016 to FY2024:
| Retailer | Operating Profit (US$ Billions) | % Changes |
|---|---|---|
| Walmart International | $5.7 – $5.5 | -4.1% |
| Costco International (Canada included) | $1.3 – $3.1 | +127.9% |
Insight
Walmart’s substantial profit advantage over Costco stems from its expansive scale, diversified revenue streams, and operational efficiencies. The company operates over 10,000 stores globally, compared to Costco’s 876 warehouses, providing Walmart with unparalleled market penetration.
This extensive reach allows it to serve a wider customer base, driving overall revenue far beyond Costco’s capabilities. In fiscal year 2025, Walmart reported $674 billion in total revenue, significantly exceeding Costco’s $254 billion in fiscal year 2024. This difference in revenue directly contributes to Walmart’s larger profit margins.
Another crucial factor is the contrasting business models. Walmart follows a high-volume, low-margin retail strategy, offering a vast range of products with competitive pricing. This allows it to appeal to a broader audience without requiring membership fees. In contrast, Costco relies on a membership-based, bulk-sales model, which limits its customer pool to those willing to pay an annual fee. While Costco benefits from high-margin membership income, this model constrains overall revenue growth compared to Walmart’s approach.
Additionally, Walmart benefits from diverse revenue streams, including Sam’s Club, e-commerce, and international markets. Costco, while profitable, depends heavily on membership fees and bulk purchases, restricting its ability to generate additional revenue outside its core business. Walmart’s presence in multiple retail formats gives it a dynamic edge, particularly in regions where traditional warehouse shopping is less dominant.
Operational efficiency is another key driver. Walmart leverages advanced logistics and economies of scale, reducing costs while maintaining competitive pricing. Its global supply chain and centralized distribution centers enable swift inventory movement, further maximizing profitability. Costco, on the other hand, prioritizes a limited product selection and bulk discounts, which can be efficient but does not allow for the same breadth of sales volume that Walmart achieves.
While both retailers maintain strong profitability, Walmart’s extensive footprint, diversified operations, and superior logistics position it as the dominant force in the retail sector. These factors ensure that Walmart continues to generate significantly higher profits than Costco, reinforcing its market leadership.
References and Credits
1. All financial figures presented were obtained and referenced from Walmart and Costco’s quarterly and annual reports published on the respective investor relations pages: Walmart Investor Relations and Costco Investor Relations.
2. Pexels Images.
Disclosure
We may use artificial intelligence (AI) tools to assist us in writing some of the text in this article. However, the data is directly obtained from original sources and meticulously cross-checked by our editors multiple times to ensure its accuracy and reliability.
If you find the information in this article helpful, please consider sharing it on social media. Additionally, providing a link back to this article from any website can help us create more content like this in the future.
Thank you for your support and engagement! Your involvement helps us continue to provide high-quality, reliable content.


