A Tesla super charger station. Image source: Flickr Image.
General Motors and Tesla are among the bigger players in the automotive sector.
Tesla is the first mover in the EV space.
On the other hand, GM is a latecomer but the company is established in the fossil-fueled vehicle segment.
GM has existed for over a century while Tesla only filed for an IPO 10 years ago.
Moreover, GM only committed to going all-electric in recent years and will spend billions on EV development in the next several years.
While Tesla looks more promising, it is still early to tell who will win the EV race.
Both companies have the necessary resources to win market share and have spent huge amounts of money on research and development.
That said, in this article, we will compare Tesla and GM in several aspects, including vehicle sales and pricing, revenue, margins, profitability, cash flow, etc., to find out which stock is a better buy.
Therefore, let’s start with the following topics.
Table Of Contents
Vehicle Sales And Revenue
A1. Vehicle Sales Volume
A2. Total Net Sales And Revenue
Results Per Car
A3. Vehicle Average Selling Price (ASP)
A4. Gross Profit Per Car
A5. Gross Margin Per Car
Profit Margins
B1. Gross Profit Margin
B2. Operating Profit Margin
B3. Net Profit Margin
Cash Flow Margins
C1. Operating Cash Flow Margin
C2. Free Cash Flow Margin
Debt, Cash And Leverage
D1. Debt
D2. Cash, Investments, And Receivables
D3. Leverage
Capital Returns
E1. Dividends And Share Buyback
Conclusion And Reference
S1. Conclusion
S2. References and Credits
S3. Disclosure
Vehicle Sales Volume
Tesla vs GM in vehicle sales
(click image to enlarge)
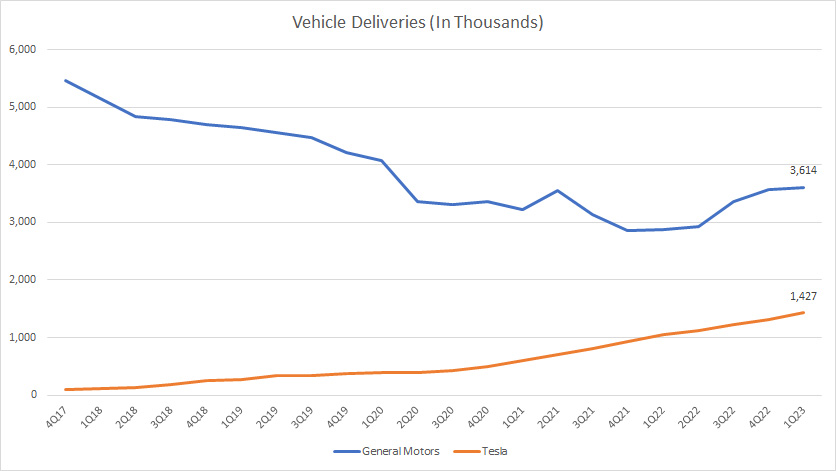
Vehicle sales figures are crucial indicators of growth for GM and Tesla.
From the perspective of volume, GM’s vehicle sales are definitely much higher than the numbers produced by Tesla.
However, GM’s vehicle sales have been on the decline and have only recovered in recent quarters.
The COVID-19 pandemic seems to have impacted GM’s sales badly during the lockdown period which occurred between 2020 and 2021.
On the other hand, Tesla’s vehicle sales have been on the rise and the growth seems unstoppable even during the pandemic.
Therefore, GM has a much higher market share due to its huge vehicle volumes, and the figure is estimated at 16% for retail sales in the U.S. in 2022, according to this article – GM Vehicle Sales And Market Share In The U.S.
On the other hand, Tesla’s market share totaled only 4% as of 1Q 2023 in the U.S., according to the 1Q 2023 Update Letter.
In short, GM has a bigger volume in terms of vehicle sales and thus a higher market share.
However, Tesla’s growth is much better than GM’s and looks more resilient during a market downturn.
Total Net Sales And Revenue
Tesla vs GM in total net sales and revenue
(click image to enlarge)
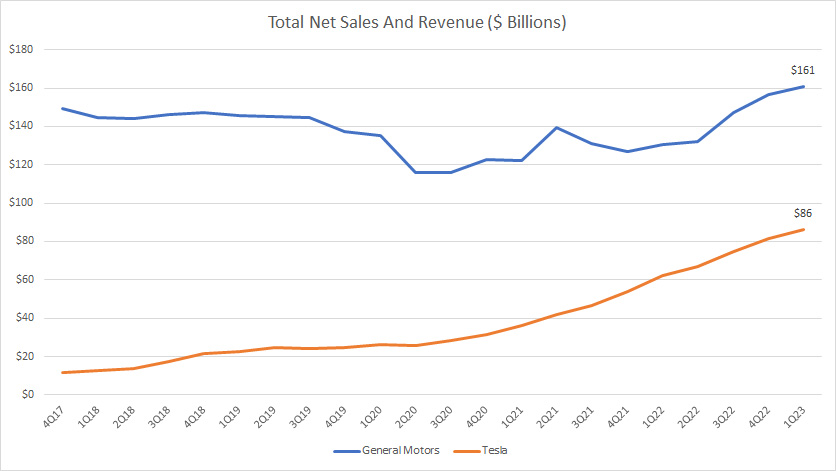
Similarly, from the perspective of revenue growth, Tesla’s figures are much better than GM’s.
As shown in the chart above, Tesla’s revenue has grown multiple folds while that of GM has been somewhat flat.
More importantly, Tesla’s revenue looks much more resilient compared to GM.
GM’s revenue sank badly during the COVID period while that of Tesla looks a lot more durable.
Vehicle Average Selling Price (ASP)
GM vs Tesla in vehicle selling price
(click image to enlarge)
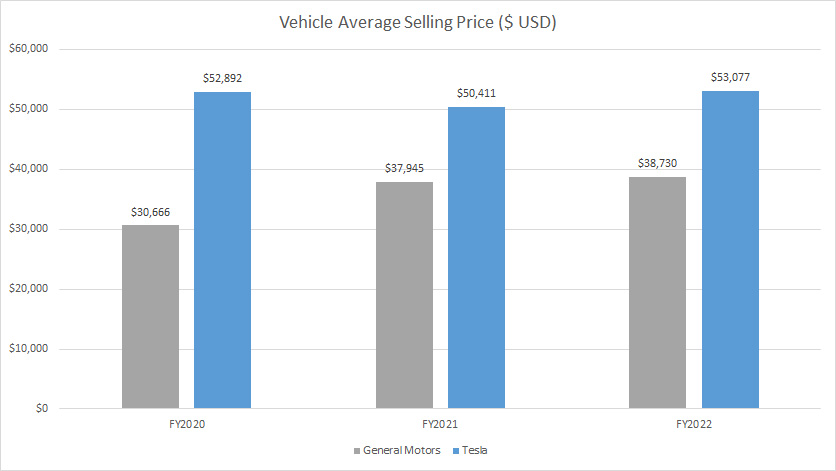
For vehicle pricing, GM wins hands down due to its much lower vehicle selling price.
Compared to Tesla, GM’s vehicle selling price is cheaper by nearly 30% as of 2022.
Keep in mind that GM’s sales model is wholesale-based while that of Tesla is retail-based.
Therefore, the lower vehicle selling price probably explains the much bigger market share commanded by General Motors.
Tesla needs to further lower its vehicle pricing in order to grab market shares, especially those from fossil-fueled vehicles.
Gross Profit Per Car
GM vs Tesla in profit per car
(click image to enlarge)
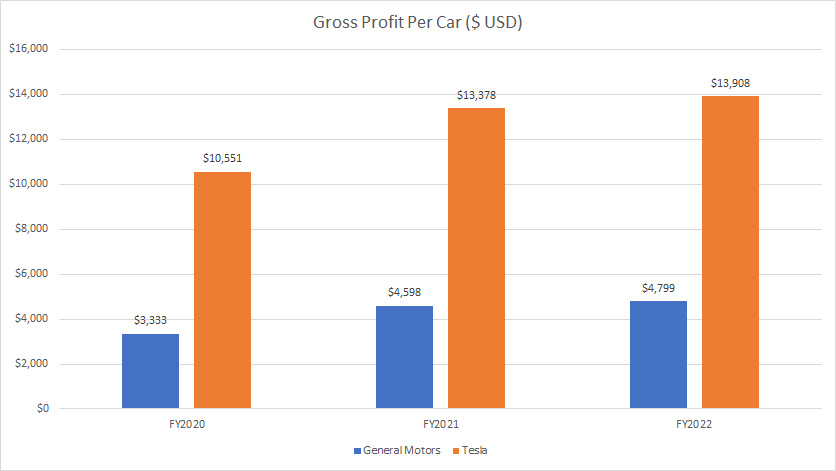
For profitability per car, Tesla makes much more money than GM does.
For example, Tesla’s gross profit per car came in at more than $10,000 USD and this figure had been on the rise in the past 3 years.
On the other hand, GM’s gross profit per car totaled only $4,800 as of 2022, a much lower figure compared to that of Tesla.
In fact, Tesla’s profitability per car had been roughly 200% or 2X higher than General Motors’ profitability per car over the past 3 years.
Therefore, Tesla makes much more money than General Motors does on a per-car or per-vehicle basis.
Gross Margin Per Car
GM vs Tesla in margin per car
(click image to enlarge)
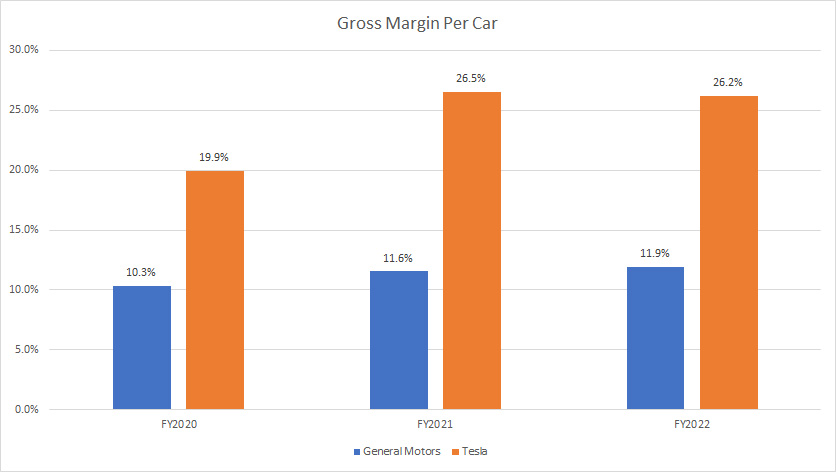
Apart from having a much higher gross profit per car delivered, Tesla’s profitability per car also had been much better than that of General Motors from the perspective of margin.
As shown in the chart above, Tesla’s gross margin per car had been at least 1X higher than GM’s in all fiscal years between 2020 and 2022.
For example, as of 2022, Tesla’s gross margin per car totaled 26% compared to only 12% for GM.
Therefore, Tesla makes much more money on a per-car basis than GM does.
Gross Profit Margin
Tesla vs GM in gross profit margin
(click image to enlarge)
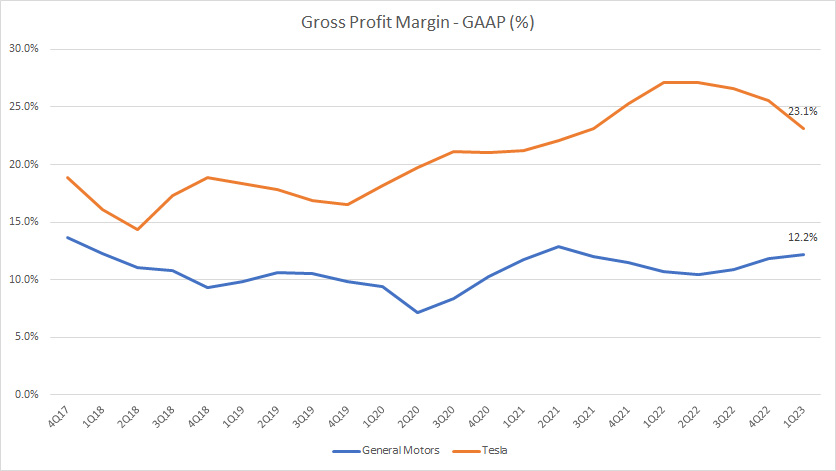
From the perspective of profitability, Tesla’s figures are much better than GM’s as reflected in the higher gross profit margins.
As seen in the chart, Tesla’s gross profit margin totaled 23% as of 1Q 2023 compared to only 12% for General Motors, nearly 1X higher.
Also, GM’s gross profit margin was nearly flat all these years while Tesla’s figures have significantly improved.
Operating Profit Margin
Tesla vs GM in operating profit margin
(click image to enlarge)
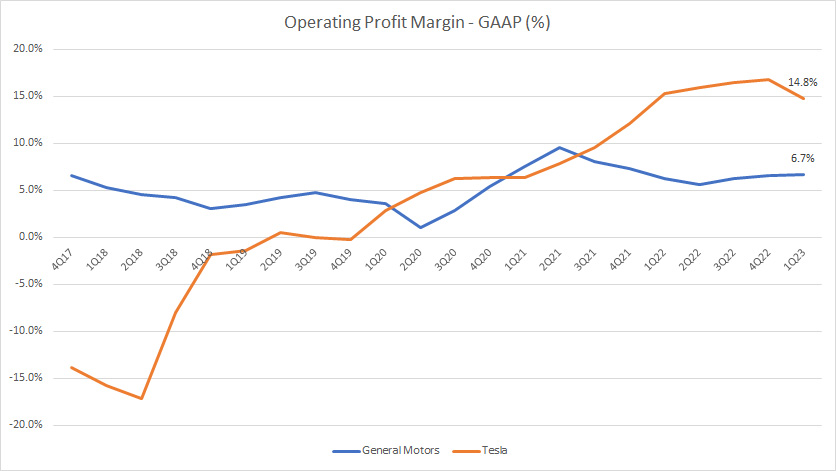
Similarly, Tesla’s operating margin gets much better than that of General Motors over time.
Since fiscal 2017, Tesla’s operating margin has greatly improved and reached a massive figure of 15% as of Q1 2023 compared to only 7% for GM.
Also, GM’s operating margins look flat in most fiscal years as opposed to the growing operating profit margin of Tesla.
Therefore, from the perspective of operation, Tesla operates much more efficiently than GM does.
Net Profit Margin
Tesla vs GM in net profit margin
(click image to enlarge)
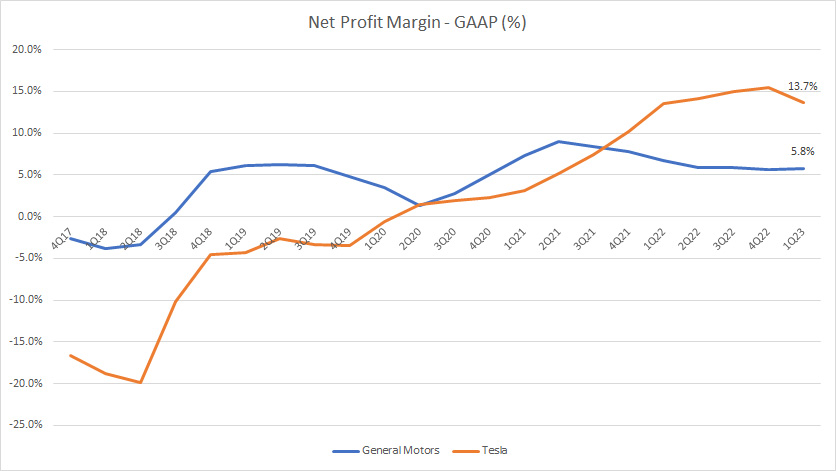
Again, Tesla is much more profitable than General Motors as reflected in the higher net profit margin shown in the chart above.
As of fiscal 1Q 2023, Tesla’s net profit margin clocked at 14% compared to GM’s net profit margin which totaled only 6%.
Therefore, Tesla was more than twice as profitable as GM.
Also, GM’s net profit margin has been mostly flat while that of Tesla has improved considerably.
Operating Cash Flow Margin
Tesla vs GM in operating cash flow margin
(click image to enlarge)
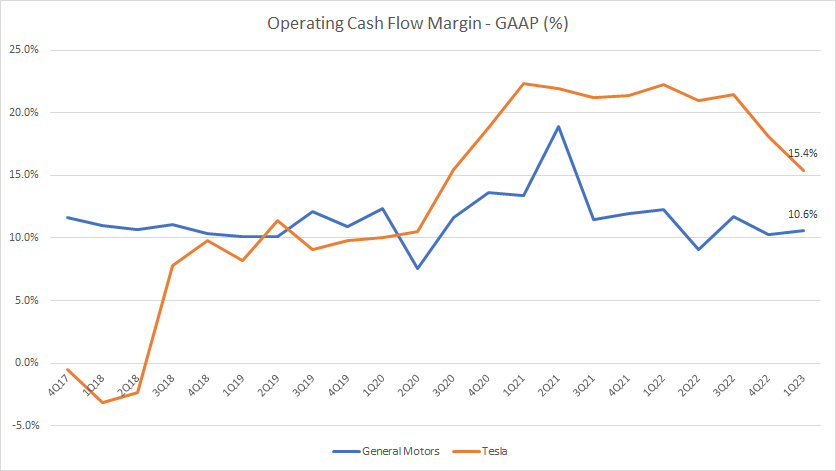
From a cash flow perspective, Tesla is much more efficient than General Motors.
As seen in the chart above, Tesla’s operating cash flow margin reached 15% as of 1Q 2023 compared to 11% for General Motors.
What this figure means is that Tesla is able to generate a higher operating cash flow than GM does for the same amounts of revenue.
As a result, Tesla operates more efficiently compared to General Motors in terms of operating cash flow.
Free Cash Flow Margin
Tesla vs GM in free cash flow margin
(click image to enlarge)
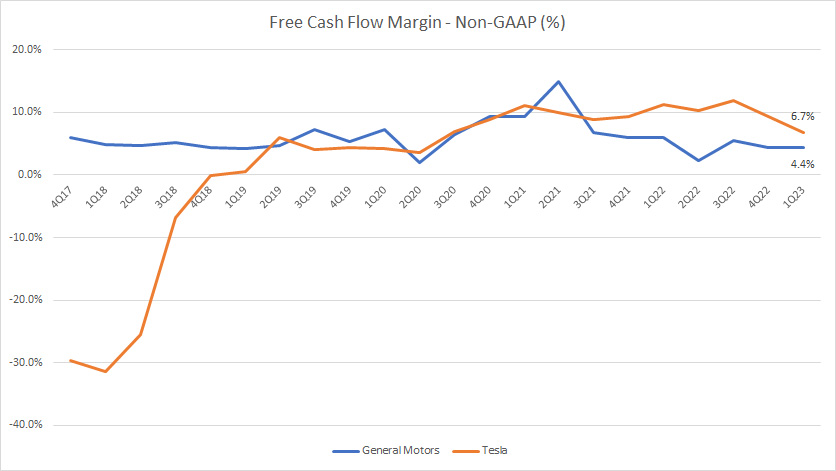
Tesla edged out GM from the perspective of free cash flow margin.
As seen, Tesla’s free cash flow margin totaled 7% as of Q1 2023 compared to 4% for General Motors.
Therefore, Tesla is able to generate a much higher free cash flow than GM does for the same amount of revenue.
Debt
GM vs Tesla in debt levels
(click image to enlarge)
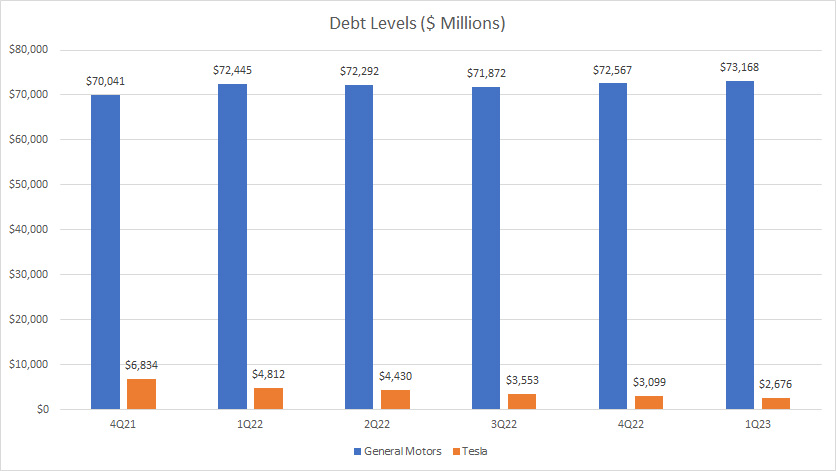
From the perspective of debt, GM’s figures are definitely on the high side compared to Tesla’s.
In fact, GM’s debt level of $73 billion reported in Q1 2023 is more than 20X higher than Tesla’s figure of only $2.7 billion.
More importantly, Tesla has been making an effort to reduce its debt levels over the years and the figure reported in 1Q 2023 was at its lowest level.
In contrast, GM’s debt level has slightly increased since 2021 and has shown no signs of a decline.
Cash, Investments, And Receivables
GM vs Tesla in cash, investments and trade receivables
(click image to enlarge)
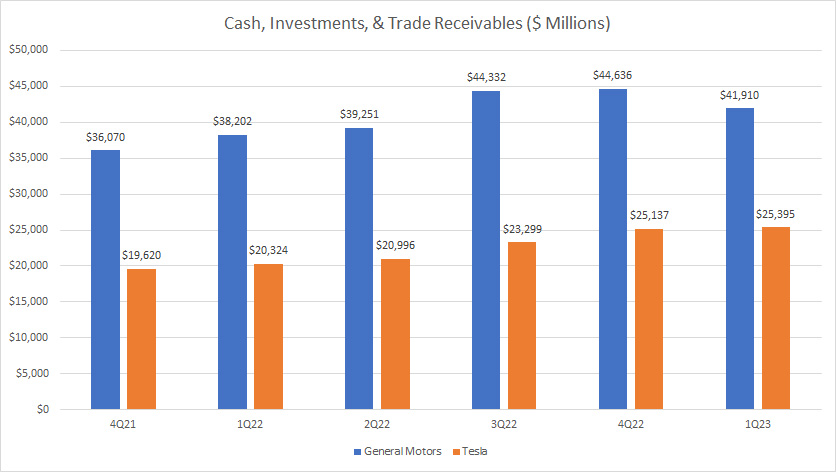
While GM carries a much higher debt load, it also has a much higher cash, investments and trade receivables compared to Tesla’s.
Therefore, GM has much higher liquid assets than Tesla does.
However, when we compare GM’s liquid assets with its debt figures which we saw in prior discussions, the numbers pale in comparison.
As seen, GM’s liquid assets which consist of cash, investments, and trade receivables totaled only slightly over $40 billion, a significantly smaller number compared to its debt level of more than $70 billion.
In contrast, Tesla’s liquid assets were able to pay off its debt levels multiple times in all fiscal years if the company wanted to.
Therefore, Tesla has a net debt of zero while GM still carries a significant number of debt even after accounting for its cash.
Leverage
Ratios Are Measured Based On Results At The End Of The Financial Quarter
| Quarter | General Motors | Tesla | ||
|---|---|---|---|---|
| Debt To Asset Ratio | Debt To Equity Ratio | Debt To Asset Ratio | Debt To Equity Ratio | |
| 4Q 2021 | 28.6% | 106.4% | 11.0% | 22.6% |
| 1Q 2022 | 28.8% | 108.5% | 7.3% | 14.1% |
| 2Q 2022 | 28.5% | 105.9% | 6.5% | 12.2% |
| 3Q 2022 | 27.6% | 103.4% | 4.8% | 8.9% |
| 4Q 2022 | 27.5% | 100.9% | 3.8% | 6.9% |
| 1Q 2023 | 27.4% | 98.9% | 3.1% | 5.6% |
In terms of debt leverage, Tesla is much better than GM as its ratios are much lower as shown in the table above.
For example, Tesla’s debt made up only 3% of its total assets while GM’s figure came in at 27% as of 1Q 2023.
Similarly, Tesla’s debt-to-equity ratio also was much lower compared to GM’s ratio.
For example, Tesla’s debt comprised only 6% of equity while GM’s figure totaled nearly 100% as of 1Q 2023.
Therefore, GM is much more leveraged than Tesla.
Dividends And Share Buyback
Capital Returns Are Measured In Million USD
| Fiscal Year | General Motors | Tesla | ||
|---|---|---|---|---|
| Cash Paid For Dividends | Share Buyback | Cash Paid For Dividends | Share Buyback | |
| 2020 | $669 | 90 | – | – |
| 2021 | $186 | – | – | – |
| 2022 | $397 | $2500 | – | – |
In terms of capital return, General Motors is much better than Tesla.
As shown in the table above, GM pays cash dividends and also buys back its shares.
On the other hand, Tesla is a non-dividend payer and does not buy back shares.
Therefore, income investors seeking cash would probably go for GM’s stock because of the cash dividends that it offers.
While GM’s dividend yield of 1% may not mean much now, I believe that GM will raise the rate due to the improving fundamentals and business outlook.
For Tesla, it may not be a cash dividend-paying stock but I do not rule out the possibility that Tesla will pay cash dividends in the future given its improving profitability and cash flow.
For now, Tesla’s shareholders can only gain from stock price appreciation.
On the other hand, GM’s shareholders can collect cash on a quarterly basis and at the same time also gain when the stock price appreciates.
Summary
Tesla is fundamentally far superior to General Motors.
For example, Tesla is much better in margins, profitability, and cash flow generation compared to General Motors.
Moreover, Tesla also carries less debt and is less leveraged than GM.
This factor alone makes Tesla’s stock less risky compared to GM’s.
Tesla also makes significantly more money on a per-car basis compared to GM.
However, GM delivers huge volumes of vehicles at much cheaper prices and owns a much larger market share.
Therefore, GM earns significantly higher revenue and has more resources to compete in the automotive industry.
Besides, GM also returns cash to shareholders in the form of cash dividends and buys back its shares.
Therefore, GM’s stock is more income-oriented while Tesla’s stock is more on growth.
Also, I do not rule out the possibility of growth for GM’s stock after it gets on the EV bandwagon and is determined to go all-electric.
In the end, it really boils down to what investors are looking for.
References and Credits
1. All financial figures presented in this article are obtained and referenced from financial statements, SEC filings, earnings reports, etc., which are available in: GM SEC filings and Tesla SEC filings.
2. Featured images in this article are used under Creative Common licenses and obtained from the following sources: Alpha and Marco Verch.
Disclosure
References and examples such as tables, charts, and diagrams are constantly reviewed to avoid errors, but we cannot warrant the full correctness of all content.
The content in this article is for informational purposes only and is neither a recommendation nor a piece of financial advice to purchase a stock.
If you find the information in this article helpful, please consider sharing it on social media and also provide a link back to this article from any website so that more articles like this one can be created in the future.
Thank you!

