Property. Pexels Image.
This article presents the revenue streams of Berkshire Hathaway Inc. There are two major revenue streams within the company: insurance and non-insurance.
Berkshire Hathaway’s insurance revenue consists of various sources, including premiums earned from insurance underwriting and investment income. A detailed breakdown of Berkshire’s insurance revenue is available in this article: Berkshire insurance revenue.
On the other hand, Berkshire Hathaway’s non-insurance revenue is generated from operations across various sectors, including railroads, energy, manufacturing, wholesale distribution, and service and retailing.
These revenue streams stem from multiple business segments, such as BNSF (Burlington Northern Santa Fe), BHE (Berkshire Hathaway Energy), PTC (Pilot Travel Centers), McLane Company, and others.
A detailed breakdown of Berkshire Hathaway’s non-insurance revenue can be found in this article: Berkshire Hathaway revenue by business segment.
Please note that the revenue streams provided does not account for the eliminations due to intersegment transactions. Consequently, the total sum of these revenues may slightly differ from the final amount presented in the company’s consolidated statements of earnings.
That said, let’s look at Berkshire’s insurance and non-insurance revenue.
Investors looking for other statistics of Berkshire Hathaway may find more resources on these pages:
- Berkshire Hathaway cash flow and cash on hand analysis,
- Berkshire Hathaway insurance premium by region and country, and
- Berkshire Hathaway insurance profit breakdown.
Please use the table of contents to navigate this page.
Table Of Contents
Definitions And Overview
O2. How Does Berkshire’s Revenue From Insurance Segments Stack Up Against Its Non-Insurance Segments?
Revenue By Stream
A1. Insurance And Non-Insurance Revenue
A2. Percentage Of Insurance And Non-Insurance Revenue
Growth Rates
A3. Growth Rates Of Insurance And Non-Insurance Revenue
Summary And Reference
S1. Summary
S2. References and Credits
S3. Disclosure
Definitions
To help readers understand the content better, the following terms and glossaries have been provided.
Insurance Revenue: Berkshire Hathaway’s insurance revenue encompasses a variety of financial streams associated with its extensive insurance operations. This includes:
- GEICO: GEICO is one of the largest auto insurers in the United States, and its revenue includes premiums earned from insuring automobiles, motorcycles, all-terrain vehicles, recreational vehicles, as well as homeowners, renters, and life insurance.
- Berkshire Hathaway Primary Group: The Berkshire Hathaway Primary Group consists of multiple insurance operations that collectively offer a range of commercial insurance products. These include commercial motor vehicle insurance, workers’ compensation, commercial property insurance, healthcare liability insurance, etc.
- Berkshire Hathaway Reinsurance Group: The Berkshire Hathaway Reinsurance Group is one of the largest reinsurance groups in the world. It provides reinsurance solutions to insurance companies globally, helping them manage risk and maintain financial stability. The group includes several subsidiaries, such as Gen Re (General Reinsurance Corporation) and TransRe (Transatlantic Reinsurance Company).
- Investment Income: Investment income refers to the earnings generated from the vast portfolio of investments. This includes dividends, interest, and capital gains from stocks, bonds, and other financial assets.
Each of these revenue sources contributes to the overall financial health and growth of Berkshire Hathaway’s insurance segment.
Non-Insurance Revenue: Berkshire Hathaway’s non-insurance revenue streams encompass operations in the railroad, utilities, and energy sectors. These sources include:
- Railroad (“BNSF”): Operation of one of the largest railroad systems in North America through Burlington Northern Santa Fe, LLC.
- Berkshire Hathaway Energy (“BHE”): Regulated electric and gas utility, including power generation and distribution activities and real estate brokerage activities through Berkshire Hathaway Energy Company and affiliates.
- Pilot Travel Centers (“PTC”): Largest operator of travel centers in North America and a marketer of wholesale fuel.
- McLane Company (“McLane”): Wholesale distribution of groceries and non-food items.
- Manufacturing: Manufacturers of numerous products including industrial, consumer and building products, including home building and related financial services.
- Service and retailing: Providers of numerous services including shared aircraft ownership programs, aviation pilot training, electronic components distribution, various retailing businesses, including automobile dealerships and trailer and furniture leasing.
These revenue streams contribute significantly to Berkshire Hathaway’s overall financial performance, highlighting the diverse nature of the company’s operations beyond its well-known insurance activities.
How Does Berkshire’s Revenue from Insurance Segments Stack Up Against Its Non-Insurance Segments?
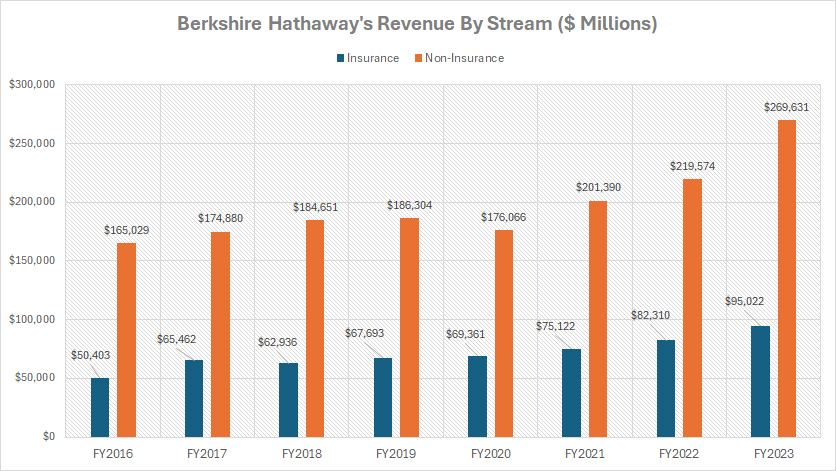
In fiscal year 2023, Berkshire Hathaway’s insurance revenue was approximately $95.0 billion, while its non-insurance revenue from operations like railroads, utilities, and energy totaled around $269.6 billion.
This shows that the non-insurance segment is a larger contributor to Berkshire Hathaway’s overall revenue compared to its insurance operations. However, both segments play crucial roles in the company’s diversified business model.
Insurance And Non-Insurance Revenue
berkshire-insurance-and-non-insurance-revenue
(click image to expand)
You can find the definitions of Berkshire’s insurance and non-insurance revenue here: insurance and non-insurance.
As illustrated in the chart above, Berkshire’s non-insurance revenue is much larger than its insurance revenue. However, in terms of growth rate, Berkshire’s insurance revenue has expanded at a much faster pace compared to its non-insurance sector.
Since fiscal year 2016, Berkshire’s non-insurance revenue has grown by over 60%, reaching a record figure of $269.6 billion as of fiscal year 2023.
On the other hand, Berkshire’s insurance revenue has experienced even more rapid growth, soaring by over 90% during the same period and surpassing $95 billion as of fiscal year 2023.
Berkshire Hathaway’s non-insurance revenue significantly exceeds its insurance revenue, primarily due to the diverse and expansive nature of its non-insurance businesses.
For instance, BNSF, one of the largest freight railroad networks in North America, plays a crucial role. Additionally, Berkshire Hathaway Energy is deeply involved in the generation, distribution, and transmission of energy, further bolstering the company’s non-insurance income.
Furthermore, companies like Precision Castparts Corp. and other manufacturing entities also contribute significantly to Berkshire Hathaway’s non-insurance revenue. These manufacturing operations include a diverse array of products and services, enhancing the company’s overall revenue stream.
In addition, Berkshire Hathaway’s McLane Company, a leading wholesale distributor of food and non-food products, is a significant contributor to the company’s non-insurance revenue. In fiscal year 2023, this business segment ranked third in terms of revenue contribution, trailing just behind the manufacturing sector, according to this article: Berkshire revenue breakdown.
These non-insurance segments collectively generate substantial revenue, contributing to the overall financial strength and diversification of Berkshire Hathaway. The company’s ability to invest in and grow these non-insurance operations has led to a larger revenue base compared to its insurance segment.
Percentage Of Insurance And Non-Insurance Revenue
berkshire-insurance-and-non-insurance-revenue-in-percentage
(click image to expand)
You can find the definitions of Berkshire’s insurance and non-insurance revenue here: insurance and non-insurance.
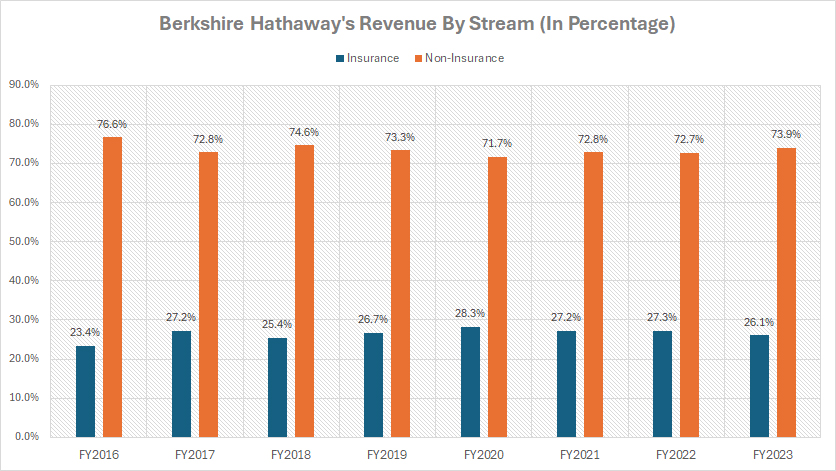
As depicted in the chart above, Berkshire Hathaway derives the majority of its revenue from the non-insurance sector. Only a fraction of the revenue comes from the insurance segment.
Precisely, Berkshire Hathaway’s revenue from the insurance sector accounted for just 26% of the company’s total revenue in fiscal year 2023. This percentage has remained relatively stable over the past several fiscal years. However, it marks a significant increase from the 23.4% recorded in fiscal year 2016.
On the other hand, in fiscal year 2023, Berkshire Hathaway’s non-insurance revenue constituted 74% of the company’s total revenue. This percentage represents a slight decrease from the 76.6% recorded in fiscal year 2016, yet it underscores the dominant role of the non-insurance segment within the company’s expansive and diverse business operations.
In short, Berkshire Hathaway’s non-insurance revenue far exceeds its insurance segment. This is largely attributed to the diverse and extensive range of its non-insurance operations.
For example, Berkshire’s manufacturing sector, a key non-insurance segment, constituted a significant portion of the company’s revenue, second only to the insurance segment.
Similarly, Berkshire’s McLane Company, a major wholesale distributor of food and non-food products, was the third-largest revenue contributor in fiscal year 2023.
Collectively, these non-insurance segments generate substantial revenue, enhancing the overall financial strength and diversification of Berkshire Hathaway. The company’s strategic investments and growth in these non-insurance operations have resulted in a larger revenue base compared to its insurance segment.
Growth Rates Of Insurance And Non-Insurance Revenue
berkshire-growth-rates-of-insurance-and-non-insurance-revenue
(click image to expand)
You can find the definitions of Berkshire’s insurance and non-insurance revenue here: insurance and non-insurance.
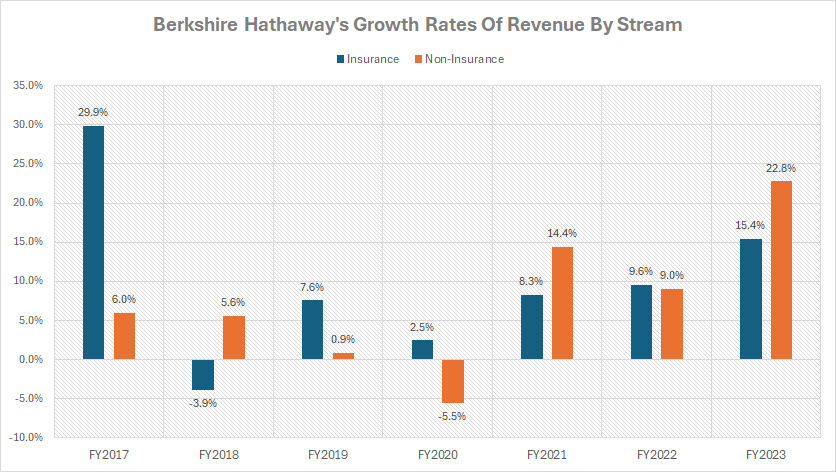
Over the past three years, Berkshire Hathaway’s non-insurance revenue has shown slightly stronger growth compared to its insurance revenue. For instance, between fiscal years 2021 and 2023, Berkshire’s non-insurance revenue achieved an average annual growth rate of 15%, whereas the insurance segment experienced an average annual growth rate of 11%.
In fiscal year 2023, Berkshire Hathaway saw a significant growth in its non-insurance revenue, achieving a 23% year-over-year increase. On the other hand, Berkshire’s insurance revenue experienced a 15% increase compared to the previous year during the same period.
As a result, over the last three years, Berkshire Hathaway’s non-insurance revenue has experienced a faster growth rate compared to the insurance segment. However, when considering a longer time horizon, Berkshire Hathaway’s insurance revenue has shown a more accelerated growth rate, notably at over 90% versus 60% for the non-insurance revenue.
Summary
In summary, Berkshire Hathaway’s insurance revenue is primarily driven by companies like GEICO and other insurance subsidiaries within the Primary and Reinsurance Groups.
Major contributors for Berkshire’s non-insurance revenue include BNSF (freight railroad), Berkshire Hathaway Energy, manufacturing entities like Precision Castparts Corp., and the McLane Company (wholesale distribution).
Berkshire’s non-insurance revenue significantly exceeds insurance revenue due to the diverse and expansive nature of Berkshire’s non-insurance businesses. These segments collectively generate substantial revenue, contributing to the company’s financial strength and diversification.
While Berkshire’s non-insurance revenue has shown stronger growth over the last three years, the insurance segment has experienced a more accelerated growth rate over a longer period.
Credits And References
1. All financial data presented in this article was obtained and referenced from Berkshire Hathaway’s annual reports published in the company’s investor relation page: Berkshire’s Reports.
2. Pexels Images.
Disclosure
The content in this article is for informational purposes only and is neither a recommendation nor a piece of financial advice to purchase a stock.
If you find the information in this article helpful, please consider sharing it on social media and also provide a link to this article from any website so that more articles like this one can be created in the future.
Thank you!


