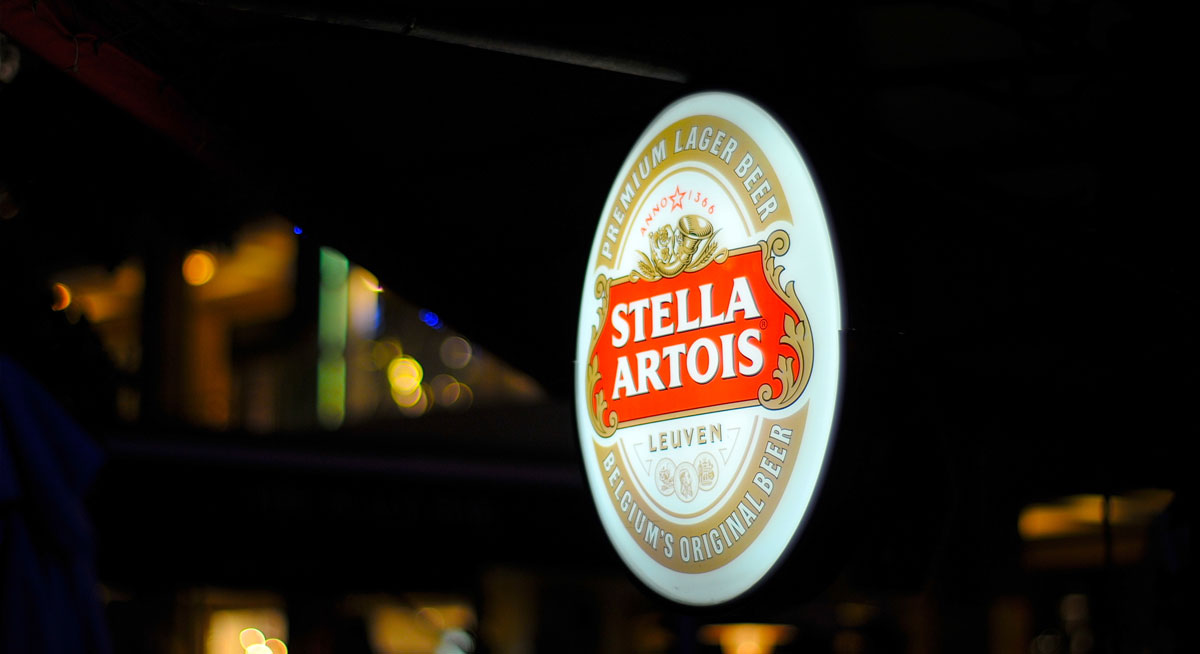
AB InBev’s Stella Artois. Source: Flickr
AB InBev or Anheuser-Busch InBev is one of the largest brewers in the world.
The company markets and sells not only alcoholic drinks such as beers but also non-alcoholic drinks such as energy and soft drinks.
For your information, AB InBev is a publicly-traded company headquartered in Leuven, Belgium, with a ticker name ABI at the Euronext exchange.
Aside from the Euronext exchange, AB InBev also is listed in several exchanges such as the Mexico MEXBOL and South Africa JSE with the ticker symbols ANB and ANH, respectively.
AB InBev also carries the ticker name BUD in the New York Stock Exchange (NYSE) and the stock is traded as a form of ADR or American Depositary Receipt.
In this article, we are going to look at AB InBev’s cash metrics, including the cash on hand, operating cash flow, and free cash flow as well as cash margin.
Let’s move on!
AB InBev’s Cash Flow Topics
1. Total Cash On Hand
2. Cash On Hand Breakdown
3. Net Cash From Operating Activities
4. Operating Cash Flow Margin
5. Free Cash Flow
6. Free Cash Flow Margin
7. Net Cash From Financing Activities
8. Conclusion
AB InBev’s Cash On Hand
AB InBev’s cash on hand
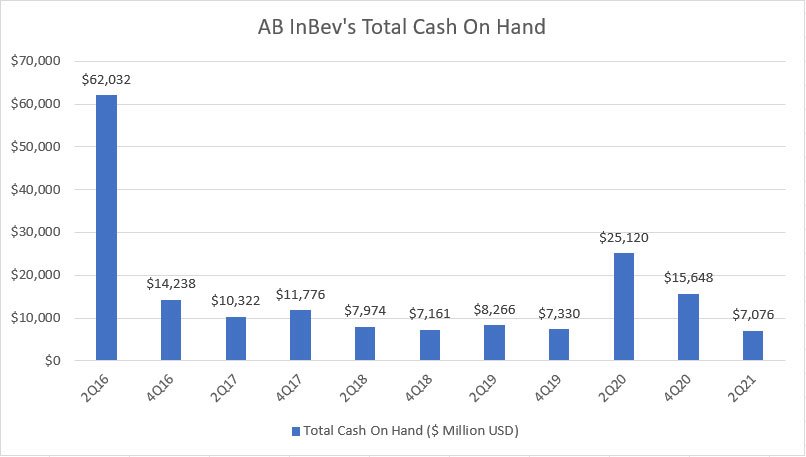
Let’s first look at AB InBev’s total cash on hand which is shown in the chart above for the period from FY2016 to FY2021.
ABI’s cash position consists of mainly cash and cash equivalents as well as short-term investments.
All told, AB InBev’s cash on hand was the highest back in 2Q 2016 at more than $60 billion as shown in the chart above.
A detailed investigation of AB InBev’s 2Q 2016 financial report revealed that the cash was actually for the proposed combination with SABMiller.
At that time, the massive cash was temporarily invested in US Treasury Bill pending the closing of the merger.
As seen from the chart, AB InBev’s cash on hand fell considerably in 4Q 2016 to only $14 billion when the combination with SABMiller was completed.
As of 2021 Q2, AB InBev’s cash on hand totaled only $7 billion, which was about 50% lower compared to the prior quarter.
Also worth mentioning is that AB InBev’s cash position increased considerably in fiscal 2Q 2020 to $25 billion during the height of the COVID-19 pandemic around the world.
When COVID-19 began to hit in early 2020, AB InBev had to shore up its liquidity to maintain its financial flexibility.
All in all, ABI’s cash position had normalized to about $7 billion USD as of fiscal 2Q 2021 in a post-pandemic world.
Breakdown of AB InBev’s Cash On Hand
AB InBev’s cash on hand breakdown
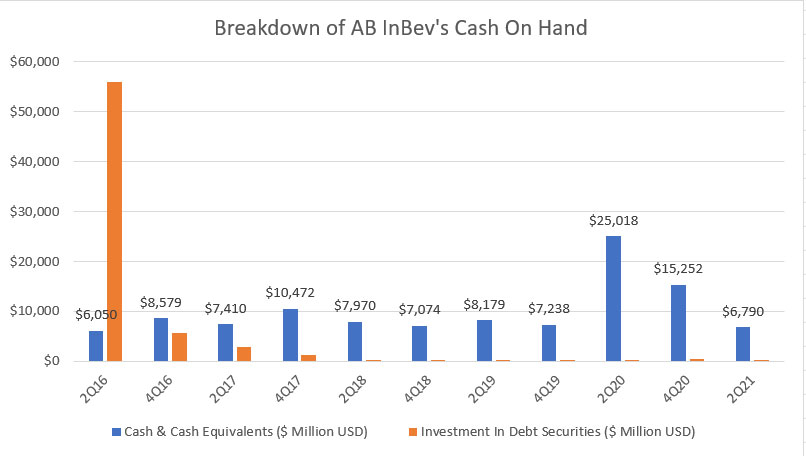
There are 2 types of cash in AB InBev’s balance sheets and they are cash & cash equivalents and debt securities as shown in the chart above.
Between FY2016 and FY2021, AB InBev’s cash on hand has been mainly in cash & cash equivalents except in 2Q 2016.
As mentioned, AB InBev held a massive cash position in debt securities in FY2016 for the purpose of the SABMiller combination.
After the merger was completed, AB InBev’s investment in debt securities was back to normal levels in subsequent quarters and even faded into obscurity as it moved closer to 2020.
On the other hand, AB InBev’s cash & cash equivalents remained at $7 billion but increased substantially to $25 billion during the height of the COVID-19 pandemic in 2Q 2020 before normalizing in subsequent quarters.
As of 2Q 2021, AB InBev’s cash & cash equivalents had normalized to around $7 billion.
AB InBev’s Net Cash From Operating Activities
AB InBev’s net cash from operating activities
While AB InBev may have $7 billion of cash balance, it would not mean anything if its core business operations failed to produce any cash and the businesses needed to use its cash balance to stay afloat.
In this case, we will look at AB InBev’s net cash from operating activities to see if its core businesses produced any meaningful cash flow.
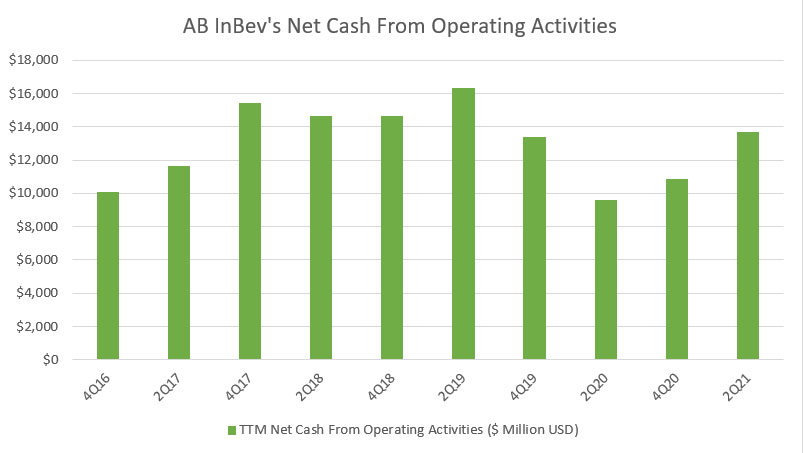
According to the chart above, AB InBev’s operating activities have been able to generate meaningful cash flow between FY2016 and FY2021.
That said, AB InBev produced at least $10 billion of net cash from its core activities on a trailing 12-month (TTM) basis.
As of 2021 Q2, AB InBev’s net cash from operating activities totaled nearly $14 billion on a TTM basis.
Keep in mind that this net cash was net of all cash inflow and outflow for only operating activities, including changes in working capital, interest paid and taxes paid.
This net cash has not taken into account the cash outflow as a result of capital expenditures, investments, dividends paid, debt repayment, etc.
We will come to this topic later.
Since AB InBev has been operating cash flow positive, the company is self-sufficient and does not rely on external capital injections such as debt and equity to keep the business afloat.
In fact, the extra cash generated from operating activities may even help to grow AB InBev’s existing cash on hand.
Also worth mentioning is that ABI is valued at roughly 8X the TTM operating cash flow at a market cap of about $110 billion as of Jan 2022.
AB InBev’s Operating Cash Flow Margin
AB InBev’s operating cash flow margin
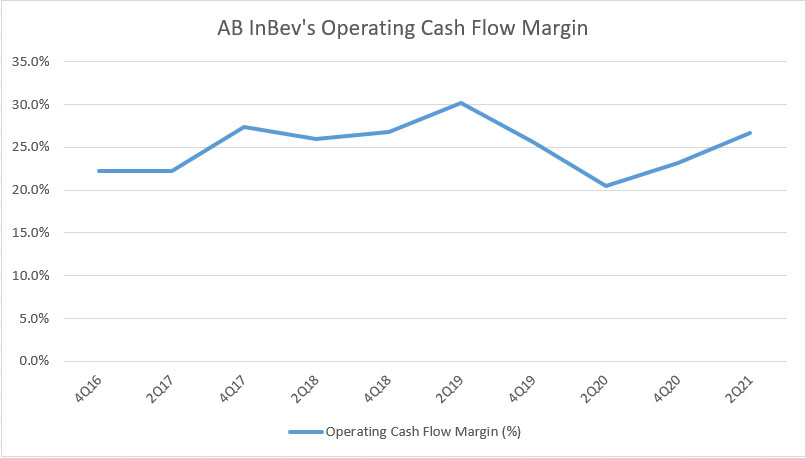
In terms of operating cash flow margin, ABI’s figure came in at 25% on average over the last 4 years.
As of fiscal 2021 3Q, AB InBev’s operating cash flow margin totaled 27%, slightly higher than the historical average.
At this margin, ABI’s operating cash flow generation capability is considered excellent as more than 1/4th of the firm’s revenue is turned into cash.
AB InBev’s Free Cash Flow
AB InBev’s free cash flow
While AB InBev has been having positive net cash from operating activities, it is still possible for the company to have negative free cash flow if it spent more cash than it produced on investments such as capital expenditures and acquisitions.
In this case, we will look at AB InBev’s free cash flow to find out how much cash is left after accounting for cash spent on capital expenditures.
Keep in mind that capital expenditures include both cash outflow and also cash inflow from sales of assets, etc.
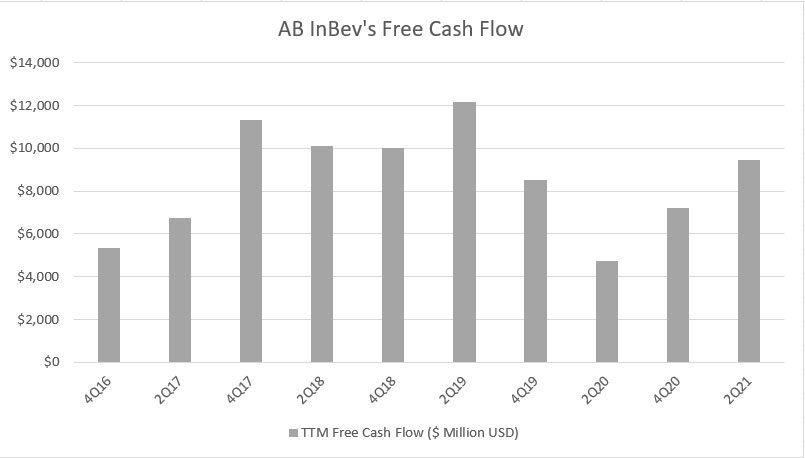
All told, AB InBev’s free cash flow has been positive between FY2016 and FY2021.
On average, AB InBev’s free cash flow totaled about $9 billion on a TTM basis.
As of 2021 Q2, AB InBev’s free cash flow totaled $9.4 billion, a record high since fiscal 2020.
As ABI has been free cash flow positive, the company is self-sufficient and does not need to rely on external capital to keep its operations afloat.
Moreover, ABI also can pay off the debt and return the extra cash to shareholders as cash dividends with the free cash flow.
Also worth mentioning is that AB InBev is valued at roughly 12X the TTM free cash flow given the $110 billion of market capitalization reported as of Jan 2022.
AB InBev’s Free Cash Flow Margin
AB InBev’s free cash flow margin
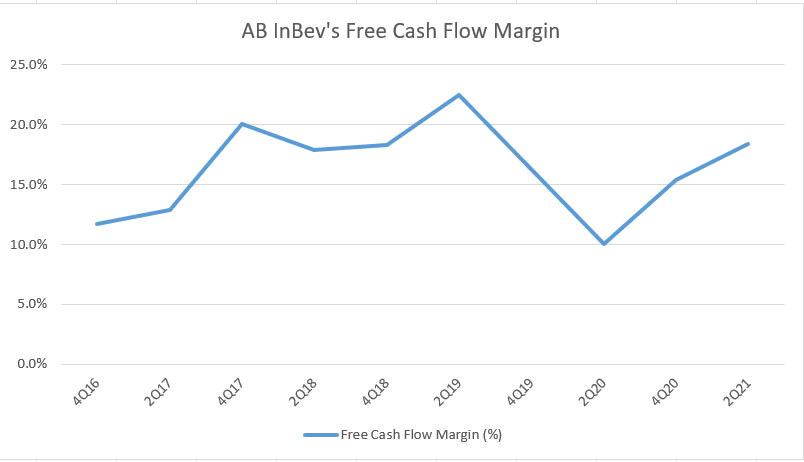
ABI’s free cash flow margin dived considerably in fiscal 2020 Q2 to only 10% on a TTM basis.
However, the ratio rebounded in subsequent quarters and reached 18% as of fiscal Q2 2021, a record high since fiscal 2020.
At this margin, AB InBev has an excellent free cash flow conversion rate, at roughly $1.00 of revenue to $0.18 of free cash flow.
AB InBev’s Net Cash From Financing Activities
AB InBev’s net cash from financing activities
Since AB InBev’s free cash flow generation has been quite strong, the company should not have raised external capital through debt or equity issuance.
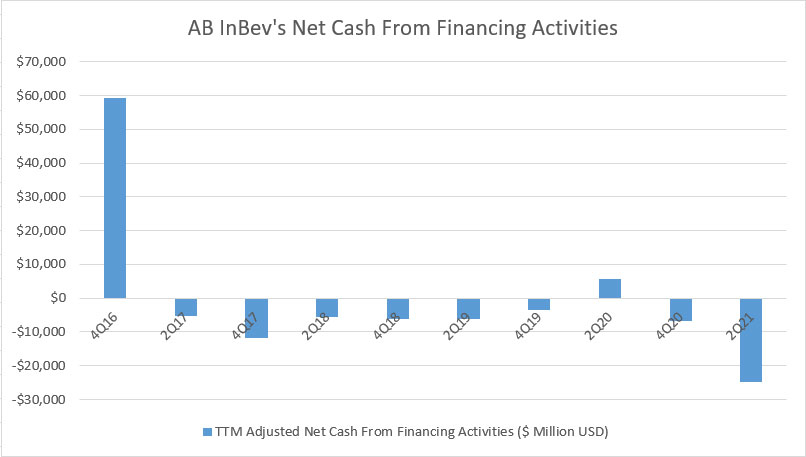
To find out, we will look at AB InBev’s net cash from financing activities which is shown in the chart above for the period from FY2016 to FY2021.
As seen from the chart, AB InBev’s net cash from financing activities has been negative for almost the entire period from fiscal 2016 to 2021, illustrating the company’s cash outflow through financing activities.
In this case, AB InBev has been paying down debt as reflected by the negative net cash from financing activities.
The 4Q 2016 quarter was an exception for which AB InBev was raising capital to buy SABMiller.
Similarly, AB InBev also borrowed a considerable amount of debt in 2Q 2020 to raise its cash position to maintain its financial flexibility in preparation for the COVID-19 disruption.
Other than these 2 quarters, AB InBev was seen paying down debt (net cash has been adjusted to exclude the effect of dividends).
As of fiscal 2Q 2021, ABI’s net cash from financing activities came in at a massive amount of -$25 billion USD, indicating that the company paid back a considerable amount of debt.
In short, AB InBev has been paying down debt to reduce the huge debt load.
Summary
AB InBev’s cash on hand has been normalized to $7 billion in post-pandemic world.
AB InBev’s cash position was mainly made up of cash and cash equivalents, at over 99% in most financial periods.
AB InBev generated positive net cash from operating activities, illustrating the immersed cash-generating capability of the company’s core businesses.
AB InBev’s free cash flow also has been tremendously impressive even after accounting for capital expenditures.
AB InBev is seen paying down debt all these years as shown in the negative net cash from financing activities.
In short, ABI is a cash printing machine and is definitely a cash cow.
References and Credits
1. All financial figures in this article were referenced and obtained from AB Inbev’s annual and half-year filings available in AB InBev’s Financial Reports.
2. Featured images in this article are used under creative commons license and sourced from the following websites: song zhen and Dushan Hanuska.
Other Statistics That May Help
Disclosure
The content in this article is for informational purposes only and is neither a recommendation nor a piece of financial advice to purchase a stock.
If you find the information in this article helpful, please consider sharing it on social media and also provide a link back to this article from any website so that more articles like this one can be created in the future. Thank you!
