Microchips. Pexels Images.
ARM Holdings is a British multinational semiconductor and software design company, now owned by SoftBank Group. ARM doesn’t manufacture chips but designs them and licenses the IP to other companies, who then incorporate ARM’s designs into their products. This business model has given ARM a vast global reach in the semiconductor industry.
The company’s global operation is structured around licensing its chip designs to hundreds of partners, including the world’s leading semiconductor and systems companies. These partners, in turn, produce and sell ARM-based chips. This vast network of partners has helped ARM’s architecture to become ubiquitous across the globe. ARM’s technology is at the heart of over 100 billion chips shipped to date, underscoring its vast impact on the worldwide tech industry.
ARM’s global reach is also facilitated by its international presence, with offices worldwide, including the United States, mainland Europe, and Asia, allowing it to support its local partners. This global network of offices supports licensing and design and plays a crucial role in research and development, ensuring ARM remains at the forefront of technology.
This article looks at ARM’s sales by country. For your information, ARM derives the majority of its revenue from only a handful of countries. The bulk of ARM’s revenue comes from only two regions, namely North America and Asia. The revenue from these regions alone made up over 90% of ARM’s total sales in fiscal year 2025.
Let’s look at the numbers!
For other key statistics of ARM Holdings, you may find more resources on these pages:
Revenue
Please use the table of contents to navigate this page.
Table Of Contents
Definitions And Overview
O2. How Does ARM Expand Globally?
Revenue By Region
A1. Revenue from the U.S., China, Taiwan, and South Korea
A2. Percentage of Revenue from the U.S., China, Taiwan, and South Korea
Revenue By Region Growth Rates
B1. YoY Growth Rates of Revenue from the U.S., China, Taiwan, and South Korea
Summary And Reference
S1. Insight
S2. References and Credits
S3. Disclosure
Definitions
To help readers understand the content better, the following terms and glossaries have been provided.
Revenue By Country: According to ARM’s fiscal year 2025 annual report, ARM defines its revenue by geographic region as revenue allocated to individual countries based on the principal headquarters of the customers.
Therefore, the geographical locations are not necessarily indicative of the country in which the customer sells products containing ARM’s technology IP.
How Does ARM Expand Globally?
ARM Holdings, now commonly referred to as ARM, has pursued global expansion through strategic partnerships, licensing agreements, and innovation in semiconductor technology. Here’s a brief overview of how ARM has achieved its global presence:
-
Licensing Model: Unlike companies that manufacture their chips, ARM designs the architecture for ARM processors and then licenses these designs to semiconductor companies worldwide. This model allows ARM to spread its technology globally without needing physical manufacturing facilities in different countries.
-
Innovation and R&D: ARM heavily invests in research and development to stay at the forefront of chip technology. This commitment to innovation attracts companies globally, ensuring ARM’s designs remain integral to various electronic devices, from smartphones to servers.
-
Strategic Partnerships: ARM has partnered with many tech companies worldwide. These partnerships broaden its reach and ensure its architectures are compatible with various software and other hardware components, making ARM a preferred choice for many manufacturers.
-
Focus on Emerging Technologies: ARM has positioned itself as a leader in emerging technologies such as the Internet of Things (IoT), autonomous vehicles, and 5G technology. By focusing on these growth areas, ARM ensures its relevance and expansion into new markets and industries around the globe.
-
Global Talent and Presence: ARM has research and development centres and offices in various countries across Europe, North America, and Asia. This global presence facilitates closer collaboration with clients and partners and allows ARM to tap into a vast pool of talent worldwide.
ARM has established a robust global presence through these strategies, making its technology foundational to the modern digital world.
Revenue from the United States, China, Taiwan, and South Korea
ARM-revenue-by-country
(click image to expand)
The definition of ARM’s revenue by country is available here: revenue by country.
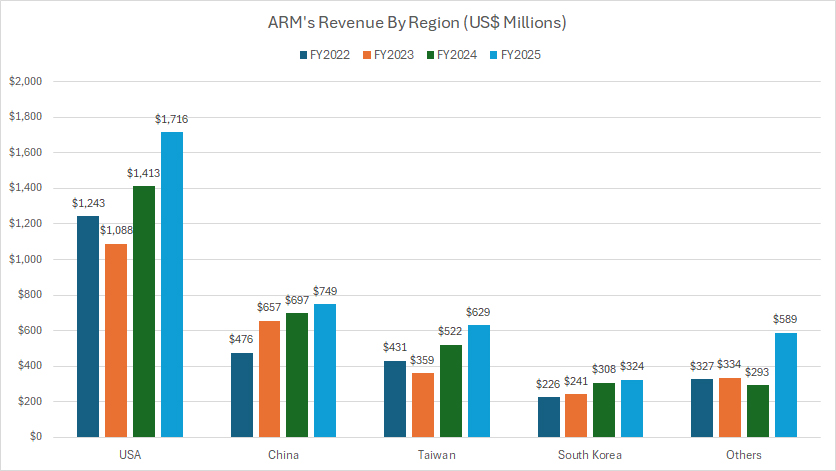
The United States is ARM’s largest source of income and has contributed an average of more than $1.0 billion in revenue to the company since 2022.
China, excluding Taiwan, is ARM’s second largest revenue source, contributing over $600 million to the company on average over the last 3 years. Not further behind is Taiwan, whose revenue topped over $500 million since fiscal year 2024.
South Korea is another Asian country which has significantly contributed sales to ARM, averaging around $300 million annually.
The following table shows more detailed results:
Revenue By Country in FY2025:
| Country | Revenue (US$ Millions) |
|---|---|
| USA | $1,716 |
| China | $749 |
| Taiwan | $629 |
| South Korea | $324 |
| Other Countries | $589 |
| Consolidated | $4,007 |
3-Year Trend from FY2022 to FY2025:
| Country | Revenue (US$ Millions) | % Changes |
|---|---|---|
| USA | $1,243 – $1,716 | +38.1% |
| China | $476 – $749 | +57.4% |
| Taiwan | $431 – $629 | +45.9% |
| South Korea | $226 – $324 | +43.4% |
| Other Countries | $327 – $589 | +89.1% |
| Consolidated | $2,703 – $4,007 | +48.2% |
Percentage of Revenue from the United States, China, Taiwan, and South Korea
ARM-revenue-by-country-in-percentage
(click image to expand)
The definition of ARM’s revenue by country is available here: revenue by country.
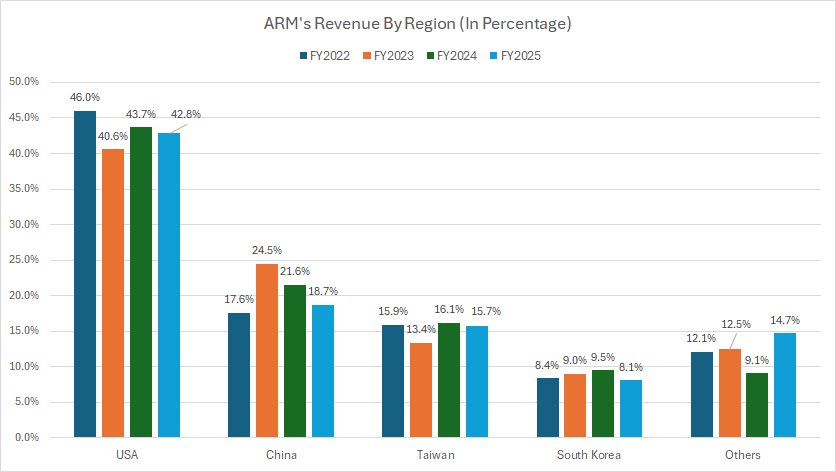
From the perspective of percentage, the United States has contributed the highest portion of revenue, accounting for more than 40% of the total over the past three years.
On the other hand, the revenue contribution from China has averaged 20% since 2022, while Taiwan makes up around 15% of the total.
South Korea’s sales contribution has been steady at around 9%. Therefore, ARM’s revenue from the U.S. and Asia alone made up over 80% of the company’s total sales.
The following table shows more detailed results:
Revenue Share By Country in FY2025:
| Country | Revenue Share (%) |
|---|---|
| USA | 42.8% |
| China | 18.7% |
| Taiwan | 15.7% |
| South Korea | 8.1% |
| Other Countries | 14.7% |
| Consolidated | 100% |
3-Year Trend from FY2022 to FY2025:
| Country | Revenue Share (%) | % Point Changes |
|---|---|---|
| USA | 46% – 42.8% | -3.2% |
| China | 17.6% – 18.7% | +1.1% |
| Taiwan | 15.9% – 15.7% | -0.2% |
| South Korea | 8.4% – 8.1% | -0.3% |
| Other Countries | 12.1% – 14.7% | +2.6% |
| Consolidated | – | – |
YoY Growth Rates of Revenue from the United States, China, Taiwan, and South Korea
ARM-revenue-by-country-yoy-growth-rates
(click image to expand)
The definition of ARM’s revenue by country is available here: revenue by country.
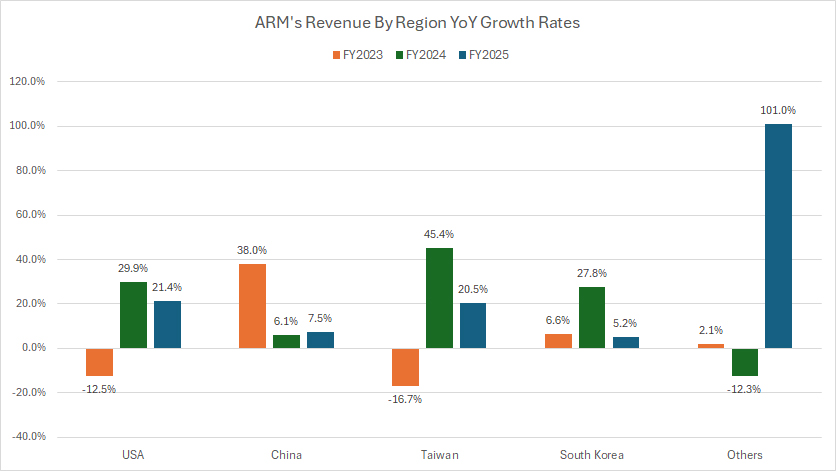
From the perspective of YoY growth rate, revenue from China and Taiwan has reported the highest growth rates over the past three years, topping more than 15% on average.
The following table shows more detailed results:
Revenue Growth By Country in FY2025:
| Country | Revenue Growth (%) |
|---|---|
| USA | 21.4% |
| China | 7.5% |
| Taiwan | 20.5 |
| South Korea | 5.2% |
| Other Countries | 101.0% |
| Consolidated | 23.9% |
3-Year Average from FY2023 to FY2025:
| Country | Revenue Growth (%) |
|---|---|
| USA | 12.9% |
| China | 17.2% |
| Taiwan | 16.4 |
| South Korea | 13.2% |
| Other Countries | 30.3% |
| Consolidated | 14.6% |
Insight
ARM Holdings’ financial performance underscores its strong positioning within the global semiconductor industry, particularly through its licensing-based business model. Unlike traditional semiconductor companies that manufacture chips, ARM exclusively designs chip architectures and licenses them to a vast array of partners, ranging from major technology firms to specialized semiconductor companies.
This approach allows ARM to achieve extensive market penetration without the capital-intensive requirements associated with fabrication plants. Over time, ARM has solidified itself as an indispensable player in sectors such as mobile computing, data centers, and emerging technologies like IoT and AI-driven processors.
A closer look at ARM’s revenue distribution by country in fiscal year 2025 reveals significant concentration within a few key regions. The United States remains the largest contributor to ARM’s revenue, accounting for approximately $1.7 billion, nearly 43% of its total revenue. This dominance reflects the strong presence of U.S.-based technology firms that rely on ARM’s intellectual property, particularly in mobile processors and cloud computing solutions.
Meanwhile, China holds the second position, contributing $749 million, or about 19% of the company’s total revenue. Despite geopolitical uncertainties surrounding chip technology and trade restrictions, ARM continues to derive substantial sales from Chinese clients. Taiwan and South Korea also play crucial roles, with revenues of $629 million and $324 million, respectively. These countries are home to prominent semiconductor manufacturers, including TSMC and Samsung, which integrate ARM’s architecture into their chip offerings.
Analyzing revenue growth patterns reveals robust expansion across multiple regions. Notably, ARM’s three-year average revenue growth rate in China has exceeded 17%, driven by continued demand for ARM-based chips in consumer electronics and industrial applications. Taiwan has also demonstrated impressive growth, averaging 16.4% annually.
The United States, while maintaining its leadership position, has grown at a steadier rate of 12.9%, reflecting mature market saturation yet sustained demand in high-performance computing and mobile devices. South Korea’s revenue growth has been relatively stable at 13.2%, tied to its global role in semiconductor manufacturing.
ARM’s global expansion strategy revolves around deepening its presence in high-growth segments while mitigating regional challenges. Its licensing model enables scalability without direct exposure to manufacturing risks, but the company must navigate geopolitical tensions, particularly between the U.S. and China.
ARM’s ability to remain neutral while supplying technology to multiple nations has historically been a strength, though regulatory scrutiny over semiconductor exports remains a potential hurdle. Furthermore, ARM’s continued investment in R&D ensures that its chip designs remain cutting-edge, reinforcing its competitive advantage. With emerging technologies such as AI-driven computing, autonomous vehicles, and edge computing gaining traction, ARM is well-positioned to capture future revenue streams beyond its traditional markets.
Overall, ARM’s fiscal year 2025 results showcase a company that has successfully leveraged a unique business model to maintain dominance across critical global semiconductor markets. While challenges persist—ranging from competitive pressures to geopolitical uncertainties—its established partnerships, ongoing innovation, and diversified revenue sources provide a solid foundation for sustained growth.
References and Credits
1. All financial figures presented were obtained and referenced from ARM’s quarterly and annual reports published on the company’s investor relations page: ARM Financial Reports.
2. Pexels Images.
Disclosure
We may use artificial intelligence (AI) tools to assist us in writing some of the text in this article. However, the data is directly obtained from original sources and meticulously cross-checked by our editors multiple times to ensure its accuracy and reliability.
If you find the information in this article helpful, please consider sharing it on social media. Additionally, providing a link back to this article from any website can help us create more content like this in the future.
Thank you for your support and engagement! Your involvement helps us continue to provide high-quality, reliable content.


