3D printing conference & expo. Flickr Image.
This article compares the margins and profitability between 3D Systems (DDD) and Stratasys (SSYS).
3D Systems and Stratasys are leaders and early disruptors in additive manufacturing.
They offer innovative 3D printing solutions that cover the hardware part, such as 3D printers, and the software ecosystem that usually tags along with the printers.
The investment thesis that revolves around 3D Systems and Stratasys is the lucrative razor and blades business model, which offers stable and long-term recurring revenue.
In this aspect, the razor is the printer, while the blades will be the proprietary consumables that can only be provided by the respective company.
Therefore, 3D Systems and Stratasys operate in a highly lucrative industry.
Should the business take off, the share price would soar to the moon.
Without further delay, let’s head out to the following topics!
Please use the table of contents to navigate this page.
Table Of Contents
Revenue
A1. Total Revenue And Net Sales
GAAP Margins
B1. Gross Profit Margin
B2. Operating Profit Margin
B3. Net Profit Margin
Non-GAAP Margins
Cash Flow
D1. Operating Cash Flow Margin
D2. Free Cash Flow Margin
Conclusion And Reference
S1. Conclusion
S2. References and Credits
S3. Disclosure
Total Revenue And Net Sales
Total revenue and net sales
(click image to expand)
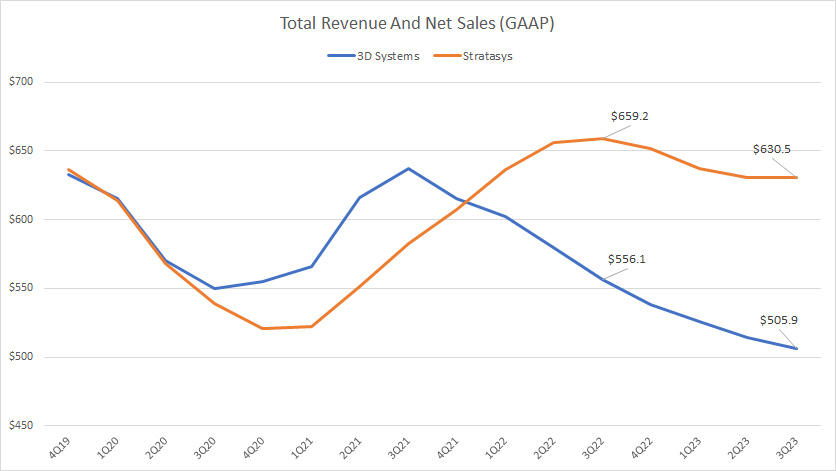
Stratasys earns slightly higher revenue than 3D Systems.
As of fiscal 3Q 2023, Stratasys’ total revenue reached US$630.5 million compared to 3D Systems’ total revenue of US$505.9 million on a TTM basis.
3D Systems used to earn much higher revenue. However, the company’s revenue figures have significantly declined in the post-pandemic era, highlighting the weaknesses of its business in the post-pandemic periods.
On the other hand, Stratasys’ sales have remained relatively intact during the same period, suggesting the resilience of its businesses in the post-pandemic periods.
Gross Profit Margin
Gross profit margin
(click image to expand)
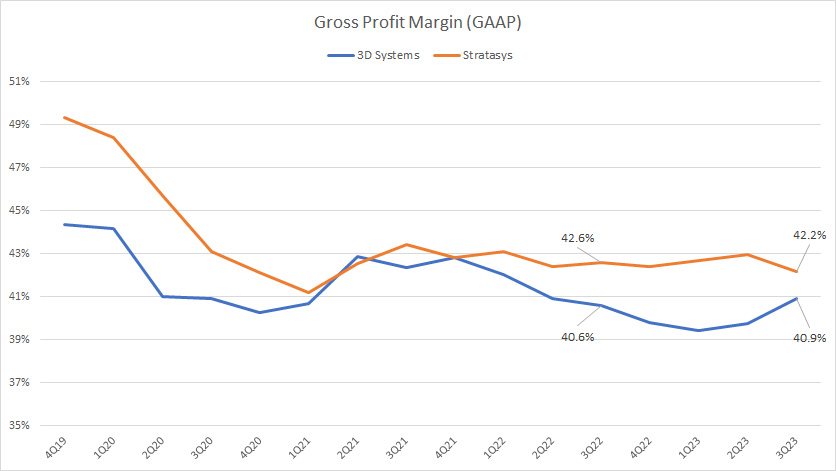
From the perspective of gross profit margin, both 3D Systems and Stratasys have nearly the same level of profitability.
Stratasys used to have much higher gross margins, notably at 50%.
However, Stratasys’ gross profit margins have significantly declined and totaled 42.2% as of 3Q 2023.
On the other hand, 3D Systems’ gross profit margins reached 40.9% as of 3Q 2023, only a bit lower than Stratasys’.
The gross profit margins of both companies have remained relatively stable in post-pandemic periods.
Operating Profit Margin
Operating profit margin
(click image to expand)
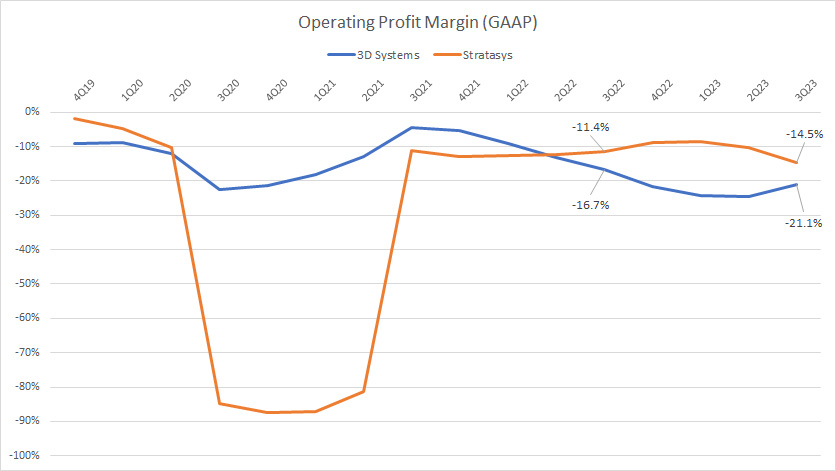
Stratasys and 3D Systems have nearly the same operating profit margins.
As of fiscal 3Q 2023, Stratasys’ operating profit margin reached -14.5%, while 3D Systems’ figure reached -21.1%.
As a result, 3D Systems’ operating profit margin is much worse than Stratasys’.
A noteworthy point is that both companies have operating losses in most fiscal years, suggesting the unprofitable nature of their businesses in most periods.
Net Profit Margin
Net profit margin
(click image to expand)
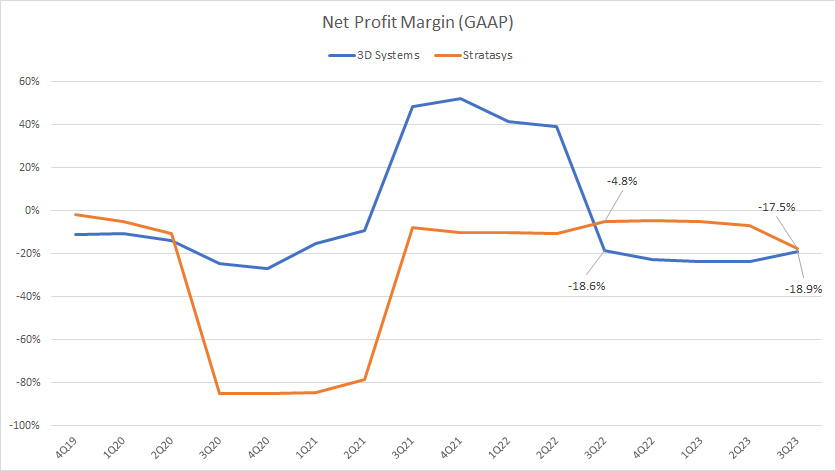
3D Systems and Stratasys have not been profitable when considering their net profit margins.
As of Q3 2023, 3D Systems’ net profit margin totaled -18.9%, while Stratasys’ figure came in at -17.5%, nearly at the same level as 3D Systems.
3D Systems’ positive net profit margin in fiscal 2021 was due primarily to the sales of several assets, including the firm’s subsidiaries.
Therefore, this particular gain in net income for 3D Systems was a one-time deal and would not recur.
Adjusted EBITDA Margin
Adjusted EBITDA margin
(click image to expand)
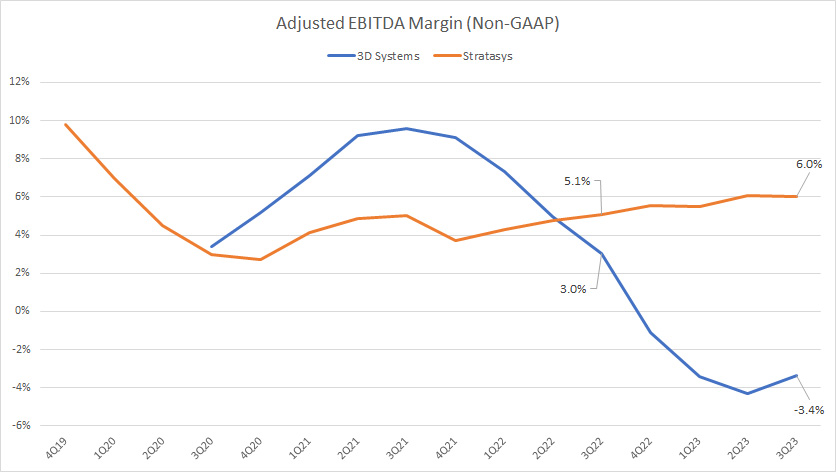
The respective companies compute the adjusted EBITDA margin.
Therefore, they may not be comparable on an apple-to-apple basis due to the different adjustment methods.
Nevertheless, according to the chart, 3D Systems used to have a much higher adjusted EBITDA margin than Stratasys, suggesting that the company generates much better cash earnings.
However, 3D Systems’ adjusted EBITDA margin has significantly declined in the post-pandemic era, while Stratasys’ adjusted EBITDA margin has steadily recovered.
As of 3Q 2023, 3D Systems’ adjusted EBITDA margin decreased to -3.4% compared to Stratasys’ figure of 6% for the same period.
Therefore, Stratasys generates much better cash earnings than 3D Systems does.
Operating Cash Flow Margin
Operating cash flow margin
(click image to expand)
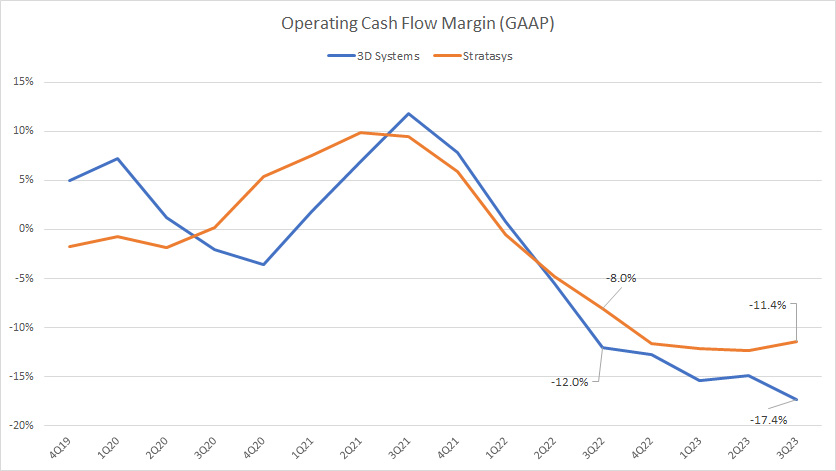
Both Stratasys and 3D Systems have poor cash flow, as the operating cash flow margins are mostly negative, indicating both companies’ poor operating cash flow.
As of 3Q 2023, Stratasys’ operating cash flow margin reached -11.4%, slightly better than 3D Systems’ operating cash flow margin of -17.4%.
In most fiscal years, Stratasys’ cash flow is marginally better than 3D Systems’ cash flow.
Free Cash Flow Margin
Free cash flow margin
(click image to expand)
Free cash flow is the difference between operating cash flow and capital expenditures.
Capital expenditures include only the cash spent on purchases of properties and equipment and exclude cash inflow from sales of assets such as business subsidiaries.
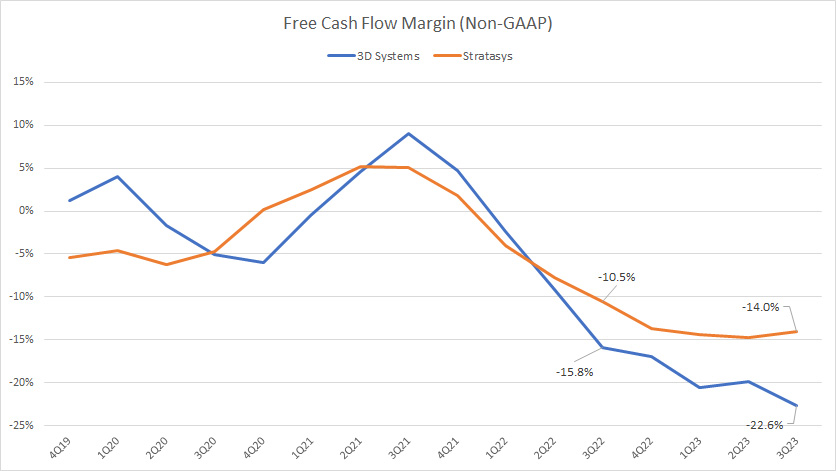
According to the chart, 3D Systems seems to have much worse free cash flow than Stratasys.
As of 3Q 2023, 3D Systems’ free cash flow margin declined to -22.6%, while Stratasys’ ratio was -14.0%, which was much better than 3D Systems’ ratio.
However, both companies produce negative free cash flow in most quarters, suggesting insufficient operating cash flow to cover the capital expenditures.
Summary
From a profitability perspective, Stratasys wins hands down.
This is evident from all of the better profitability metrics for Stratasys.
The difference was more profound in post-pandemic periods, in which Stratasys’ profit margins were particularly better than those of 3D Systems.
In the post-pandemic era, 3D Systems’ results have significantly declined for most profitability metrics.
Also, Stratasys leads marginally in cash flow generation, although it is still cash flow negative.
As a result, Stratasys’ market cap has been valued slightly higher than 3D Systems.
As of Dec 2023, Stratasys’ market cap was nearly US$1 billion, while 3D Systems’ market cap was slightly lower at US$900 million.
Credits and References
1. All financial figures in this article were obtained and referenced from financial filings available in the following locations:
i) SSYS Press Releases
ii) DDD Investor Relation
2. Featured images in this article are used under Creative Commons licenses and obtained from the following websites: 3D printing conference and expo and jello brain created by 3D printing.
Disclosure
References and examples such as tables, charts, and diagrams are constantly reviewed to avoid errors, but we cannot warrant the total correctness of all content.
The content in this article is for informational purposes only and is neither a recommendation nor a piece of financial advice to purchase a stock.
If you find the information in this article helpful, please consider sharing it on social media and provide a link to this article from any website so that more articles like this can be created.
Thank you!

