Suzuki Swift Sport. Flickr Image.
Maruti Suzuki is a leading automobile company in India with its head office located in New Delhi.
While Maruti Suzuki is publicly traded on the National Stock Exchange (NSE) and Bombay Stock Exchange (BSE), it is a subsidiary of Suzuki Motor Corporation (SMC).
In fact, it is the largest subsidiary of SMC based on Maruti’s production volume and sales revenue.
As of the end of FY21, SMC held approximately 56% of Maruti Suzuki’s equity according to Maruti’s FY21 annual report, thereby having a controlling interest in the firm.
While Maruti Suzuki is known primarily for its passenger vehicles, the company also produces a considerable number of commercial vehicles such as the Super Carry light truck.
Additionally, Maruti Suzuki’s vehicle sales to OEM partners also have exploded in recent years, thereby diversifying the company’s sales channels significantly.
All told, in this article, we will explore several statistics of Maruti Suzuki’s vehicle sales, which include the total sales volume, sales breakdown by segment and vehicle type, and growth rates.
Let’s look at the numbers!
Please use the table of contents to navigate this page.
Table Of Contents
Definitions And Overview
Consolidated Sales Results
B1. Total Vehicle Sales By Year
B2. Total Vehicle Sales By TTM
YoY Growth Rates
B3. YoY Growth Rates Of Total Vehicle Sales
Sales Results By Segment
C1. Domestic And Export Sales
C2. Domestic And Export Sales In Percentage
Domestic Sales Results
D1. Passanger Vehicle, Commercial Vehicle, And Sales To OEM
D2. Passanger Vehicle, Commercial Vehicle, And Sales To OEM In Percentage
Passanger Vehicle Sales Results
E1. Passenger Car, Utility Vehicle, And Van
E2. Passenger Car, Utility Vehicle, And Van In Percentage
Passanger Car Sales Results
F1. Mini, Compact, And Mid-Size Car Sales
F2. Mini, Compact, And Mid-Size Car Sales In Percentage
Summary And Reference
S1. Conclusion
S2. References and Credits
S3. Disclosure
Definitions
To help readers understand the content better, the following terms and glossaries have been provided.
Light Commercial Vehicles: Light commercial vehicles (LCVs) are motor vehicles designed primarily for transporting goods or specialized services but with a gross vehicle weight (GVW) not exceeding a certain limit, which varies from country to country.
Typically, this weight limit is up to 3.5 tonnes. Examples of light commercial vehicles include vans, pick-up trucks, and small lorries. Businesses often use these vehicles for deliveries, tradesmen for carrying tools and equipment, and, in some cases, for passenger transport as minibuses.
The design focuses on practicality, efficiency, and affordability, balancing the need for cargo space with the ease of driving and fuel economy associated with smaller vehicles.
OEM: OEM stands for Original Equipment Manufacturer. This term refers to companies that produce parts and equipment that another manufacturer may market. An OEM uses systems or components in another company’s end product.
For example, if you buy a car, many parts inside might have been made by different OEMs but are assembled and sold under the car manufacturer’s brand. OEMs operate in various industries, including the automobile, computer, and electronics sectors, creating products ranging from engine components to software.
Utility Vehicles: Utility vehicles are designed primarily for functionality and practical use rather than for speed, luxury, or aesthetics. These vehicles are often used for hauling goods and equipment, towing, and serving in various capacities on worksites, farms, and off-road settings.
Utility vehicles can range from pickup trucks and large SUVs to specialized vehicles such as dump trucks, tow trucks, and service/utility trucks equipped with specific tools and equipment for professional tasks.
Furthermore, the term can also encompass off-road utility vehicles, including ATVs (All-Terrain Vehicles) and UTVs (Utility Terrain Vehicles), which are designed for rugged off-road conditions and can be used for a variety of purposes, including recreation, farming, and security patrols, among others.
The key feature that defines these vehicles is their emphasis on utility and versatility, often prioritizing carrying capacity, durability, and off-road capability.
Mid-Size Passenger Cars: A mid-size passenger car is a car classification referring to a medium-sized vehicle, typically designed to balance features such as passenger space, cargo capacity, and fuel efficiency.
These cars are larger than compact sedans but smaller than full-size sedans, making them suitable for families, commuters, and individuals seeking a versatile vehicle for various needs. Mid-size sedans usually offer a comfortable seating arrangement for five passengers and are known for their practicality in urban and suburban settings.
Popular features often include advanced safety technologies, infotainment systems, and various engine options to cater to different driving preferences.
Vehicle Sales Breakdown
Maruti Suzuki’s vehicle sales breakdown
(click image to enlarge)
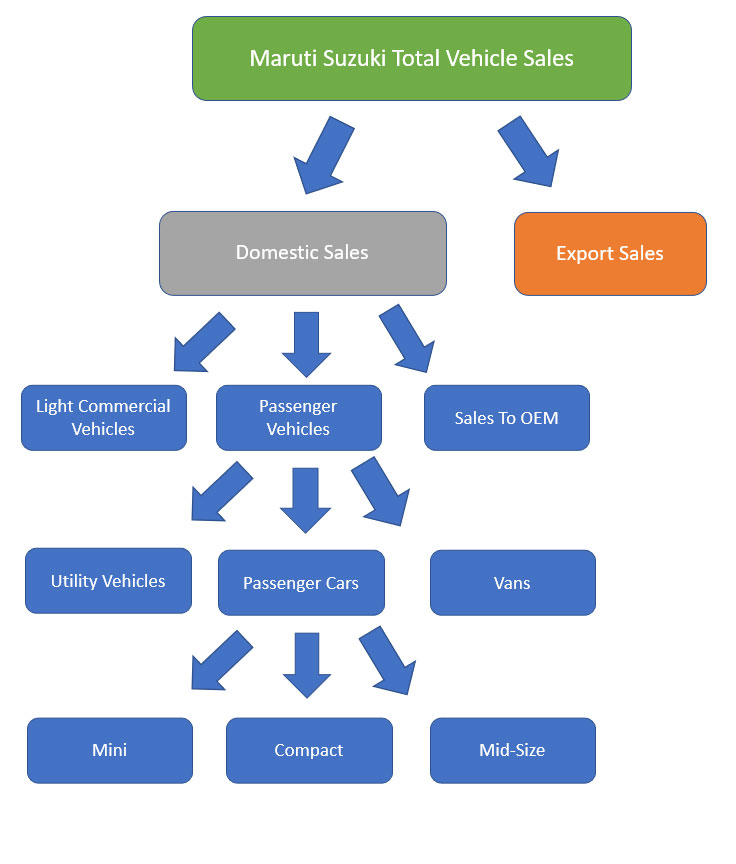
As seen in the diagram above, Maruti Suzuki’s vehicle sales are divided into 2 major categories, namely domestic volume and export volume.
Under the domestic volume, Maruti’s vehicle sales are further divided into passenger vehicles, light commercial vehicles, and OEM.
Of the 3 domestic segments, the passenger vehicles segment is the largest and it is further broken down into 3 more categories which are passenger cars, utility vehicles, and vans.
Similarly, Maruti’s passenger car segment is the largest among all 3 vehicle types, and this segment is made up of car types such as the mini, compact, and mid-size car segments.
Again, the compact segment is the largest of all categories under the passenger car segment, outselling the rest of the segment by nearly a 3-to-1 ratio as seen in the following discussions.
Total Vehicle Sales By Year
Maruti total vehicle sales by year
(click image to enlarge)
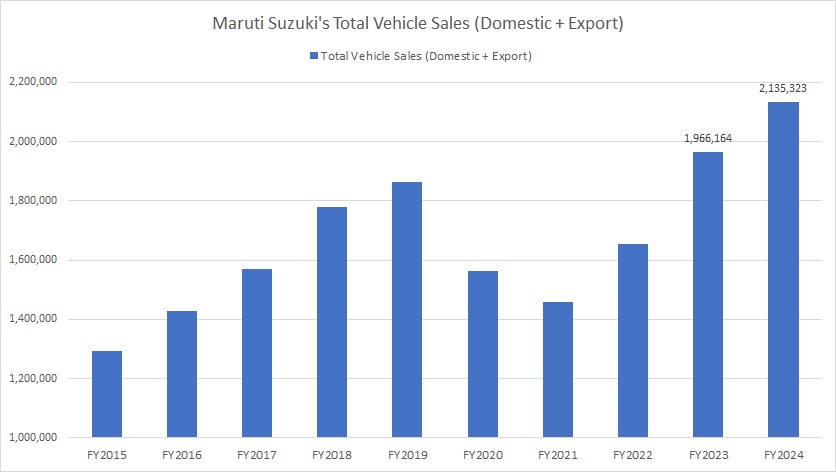
On a consolidated basis, Maruti Suzuki’s total vehicle sales exceeded two million units in fiscal year 2024 for the first time in the last decade, up 9% over fiscal year 2023.
During the COVID-19 pandemic, Maruti Suzuki’s vehicle sales were badly affected, dwindling to slightly over 1.4 million units in fiscal year 2021.
However, since fiscal year 2021, Maruti Suzuki’s total vehicle sales have slowlt recovered, with the latest sales result even surpassing pre-COVID levels.
Total Vehicle Sales By TTM
Maruti total vehicle sales by TTM
(click image to enlarge)
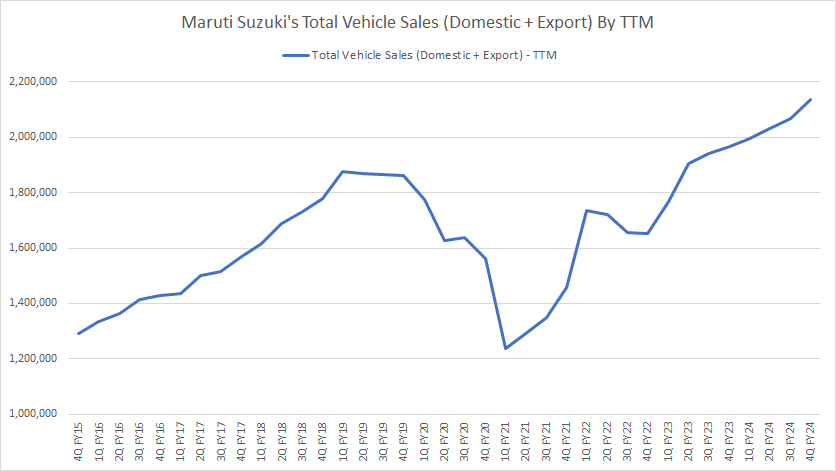
The TTM plot above is a more refined version of the annual plot.
As shown, Maruti Suzuki’s total vehicle sales were badly impacted during the COVID period but have recovered remarkably during the post-pandemic periods.
As of fiscal 4Q 2024, Maruti Suzuki’s total vehicle sales climbed over 2.0 million units on a TTM basis, representing a considerable rise over the same period a year ago.
YoY Growth Rates Of Total Vehicle Sales
maruti-suzuki-yoy-growth-rates-of-total-vehicle-sales
(click image to expand)
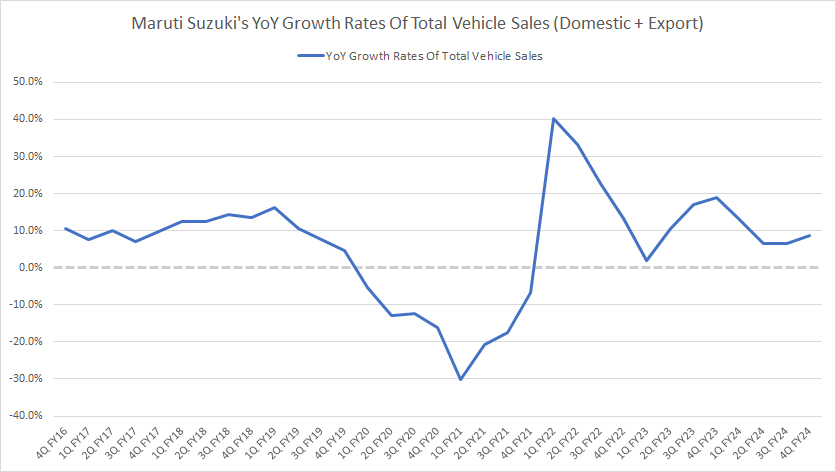
As shown in the chart above, Maruti Suzuki’s YoY growth rates of total vehicle sales were mainly negative during the COVID crisis between fiscal year 2019 and 2022.
However, in post-COVID time after fiscal year 2022, the YoY growth rates of total vehicle sales have slowly risen to positive figures. Since then, the YoY growth rates have been mostly positive.
On average, Maruti Suzuki’s YoY growth rates of total vehicle sales have measured 16% in each quarter since 1Q FY2022.
Domestic And Export Sales
maruti-suzuki-domestic-and-export-vehicle-sales
(click image to expand)
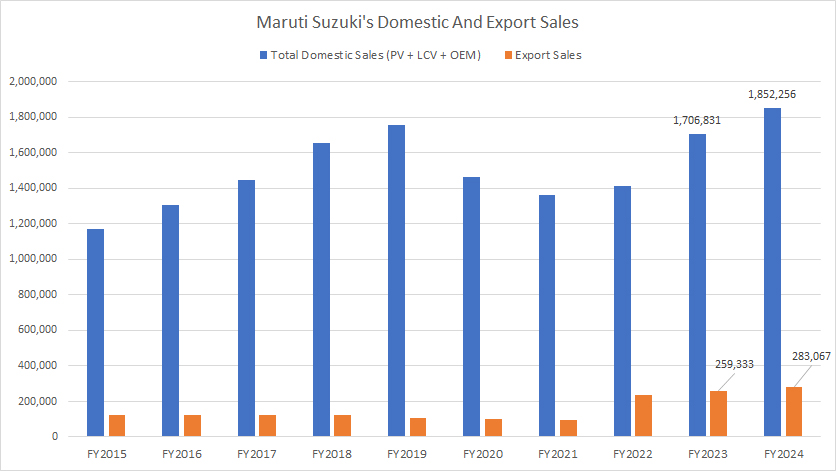
Maruti Suzuki’s total vehicle sales are divided into two major categories, namely domestic and export sales.
Domestic sales refer to sales performed in India while export sales are vehicles shipped out of India to other countries.
That said, we can see that the majority of Maruti Suzuki’s vehicle sales are sales performed in the domestic market of India.
As of fiscal year 2024, Maruti Suzuki’s domestic vehicle sales soared to 1.85 million units, a rise of 8% from 1.71 million units in fiscal year 2023. In addition, the latest result represents a significant climb over the results of pre-pandemic periods.
While domestic sales have greatly recovered, Maruti Suzuki’s export sales have done even better. As seen, Maruti Suzuki’s export sales have more than tripled since fiscal year 2021, reaching a record figure of 283 thousand units as of the end of fiscal year 2024, an all-time high since FY2015.
Despite the massive growth in export sales recently, the sales figure is only one-sixth the domestic sales figure in fiscal year 2024, indicating that there is much room to grow for the international market.
Domestic And Export Sales In Percentage
maruti-suzuki-domestic-and-export-vehicle-sales-in-percentage
(click image to expand)
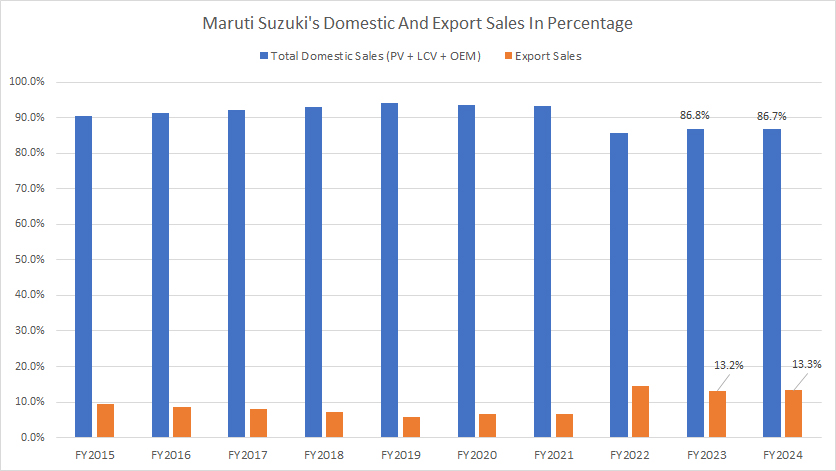
In terms of percentage, Maruti Suzuki’s domestic vehicle sales accounted for about 86.7% of the total volume in fiscal year 2024, making the domestic segment the largest sales contributor to the company.
Compared to export sales which made up just 13.3% of the total volume in fiscal year 2024, Maruti Suzuki’s domestic market is definitely much bigger.
A noticeable trend is the decrease in the percentage of the domestic vehicle sales over time. As seen, the domestic sales contribution has declined from over 90% since 2015 to several record low in the past few years, illustrating the growing importance of the company’s other sales channels, the international market in particular.
Passanger Vehicle, Commercial Vehicle, And Sales To OEM
maruti-suzuki-passenger-and-commercial-vehicle-sales-and-sales-to-OEM
(click image to expand)
The definitions of light commercial vehicles (LCV) and OEM are available here: LCV and OEM.
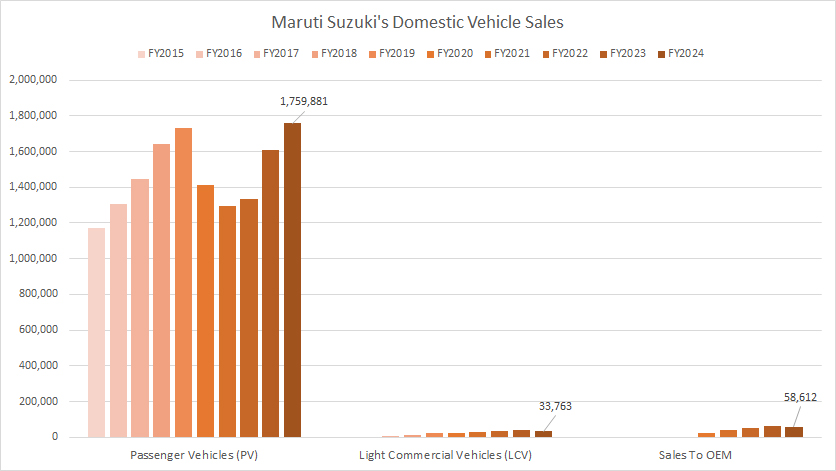
Maruti Suzuki’s domestic market is made up of sales of passenger vehicles,light commercial vehicles, and sales to OEM.
However, passenger vehicle sales have contributed to the majority of the domestic volume, boasting 1.76 million units in fiscal year 2024, the highest figure ever reported over the last decade.
Also, Maruti Suzuki’s passenger vehicle volume have significantly recovered in post-pandemic periods since fiscal year 2021, illustrating the surging demand for passenger vehicles in India after the pandemic.
On the other hand, Maruti Suzuki’s sales of light commercial vehicles (LCV) came in at only 34 thousand units in fiscal year 2024, down slightly over FY2023. Compared to passenger vehicles, the Indian automaker’s LCV sales are far smaller, and have even declined over the last few years, illustrating the weak market position of the automaker within the commercial vehicle segment in India. The good news is that Maruti Suzuki’s sales of light commercial vehicles have significantly improved over the last decade.
Similarly, Maruti Suzuki commands only a small number of sales under the OEM sector. The company’s OEM sales figure was close to 59 thousand units in fiscal year 2024. Although OEM sales are small, it is twice the number of sales of commercial vehicles in fiscal year 2024. Therefore, there might be better potential in market share within the OEM segment compared to the commercial vehicle segment for Maruti Suzuki.
Passanger Vehicle, Commercial Vehicle, And Sales To OEM In Percentage
maruti-suzuki-passenger-and-commercial-vehicle-sales-and-sales-to-OEM-in-percentage
(click image to expand)
The definitions of light commercial vehicles (LCV) and OEM are available here: LCV and OEM.
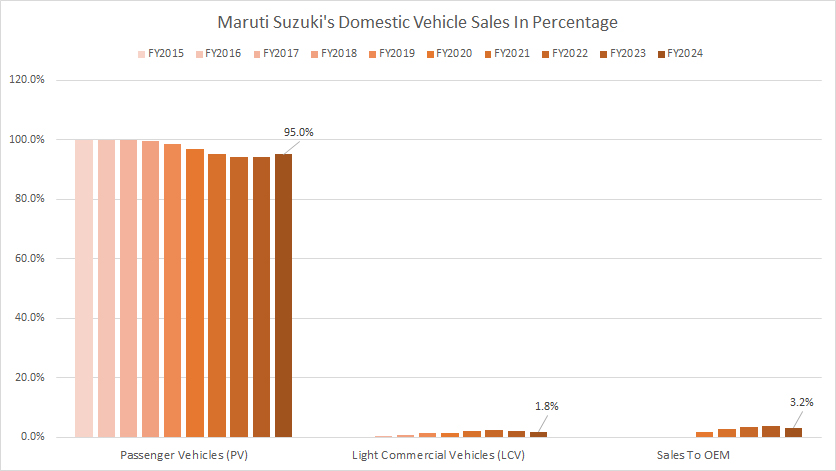
From the perspective of percentage, Maruti Suzuki’s passenger vehicle segment has contributed to nearly the entire domestic sales volume. In fiscal year 2024, the company’s passenger vehicle segment formed as much as 95% of the total domestic volume. However, this ratio has slightly declined since 2015, from 100% to the latest 95%, as shown in the chart above.
On the other hand, Maruti Suzuki’s sales of light commercial vehicles formed just 1.8% of the company’s total domestic volume in fiscal year 2024, while OEM sales made up 3.2% in the same period.
Over the last decade, the contribution from these two segments have significantly risen, underscoring the strategy of the Indian automaker to diversify its domestic sales channel.
Sales Of Passenger Cars, Utility Vehicles And Vans
Maruti passenger car, utility vehicle and van sales
(click image to enlarge)
The definition of utility vehicles (UV) is available here: utility vehicles.
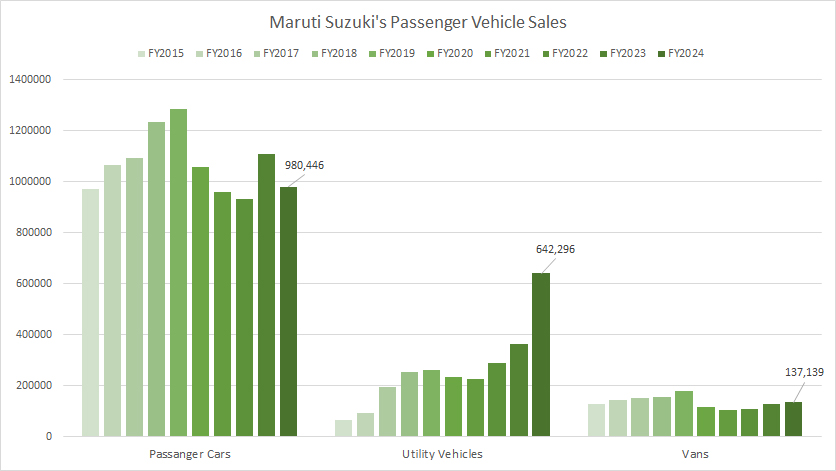
Within the passenger vehicle segment, Maruti Suzuki’s sales of passenger cars are among the largest, topping 980 thousand units in fiscal year 2024.
Maruti’s sales of utility vehicle came in second place, totaling 642 thousand units in fiscal year 2024, only slightly behind the sales volume of passenger cars.
Van sales are the lowest within the passenger vehicle segment, totaling just 137 thousand units in fiscal year 2024.
Among the 3 vehicle types under the passenger vehicle sector, Maruti’s sales of utility vehicles have grown exceptionally well. As shown, since fiscal year 2015, Maruti’s sales of utility vehicle have grown by 9.0X, from just 70 thousand units in 2015 to over 600 thousand units as of 2024.
The growth of utility vehicles was particularly obvious in fiscal year 2024 when it grew by 75% year-over-year, the highest figure ever recorded over the last decade. Some of Maruti Suzuki’s major brand names under the utility vehicle segment are Ertiga, Gypsy, S-Cross, Vitara Brezza, and XL6.
On the other hand, the sales of both passenger car and van segments have remained roughly flat.
Sales Of Passenger Cars, Utility Vehicles, And Vans In Percentage
Maruti passenger car, utility vehicle and van sales in percentage
(click image to enlarge)
The definition of utility vehicles (UV) is available here: utility vehicles.
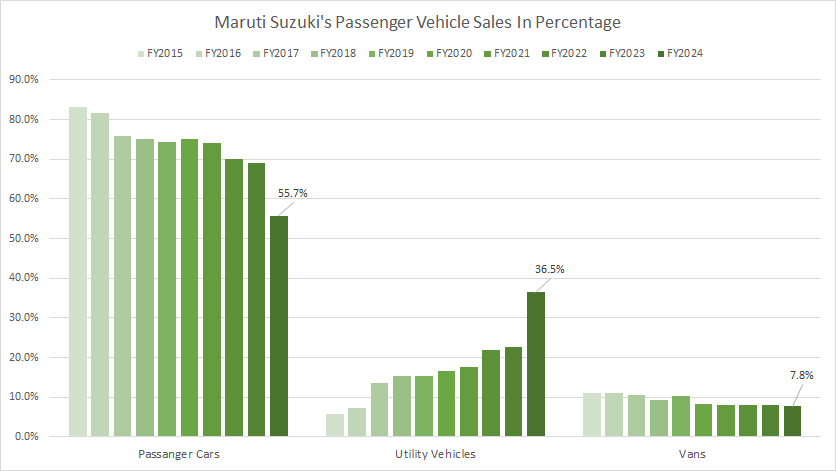
Under the passenger vehicle segment, passenger car sales alone made up more than half of the entire passenger vehicle volume in fiscal year 2024, making this segment the largest group in terms of sales percentage compared to utility vehicles and vans.
On the other hand, sales of utility vehicles made up about 36.5% of the entire passenger vehicle volume in fiscal year 2024, while sales of vans represented 8%, the lowest among all vehicle types within the passenger vehicle segment.
While passenger car sales figures have remained the largest, its percentage has been declining. As seen, the 55.7% in fiscal year 2024 was down considerably from the 70% in the prior year.
On the flipped side, the percentage of utility vehicles has grown from over 20% to 36.5% between fiscal year 2023 and 2024, while the percentage of vans has declined to 7.8% during the same period.
Mini, Compact, And Mid-Size Car Sales
Maruti mini, compact and mid-size car sales
(click image to enlarge)
Maruti Suzuki’s sales of passenger cars are made up of mini, compact, and mid-size sedans. The definition of mid-size passenger cars is available here: Mid-Size Passenger Cars.
Maruti’s mini segment consists of cars such as Alto and S-Presso while the compact segment consists of cars such as WagonR, Swift, Celerio, Ignis, Baleno, Dzire, and Tour S. There is only 1 model in the mid-size segment – the Ciaz.
Of all 3 sub-segments, the compact segment has delivered the largest volume to Maruti Suzuki, totaling 828 thousand units in fiscal year 2024.
On the other hand, Maruti’s mini segment delivered 142 thousand vehicles while the mid-size segment delivered only 10 thousand vehicles in fiscal year 2024. The sales of both segments have significantly decreased over the years.
Maruti’s compact segment is the only segment that has seen sales volume growing since fiscal year 2015.
Mini, Compact, And Mid-Size Car Sales In Percentage
Maruti mini, compact and mid-size car sales in percentage
(click image to enlarge)
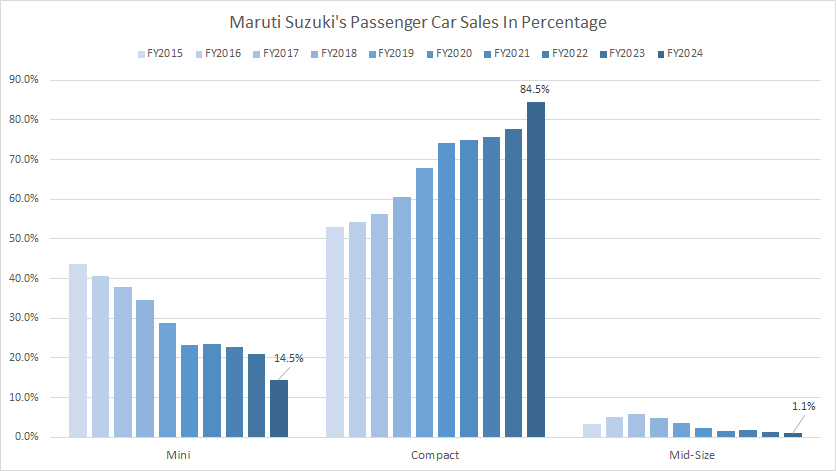
Within the passenger car segment, compact cars contributed roughly 84.5% of sales to total volume in fiscal year 2024, making this segment the largest among all sedans.
More importantly, the percentage figures have been increasing since fiscal year 2015, reaching multiple record highs in the last few years, illustrating the growing importance of the compact segment to Maruti.
In contrast, Maruti’s mini and mid-size car sales have declined in percentage figures, reaching multiple record lows in the last few years.
As of fiscal year 2024, Maruti Suzuki’s mini and mid-size vehicle sales contributed just 14.5% and 1.1%, respectively, of sales to the total volume, the lowest figures ever recorded.
Conclusion
While most of Maruti Suzuki’s vehicle sales have recovered to their pre-COVID results, a few of them are still struggling to grow.
For example, within the passenger car segment, the sales of mini and mid-size vehicles have been struggling to recover. The bad news is that they have continued to decrease even in post-COVID time.
The compact segment has not performed much better although sales have recovered in post-COVID time. Therefore, the entire passenger car segment has seen its sales volume plateauing in the last several years.
On the other hand, Maruti’s utility vehicle segment have exploded in sales volume in recent years. Maruti’s sales of utility vehicles in fiscal year 2024 soared beyond 600 thousand units for the first time in the last decade.
Lastly, Maruti Suzuki’s vehicle export volume also has experienced significant growth over the last several years. As of fiscal year 2024, Maruti’s vehicle export topped over 280 thousand units, an all-time high since fiscal year 2015.
Despite having the exceptional results over the last few years, Maruti Suzuki’s vehicle export sales comprised only 13% of the total volume in fiscal year 2024.
Credits And References
1. All sales data in this article are obtained and referenced from Maruti Suzuki’s vehicle delivery reports which are available in Maruti Suzuki’s Investor Relation.
2. Featured images in this article are used under creative commons licenses and sourced from the following websites: Suzuki Celerio and Suzuki Swift Sport.
Disclosure
References and examples such as tables, charts, and diagrams are constantly reviewed to avoid errors, but we cannot warrant the full correctness of all content.
The content in this article is for informational purposes only and is neither a recommendation nor a piece of financial advice to purchase a stock.
If you find the information in this article helpful, please consider sharing it on social media and also provide a link back to this article from any website so that more articles like this one can be created in the future.
Thank you!


