Renewable Energy. Source: Flickr
Tesla operates as a premium EV brand, focusing on high-performance vehicles with advanced software integration. It has a strong presence in North America and Europe, with growing expansion in China.
Chinese EV makers cater to a broader range of consumers, offering affordable, mid-range, and luxury EVs. They dominate the Chinese domestic market, which is the largest EV market globally.
Chinese EV makers benefit from strong government subsidies, tax incentives, and infrastructure support, allowing them to scale production rapidly.
Tesla, as a foreign automaker in China, does not receive the same level of government backing, making competition more challenging.
Despite the many differences, Tesla and Chinese EV makers are fully committed to electric mobility, producing only battery-electric vehicles (BEVs) rather than traditional internal combustion engine (ICE) cars.
In addition, they invest heavily in autonomous driving technology, AI-powered software, and smart vehicle connectivity. Tesla’s Full Self-Driving (FSD) and BYD’s DiPilot system are examples of their focus on automation.
Let’s look at the R&D numbers!
Investors interested in the R&D spending of other companies may find more resources on these pages:
R&D Comparison: Automotive
R&D Comparison: Semiconductor
R&D Comparison: Social Media
Please use the table of contents to navigate this page.
Table Of Contents
Definitions And Overview
O2. How far have Chinese EV companies progressed?
R&D Spending
A1. R&D Spending
A2. R&D Spending YoY Growth Rates
R&D Ratios
B1. R&D Spending as a Percentage of Revenue
B2. R&D Spending as a Percentage of Gross Profit
B3. R&D Spending as a Percentage of Operating Expenses
Summary And Reference
S1. Insight
S2. References and Credits
S3. Disclosure
Definitions
To help readers understand the content better, the following terms and glossaries have been provided.
Currency Conversion: All Chinese EV companies presented their financial results in their native currencies – the Chinese Yuan.
However, the conversion of the Chinese Yuan to US dollars was performed by the respective Chinese EV makers at the time of earnings presentations, rather than the editors.
R&D to revenue or profit ratio: The R&D to revenue or profit ratio measures the proportion of a company’s revenue or profit that is reinvested into research and development (R&D). It is a key indicator of how much a company prioritizes innovation and long-term growth.
Formula:
\[ \text{R&D to Revenue Ratio} = \frac{\text{R&D Expenses}}{\text{Total Revenue}} \times 100 \]
This ratio is expressed as a percentage, showing how much of each dollar earned is allocated to R&D.
-
High R&D to Revenue Ratio: Indicates a strong focus on innovation, common in technology, pharmaceuticals, and automotive industries.
-
Low R&D to Revenue Ratio: Suggests a company may be more focused on cost efficiency or mature product lines, typical in consumer goods and retail sectors.
R&D to operating expense ratio: The R&D to operating expense ratio measures the proportion of a company’s total operating expenses that is allocated to research and development (R&D). It helps assess how much a company prioritizes innovation relative to its overall spending.
Formula:
\[ \text{R&D to Operating Expense Ratio} = \frac{\text{R&D Expenses}}{\text{Total Operating Expenses}} \times 100 \]
This ratio is expressed as a percentage, indicating how much of a company’s operating budget is dedicated to R&D.
-
High Ratio: Suggests a strong focus on innovation, common in technology, pharmaceuticals, and automotive industries.
-
Low Ratio: Indicates a company may prioritize cost efficiency, marketing, or operational expansion over R&D.
How far have Chinese EV companies progressed?
Chinese EV companies have made significant progress in recent years, establishing themselves as global competitors to Tesla and other Western automakers. However, the industry is also experiencing consolidation, with some brands struggling to survive.
-
Market Expansion & Global Reach
-
Leading Chinese EV makers like BYD, NIO, Xpeng, and Li Auto have expanded beyond China, entering Europe, Southeast Asia, and Latin America.
-
BYD, in particular, has aggressively grown its presence in Germany, Thailand, and Brazil, challenging Tesla’s dominance in these regions.
-
-
Technological Advancements
-
Chinese EV makers have closed the gap with Tesla in battery technology, with BYD’s Blade Battery offering ultra-fast charging and improved safety.
-
Companies like CATL (Contemporary Amperex Technology Co.) are leading in solid-state battery research, aiming to improve energy density and reduce costs.
-
-
Competitive Pricing & Product Diversity
-
Chinese EV brands offer a wider range of models, from budget-friendly to luxury electric vehicles, making them more accessible to different consumer segments.
-
NIO’s Onvo L60, priced at 219,900 yuan ($30,465), is significantly cheaper than Tesla’s Model Y at 249,900 yuan, making it a strong competitor.
-
-
Industry Consolidation & Survival Challenges
-
China has over 100 EV brands, but many are struggling to remain viable. Some companies, like Ji Yue and Neta, have faced financial difficulties and layoffs, leading to speculation about their future.
-
Analysts predict that smaller EV startups may need to merge or restructure to survive, as the market becomes increasingly competitive.
-
Chinese EV makers have rapidly progressed, challenging Tesla with advanced technology, competitive pricing, and strong government support. However, industry consolidation is inevitable, and only the strongest brands will continue to thrive.
Research And Development Spending
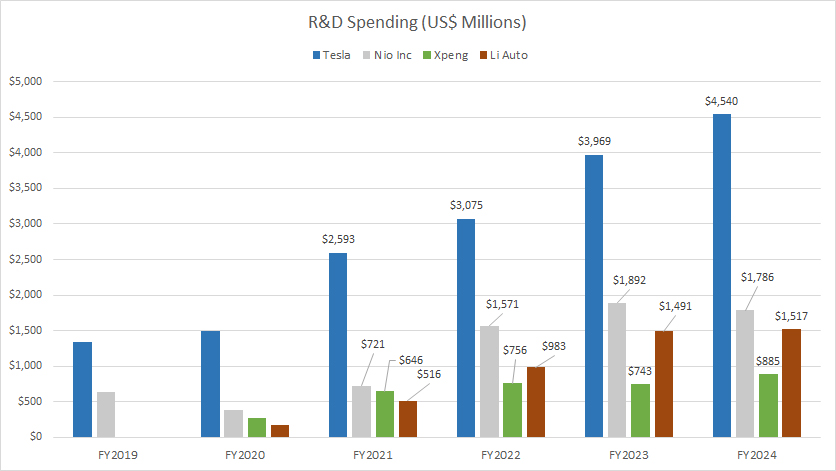
Tesla, Nio, Xpeng and Li Auto’s R&D spending
(click image to expand)
All Chinese EV companies reported their financial results in their native currencies – the Chinese Yuan. The conversion of Chinese Yuan to USD was carried out by the respective companies, rather than the editors.
Based on the chart, Tesla’s R&D spending has been far higher than those of Nio, Xpeng, and Li Auto on an absolute value basis.
At an R&D spending of $4.5 billion in fiscal year 2024, Tesla’s figure was more than double the nearest contenders – Nio Inc. – whose R&D spending came in at $1.8 billion during the same fiscal year.
On the other hand, Xpeng and Li Auto’s R&D spending amounted to $885 million and $1.5 billion, respectively, in fiscal year 2024 – also a much lower figure than Tesla.
Of all EV companies under comparison, Xpeng has spent the least on research and development, while Tesla has spent the most on R&D.
Among all Chinese EV makers compared, Nio Inc. has spent the most on R&D, totaling $1.8 billion in fiscal year 2024.
Research And Development Spending Year-On-Year Growth Rates
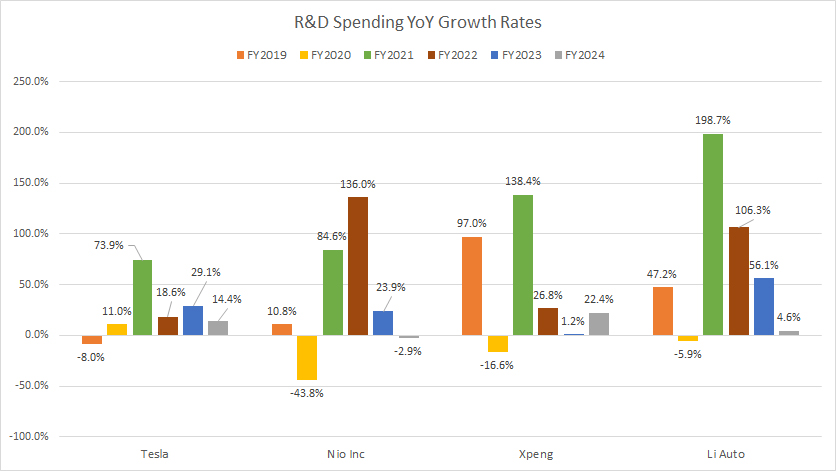
Tesla, Nio, Xpeng and Li Auto’s R&D spending growth rates
(click image to expand)
All Chinese EV companies reported their financial results in their native currencies – the Chinese Yuan. The conversion of Chinese Yuan to USD was carried out by the respective companies, rather than the editors.
Most Chinese EV makers have registered much higher R&D growth than Tesla. However, Tesla’s R&D growth has been the most consistent.
Here is the detailed result:
R&D Growth in FY2024
| Company | Growth Rates |
|---|---|
| Tesla | +14.4% |
| Nio Inc. | -2.9% |
| Xpeng | +22.4% |
| Li Auto | +4.6% |
3-Year Average R&D Growth from FY2022 to FY2024:
| Company | Growth Rates |
|---|---|
| Tesla | +20.7% |
| Nio Inc. | +52.3% |
| Xpeng | +16.8% |
| Li Auto | +55.7% |
5-Year Average R&D Growth from FY2020 to FY2024:
| Company | Growth Rates |
|---|---|
| Tesla | +29.4% |
| Nio Inc. | +39.5% |
| Xpeng | +34.4% |
| Li Auto | +72.0% |
Research And Development as a Percentage of Revenue
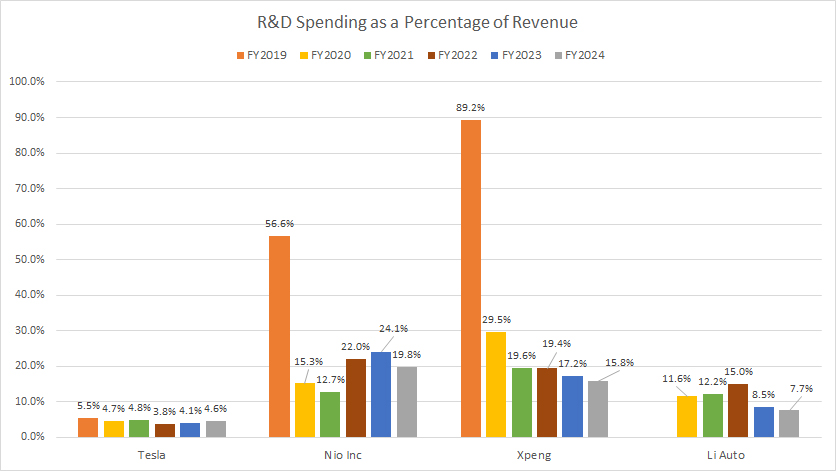
Tesla, Nio, Xpeng and Li Auto’s R&D spending to revenue ratio
(click image to expand)
As a percentage of revenue, most Chinese EV companies such as Nio, Xpeng, and Li Auto have registered much higher R&D ratios than Tesla.
Here is a more detailed breakdown:
R&D to Revenue Ratio in FY2024
| Company | Ratio (%) |
|---|---|
| Tesla | 4.6% |
| Nio Inc. | 19.8% |
| Xpeng | 15.8% |
| Li Auto | 7.7% |
3-Year Average from FY2022 to FY2024:
| Company | Ratio (%) |
|---|---|
| Tesla | 4.2% |
| Nio Inc. | 22.0% |
| Xpeng | 17.5% |
| Li Auto | 10.4% |
5-Year Average from FY2020 to FY2024:
| Company | Ratio (%) |
|---|---|
| Tesla | 4.4% |
| Nio Inc. | 18.8% |
| Xpeng | 20.3% |
| Li Auto | 11.0% |
Research And Development as a Percentage of Gross Profit
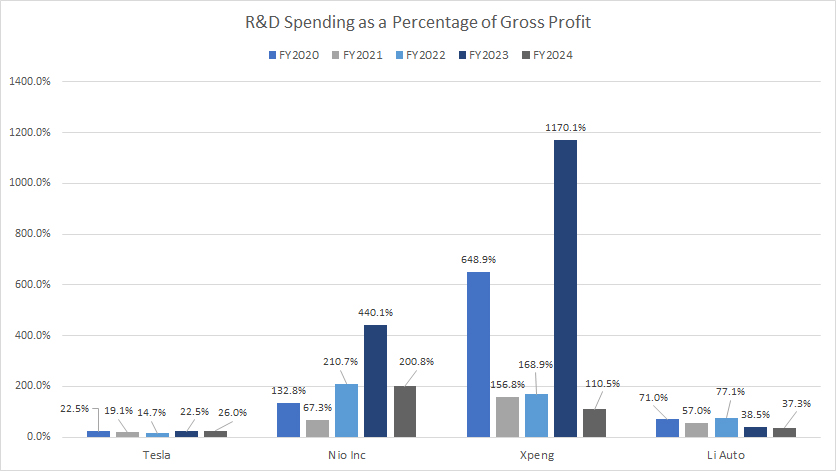
Tesla-Nio-Xpeng-Li-Auto-rd-spending-to-gross-profit-ratio
(click image to expand)
As a percentage of gross profit, most Chinese EV companies such as Nio, Xpeng, and Li Auto have registered much higher R&D ratios than Tesla, indicating that their R&D expenses have significantly eaten a big part of their profit margins.
Here is a more detailed breakdown:
R&D to Gross Profit Ratio in FY2024
| Company | Ratio (%) |
|---|---|
| Tesla | 26.0% |
| Nio Inc. | 200.8% |
| Xpeng | 110.5% |
| Li Auto | 37.3% |
3-Year Average from FY2022 to FY2024:
| Company | Ratio (%) |
|---|---|
| Tesla | 21.1% |
| Nio Inc. | 283.8% |
| Xpeng | 483.1% |
| Li Auto | 51.0% |
5-Year Average from FY2020 to FY2024:
| Company | Ratio (%) |
|---|---|
| Tesla | 21.0% |
| Nio Inc. | 210.3% |
| Xpeng | 451.0% |
| Li Auto | 56.2% |
R&D Spending as a Percentage of Operating Expense
Tesla, Nio, Xpeng and Li Auto’s R&D spending to operating expenses ratio
(click image to expand)
As a percentage of operating expense, Tesla and Chinese EV companies have registered comparable R&D ratios, indicating that they have equal R&D budget relative to their operating expenses.
Here is a more detailed breakdown:
R&D to Operating Expense Ratio in FY2024
| Company | Ratio (%) |
|---|---|
| Tesla | 43.8% |
| Nio Inc. | 46.0% |
| Xpeng | 48.5% |
| Li Auto | 48.9% |
3-Year Average from FY2022 to FY2024:
| Company | Ratio (%) |
|---|---|
| Tesla | 43.9% |
| Nio Inc. | 50.1% |
| Xpeng | 45.6% |
| Li Auto | 52.0% |
5-Year Average from FY2020 to FY2024:
| Company | Ratio (%) |
|---|---|
| Tesla | 40.1% |
| Nio Inc. | 45.9% |
| Xpeng | 43.5% |
| Li Auto | 50.8% |
Insight
Essentially, Tesla’s R&D spending far exceeds its Chinese competitors, but NIO leads among Chinese EV makers. Xpeng spends the least on R&D, indicating different strategic priorities.
For R&D to revenue ratio, Chinese EV makers, while not spending more in absolute terms, invest aggressively relative to their revenue size. Tesla maintains financial discipline, ensuring profitability alongside innovation.
For R&D to gross profit ratio, NIO and Xpeng have alarmingly high ratios, indicating their R&D spending far exceeds gross profit, raising questions about long-term financial sustainability. Tesla maintains a healthy balance, ensuring continued profitability.
In short, Chinese EV makers have progressed significantly, challenging Tesla’s dominance with government backing, technological innovation, and pricing advantages. However, Tesla still leads in profitability, global expansion, and high-end EV technology.
Tesla needs to accelerate its model refresh cycles to remain competitive.
Chinese EV makers must improve profitability while sustaining high R&D investment. Industry consolidation in China is inevitable, with weaker brands struggling to survive.
References and Credits
1. All financial figures discussed were obtained and referenced from the respective quarterly and annual reports published on the investor relations pages:
a) Tesla Investor Relations
b) NIO Investor Relations
c) Xpeng Investor Relations
d) Li Auto Investor Relations
2. Flickr Images.
Disclosure
We may use artificial intelligence (AI) tools to assist us in writing some of the text in this article. However, the data is directly obtained from original sources and meticulously cross-checked by our editors multiple times to ensure its accuracy and reliability.
If you find the information in this article helpful, please consider sharing it on social media. Additionally, providing a link back to this article from any website can help us create more content like this in the future.
Thank you for your support and engagement! Your involvement helps us continue to provide high-quality, reliable content.


