Artificial Intelligence. Pexels Images.
This article looks at Nvidia’s revenue by country. For your information, Nvidia derives the majority of its revenue from only two countries: the U.S. and China, with Taiwan and Hong Kong included.
The U.S. and China made up over 76% of Nvidia’s total revenue in fiscal year 2025. Excluding the U.S., Nvidia’s revenue from Asia, with Singapore included, contributed as much as 47% of the total in fiscal year 2025.
Let’s proceed to the details!
Investors looking for other statistics of Nvidia may find more resources on these pages:
- Nvidia vs Palantir: R&D budget comparison,
- Nvidia revenue by market and product segment, and
- Nvidia vs AMD: profit margin analysis.
Please use the table of contents to navigate this page.
Table Of Contents
Definitions And Overview
O2. Why does Nvidia get the majority of its revenue from the U.S.?
U.S., Singapore, Taiwan, and China
A1. Revenue From The U.S., Singapore, Taiwan, And China
Europe And Asia Pacific
B1. Revenue From Europe And Asia Pacific
Revenue Share
C1. Percentage Of Revenue From The U.S., Singapore, Taiwan, And China
C2. Percentage Of Revenue From The U.S. And Asia
Revenue Growth
D1. YoY Growth Rates Of Revenue From The U.S., Singapore, Taiwan, And China
Summary And Reference
S1. Summary
S2. References and Credits
S3. Disclosure
Definitions
To help readers understand the content better, the following terms and glossaries have been provided.
Revenue By Country: According to the fiscal year 2025 annual report, Nvidia defines its revenue by geographic areas as sales designated based upon the billing location of the customer.
In addition, Nvidia has stated that the end customer location may be different than its customer’s billing location.
Why does Nvidia get the majority of its revenue from the U.S.?
Nvidia’s significant revenue from the U.S. can be attributed to several factors:
- Market Demand: The U.S. has a high demand for Nvidia’s products, particularly in sectors like gaming, data centers, and artificial intelligence (AI). The U.S. is home to many tech companies and data centers that rely on Nvidia’s GPUs and AI solutions.
- Strategic Partnerships: Nvidia has established strong partnerships with major U.S. companies, including tech giants like Amazon, Google, and Microsoft. These collaborations often involve large-scale purchases of Nvidia’s products for data centers and AI applications.
- Innovation and R&D: The U.S. is a global leader in technology and innovation, providing a fertile ground for Nvidia’s cutting-edge products. The presence of numerous tech startups and established companies in Silicon Valley and other tech hubs contributes to Nvidia’s revenue.
- Consumer Electronics: The U.S. has a large consumer base for high-end electronics, including gaming consoles and PCs, which rely heavily on Nvidia’s GPUs.
- Government Contracts: Nvidia also benefits from government contracts and investments in AI and high-performance computing, further boosting their revenue from the U.S.
These factors collectively contribute to Nvidia’s strong revenue generation from the U.S. market.
Revenue From The U.S., Singapre, Taiwan, And China
Nvidia-revenue-from-the-U.S.-Singapore-Taiwan-and-China
(click image to expand)
You may find more information about the definition of Nvidia’s revenue by country here: revenue by country.
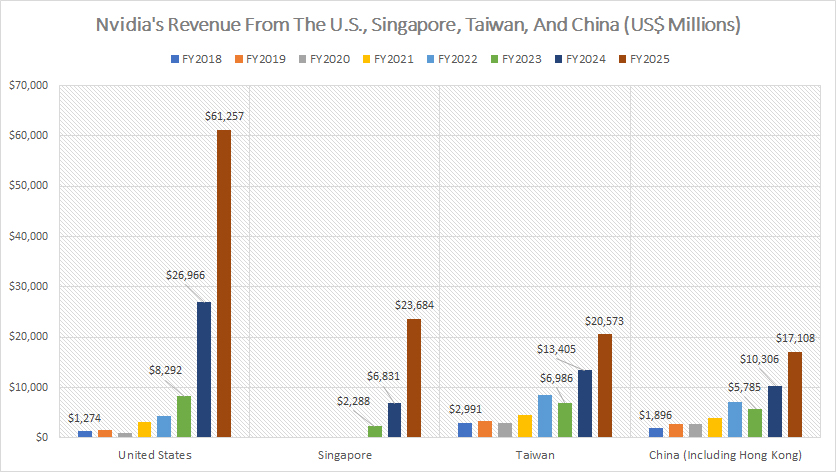
The chart above presents the regions and countries that have significantly contributed sales to Nvidia.
- United States: The United States is Nvidia’s biggest source of income and has contributed more than $30 billion in sales over the last three years. In fiscal year 2025, Nvidia’s revenue from the United States reached a record figure of $61.3 billion, more than double the amount in fiscal year 2024.
- Singapore: Despite its small size, Singapore stands out as a significant contributor to Nvidia’s revenue, ranking second globally. From fiscal year 2023 to 2025, this island nation consistently generated an average of $11 billion in revenue for Nvidia. In fiscal year 2025 alone, Nvidia’s revenue from Singapore skyrocketed to $23.7 billion, a remarkable increase compared to the $6.8 billion recorded in fiscal year 2024.
- At first glance, it might seem implausible for Singapore to generate such substantial revenue. However, the key lies in Nvidia’s revenue recognition based on customer billing locations. A considerable number of Nvidia’s customers prefer to use Singapore as their centralized invoicing hub. This strategy enables these customers to consolidate their financial transactions, taking advantage of Singapore’s favorable business environment and robust financial infrastructure.
- Interestingly, while Singapore serves as the billing location for a massive number of Nvidia’s customers, the actual shipment of products tells a different story. The majority of Nvidia’s products are shipped to other destinations worldwide, with shipments to Singapore accounting for less than 2% of the total revenue in fiscal year 2025. This discrepancy highlights Singapore’s role as a strategic financial and invoicing center, rather than a primary destination for Nvidia’s physical shipments.
- Taiwan: Taiwan is another region that has significantly contributed sales to Nvidia. Between fiscal years 2023 and 2025, Nvidia’s revenue from Taiwan alone averaged $14 billion, the second highest after the United States. In fiscal year 2025, Nvidia’s revenue figure from Taiwan reached an all-time high of $20.6 billion, more than 50% higher than the $13.4 billion made in fiscal year 2024.
- China: China, including Hong Kong, has established itself as the third-largest revenue stream for Nvidia, following the U.S. and Taiwan. Between fiscal years 2023 and 2025, the average revenue generated from China amounted to $11 billion. Fiscal year 2025 witnessed a notable surge in Nvidia’s revenue from China, reaching $17.1 billion. This figure represents a substantial increase of approximately 66% compared to the $10.3 billion reported in the previous fiscal year.
In summary, Nvidia’s revenue landscape is shaped by its strong presence in the U.S., followed by significant contributions from Taiwan, China, and Singapore. These regions collectively drive Nvidia’s global success and financial performance.
Revenue From Europe And Asia Pacific
Nvidia-revenue-from-Europe-and-Asia-Pacific
(click image to expand)
You may find more information about the definition of Nvidia’s revenue by country here: revenue by country.
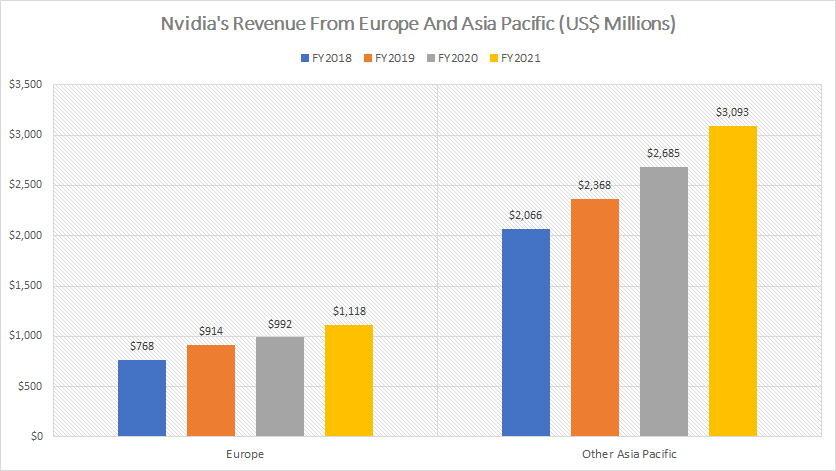
Starting in fiscal year 2022, Nvidia no longer provides a detailed breakdown of its revenue from Europe and the Asia Pacific regions. Instead, the company has consolidated these figures under the “Other Countries” segment. This shift in reporting reflects Nvidia’s strategic approach to simplifying its revenue presentation and focusing on broader geographical segments.
Despite this change, historical data reveals significant growth in these regions. In fiscal year 2021, Nvidia generated $1.1 billion in revenue from Europe and $3.1 billion from the Asia Pacific (excluding China, Taiwan, and HK). These figures highlight the importance of these regions to Nvidia’s overall revenue stream.
From fiscal year 2018 to 2021, Nvidia’s revenue from Europe increased by an impressive 46%. This growth can be attributed to the rising demand for Nvidia’s advanced graphics processing units (GPUs) and AI solutions across various industries, including gaming, data centers, and automotive technology. The expansion of Nvidia’s partnerships and collaborations with European tech companies also played a crucial role in driving revenue growth.
Similarly, the Asia Pacific region (excluding China, Taiwan, and HK) witnessed a robust 50% growth in revenue over the same period. This growth is driven by the region’s rapid technological advancements, increasing investments in AI and high-performance computing, and the expansion of Nvidia’s customer base. Countries in the Asia Pacific region have become key players in the global technology landscape, further boosting Nvidia’s revenue from this area.
Overall, while Nvidia has shifted its reporting structure, the revenue growth from Europe and the Asia Pacific regions underscores the company’s strong market presence and strategic focus on these important markets.
Percentage Of Revenue From The U.S., Singapore, Taiwan, And China
Nvidia-percentage-of-revenue-from-the-U.S.-Singapore-Taiwan-and-China
(click image to expand)
You may find more information about the definition of Nvidia’s revenue by country here: revenue by country.
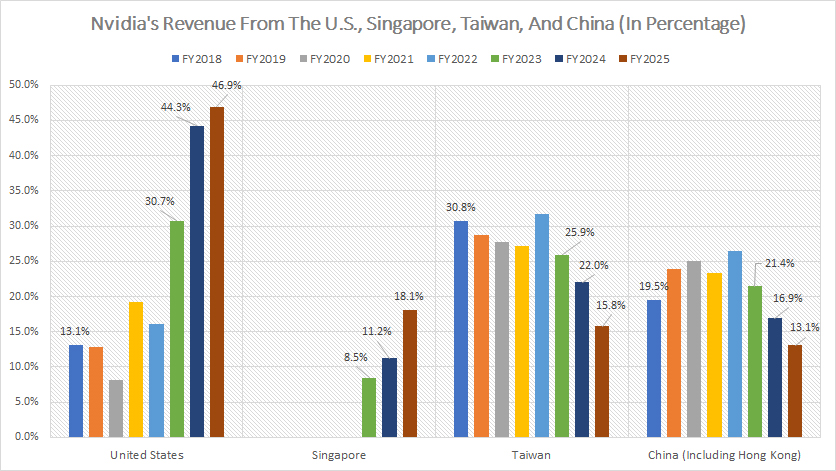
The analysis of Nvidia’s revenue distribution across different regions reveals several key conclusions:
- United States: From a percentage perspective, the United States has emerged as Nvidia’s largest revenue contributor, reaching an impressive 47% in fiscal year 2025. This represents a significant shift, as Nvidia’s revenue share from the U.S. was much smaller compared to Taiwan and China during the period from fiscal year 2018 to 2023, as illustrated in the accompanying chart.
- During the fiscal years 2018 to 2023, Nvidia’s revenue share from the U.S. averaged less than 15%, while the contributions from Taiwan and China consistently exceeded 20% in the same period. This trend highlights the dominant role that Taiwan and China played in Nvidia’s revenue landscape during those years.
- However, the period from fiscal year 2022 to 2025 marks a turning point, with Nvidia experiencing its most significant growth in revenue share from the U.S. The percentage of revenue derived from the U.S. has tripled, increasing from slightly above 15% in fiscal year 2022 to 47% by the end of fiscal year 2025. This remarkable growth underscores the rising demand for Nvidia’s products in the U.S. and the company’s strategic focus on this market.
- Singapore: Meanwhile, Singapore has made substantial strides, contributing an impressive 18% of Nvidia’s revenue in fiscal year 2025. This figure places Singapore as the second-largest revenue contributor after the United States, slightly above the 16% and 14% recorded from Taiwan and China, respectively.
- The impressive revenue from Singapore can be attributed primarily to the massive number of Nvidia’s customers using Singapore as their primary financial and invoicing hub. This strategic positioning allows customers to take advantage of Singapore’s favorable business environment and robust financial infrastructure. However, it is important to note that the actual physical products are shipped to other destinations worldwide, with shipments to Singapore accounting for less than 2% of Nvidia’s total revenue in fiscal year 2025.
- China: On the other hand, China contributed just 13% of Nvidia’s total sales in fiscal year 2025, while Taiwan made up 16% of the total in the same period. These ratios are significantly lower than the 17% and 22% recorded in fiscal year 2024. Although revenue from both regions has surged, their revenue share has decreased, illustrating the much faster revenue growth in other regions, including the U.S. and Singapore.
Essentially, Nvidia’s revenue landscape has seen significant shifts, with the U.S. taking a leading role, Singapore emerging as a key financial hub, and China and Taiwan maintaining their importance despite relative declines in revenue share. This diverse and evolving revenue distribution highlights Nvidia’s strategic adaptability and global reach.
Percentage Of Revenue From The U.S. And Asia
Nvidia-percentage-of-revenue-from-the-U.S.-and-Asia
(click image to expand)
You may find more information about the definition of Nvidia’s revenue by country here: revenue by country.
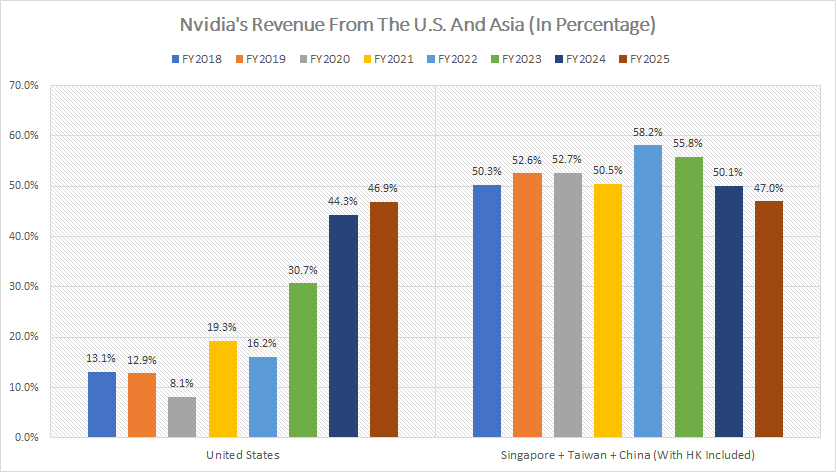
When combined, the revenue from Singapore, Taiwan, and China constitutes a significant portion of Nvidia’s total sales, collectively accounting for approximately 50% of the company’s revenue, as shown in the accompanying graph. This highlights the substantial contribution of these regions to Nvidia’s overall financial performance and underscores the importance of the Asian market.
Despite some fluctuations, the revenue share from these regions has remained relatively constant at around 50% since fiscal year 2018. Notably, the ratio peaked at 58% in fiscal year 2022, reflecting a period of strong growth. However, since fiscal year 2022, there has been a marked decline in the ratio, which fell to 47% by the end of fiscal year 2025. This decline indicates a significant surge in revenue share from other regions, particularly the United States.
The United States has experienced a remarkable rise in its revenue share, increasing from just 13% in fiscal year 2018 to an impressive 47% as of fiscal year 2025. This substantial growth highlights the growing importance of the U.S. market to Nvidia, driven by increased demand for advanced graphics processing units (GPUs), AI solutions, and strategic partnerships with major tech companies and cloud service providers.
When combined, the U.S. and the Asia Pacific region (including Singapore, Taiwan, and China) accounted for a massive 94% of Nvidia’s total revenue in fiscal year 2025. This leaves only 6% of the revenue attributed to other regions, such as Europe. The dominant share of the U.S. and Asia Pacific regions underscores their critical role in Nvidia’s global revenue distribution and strategic focus.
In conclusion, Nvidia’s revenue landscape has seen significant shifts, with the U.S. market emerging as a key contributor alongside the continued importance of the Asia Pacific region. The company’s ability to navigate and leverage these dynamic markets has been instrumental in driving its financial success.
YoY Growth Rates Of Revenue From The U.S., Singapore, Taiwan, And China
Nvidia-growth-rates-of-revenue-by-country
(click image to expand)
You may find more information about the definition of Nvidia’s revenue by country here: revenue by country.
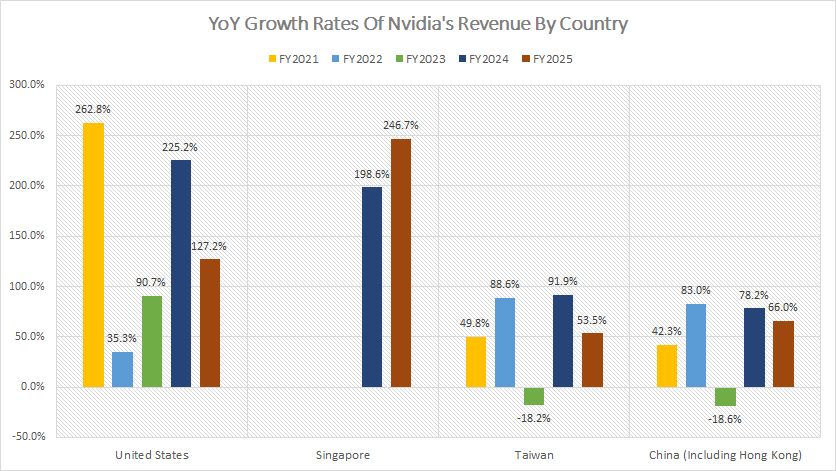
Over the past five years, Nvidia has witnessed the most significant revenue growth in the United States, as illustrated in the accompanying chart. On average, the annual revenue growth from fiscal year 2021 to 2025 amounted to an astounding 148%, the highest among all regions. In fiscal year 2025 alone, Nvidia recorded a year-over-year (YoY) revenue growth of 127% in the U.S., far surpassing the growth rates observed in Taiwan and China.
In comparison, Nvidia’s revenue growth in China and Taiwan has been more modest. From fiscal year 2021 to 2025, the average annual revenue growth in these regions was 50% and 53%, respectively. While these figures are substantial, they pale in comparison to the explosive growth experienced in the U.S.
Singapore has emerged as a key revenue contributor for Nvidia in recent years, showcasing remarkable growth rates. In fiscal year 2024, Singapore’s YoY revenue growth reached an impressive 199%, and in fiscal year 2025, it skyrocketed to 247%. This rapid growth highlights Singapore’s increasing importance in Nvidia’s revenue landscape.
Overall, the data underscores Nvidia’s strategic focus on the U.S. market, where it has achieved unparalleled growth. The significant revenue contributions from Singapore, along with the steady growth in China and Taiwan, further illustrate Nvidia’s ability to leverage diverse markets to drive its financial success.
Conclusion
Nvidia’s revenue landscape has seen significant shifts, with the U.S. market taking a leading role and Singapore emerging as a key financial hub. The company’s ability to navigate diverse markets, such as China and Taiwan, underscores its strategic adaptability and global reach. The overall picture demonstrates Nvidia’s success in leveraging regional strengths to drive its financial performance.
References and Credits
1. All financial figures presented were obtained and referenced from Nvidia’s quarterly and annual reports published on the company’s investor relations page: Nvidia Financial Reports.
2. Pexels Images.
Disclosure
We may use the assistance of artificial intelligence (AI) tools to produce some of the text in this article. However, the data is directly obtained from original sources and meticulously cross-checked by our editors multiple times to ensure its accuracy and reliability.
If you find the information in this article helpful, please consider sharing it on social media. Additionally, providing a link back to this article from any website can help us create more content like this in the future.
Thank you for your support and engagement! Your involvement helps us continue to provide high-quality, reliable content.

