One of Altria’s brand names: Marlboro. Source: Flickr
Altria Group (NYSE: MO) is more than a cigarette company.
For years, Altria has been expanding into various industries, including cannabis, while simultaneously strengthening its core tobacco businesses.
At the end of 2023, Altria owned the following subsidiaries:
- Philip Morris USA – the maker of Marlboro cigarettes
- U.S. Smokeless Tobacco Company – the maker of Copenhagen and Skoal
- John Middleton – the maker of Black & Mild cigars
- Helix and Helix ROW – the maker of on! oral nicotine pouches
- NJOY – the maker of e-vapor products
In addition to the businesses above, Altria had strategic investments and agreements with other companies:
- 35% economic interest in JUUL Labs – U.S. leading e-vapor company
- 10.1% ownership in Anheuser-Busch InBev – the world’s largest brewer
- 45% ownership in Cronos Group – a leading global cannabinoid company
- Exclusive U.S. license to commercialize Philip Morris International’s IQOS product – the only heated tobacco product authorized by the US FDA
In short, Altria aims to diversify from cigarettes into a portfolio of businesses, including tobacco, cannabis, and smokeless products.
In this article, we will explore several statistics of Altria Group, which include the consolidated revenue, profitability, margins, and growth rates.
Apart from the consolidated figures, we also explore Altria’s revenue and profit by product segment.
Let’s get started!
Please use the table of contents to navigate this page.
Table Of Contents
Definitions And Overview
O2. Altria Business Model
O3. How Does Altria Earn Revenue
Consolidated Revenue
A1. Revenue By Year
A2. Revenue By Quarter
A3. Revenue By TTM
A4. YoY Growth Rates Of Revenue By TTM
Consolidated Profitability And Margins
B1. Net Earnings And Earnings Per Share
B2. Gross Margin, OCI Margin And Operating Profit Margin
Segment Revenue
C1. Revenue By Product Segment
C2. Revenue By Product Segment In Percentage
C3. Annual Growth Rates Of Revenue By Product Segment
Segment Profitability And Margins
D1. Profitability By Product Segment
D2. Margin By Product Segment
D3. Annual Growth Rates Of Profitability By Product Segment
Summary And Reference
S1. Conclusion
S2. References and Credits
S3. Disclosure
Definitions
To help readers understand the content better, the following terms and glossaries have been provided.
Operating Segments: Altria has two main business segments, one of which is smokeable tobacco products, while the other deals with oral tobacco products.
Altria’s primary products in the smokeable tobacco segment are combustible cigarettes from Philip Morris USA and machine-made large cigars and pipe tobacco from Middleton.
On the other hand, the primary products in the oral tobacco segment consist of MST and snus products manufactured and sold by USSTC and oral nicotine pouches manufactured and sold by Helix.
In addition to its primary segments, Altria also owns a financial services business, an IQOS System heated tobacco business, and Helix ROW. Helix ROW is engaged in the manufacture and sale of oral nicotine pouches and operates internationally in the rest-of-world.
The financial contributions from Altria’s secondary businesses have been insignificant and are included in all others.
Furthermore, Altria used to own a wine business operated under a subsidiary called Ste. Michelle, but the wine business has been entirely divested since 2022.
All Others: All Others is one of Altria’s reportable segments that includes (i) the financial results of NJOY (beginning June 1, 2023); (ii) Horizon; (iii) Helix ROW; (iv) Altria’s former financial services business, which completed the wind-down of its portfolio of finance assets in 2022; and (v) the IQOS System heated tobacco business.
Operating Company Income (OCI): OCI is a non-GAAP measure defined as operating income before general corporate expenses and amortization of intangibles, according to Altria. The purpose of the OCI is to evaluate the performance of, and allocate resources to, Altria’s business segments.
Adjusted Earnings: Altria’s adjusted earnings excludes certain income and expense items. Altria’s management does not view any of these special items to be part of our underlying results as they may be highly variable, may be unusual or infrequent, are difficult to predict and can distort underlying business trends and results.
Altria’s management believes that adjusted financial measures provide useful additional insight into underlying business trends and results, and provide a more meaningful comparison of year-over-year results.
The management uses adjusted financial measures for planning, forecasting and evaluating business and financial performance, including allocating capital and other resources and evaluating results relative to employee compensation targets.
Altria Business Model
Altria Group, Inc. operates primarily in the tobacco industry. Its business model is centered around the manufacturing and marketing of tobacco products, including cigarettes and smokeless tobacco, in the United States. The company’s portfolio includes several leading brands, notably Marlboro, one of the world’s best-selling cigarette brands.
Altria’s business model focuses on generating revenue by selling its tobacco products to wholesalers and retailers, who then sell these products to consumers. The company invests heavily in brand marketing and loyalty programs to maintain and grow its customer base despite the declining smoking rates in many developed countries due to health concerns and regulatory pressures.
In response to the changing landscape of tobacco use and increasing regulatory restrictions on smoking, Altria has also diversified its business model by investing in reduced-risk products (RRPs) such as e-cigarettes and heated tobacco products. This diversification strategy is aimed at capturing the growing demand for alternative tobacco and nicotine delivery systems that are perceived as less harmful than traditional cigarettes.
Altria also generates revenue from its wine business, which operates under the Ste. Michelle Wine Estates brand, and through its financial services division, which provides finance leasing services primarily in the transportation sector. However, Altria has fully divested its wine business since 2022.
The company’s business model is subject to significant regulatory oversight, including regulations related to product labeling, marketing practices, and introducing new products. Altria actively engages in legislative and regulatory advocacy to shape policies that affect its business operations.
In summary, Altria’s business model is built on selling tobacco products and wine, with a strategic shift towards embracing reduced-risk products to adapt to changing consumer behaviors and regulatory environments.
How Does Altria Earn Revenue
Altria generates a significant portion of its revenue from cigarette sales through its wholly-owned subsidiary, Philip Morris USA.
Philip Morris USA is the largest cigarette manufacturer in the United States, producing and selling cigarettes exclusively to customers within the country. For over 45 years, Marlboro has been the best-selling cigarette brand in the U.S.
Altria’s revenue is also supplemented by other products, including cigars and pipe tobacco marketed and sold by Middleton, moist smokeless tobacco (MST) marketed and sold by USSTC, oral nicotine pouches sold by Helix, and an exclusive right to commercialize certain of Philip Morris International’s heated tobacco products in the United States.
Despite efforts to divest from combustible products, cigarette sales remain Altria’s primary revenue source.
Revenue By Year
Altria-revenue-by-year
(click image to expand)
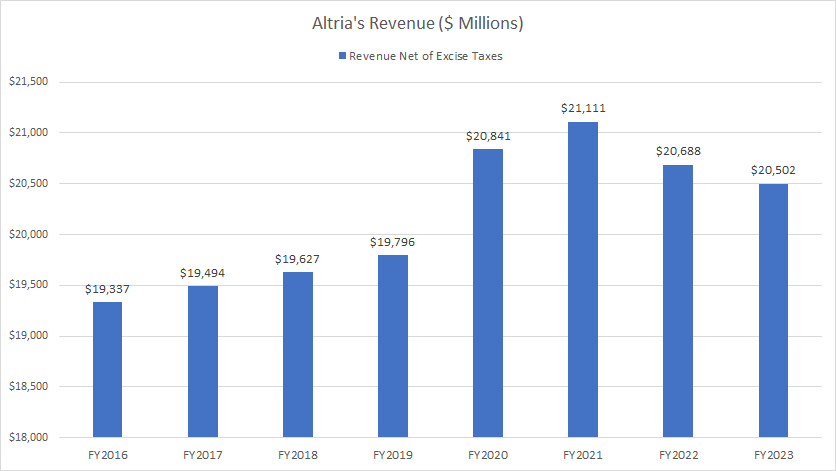
In fiscal 2023, Altria earned $20.5 billion in annual revenue, down $186 million or 1% from $20.7 billion in 2022.
A noticeable trend is that Altria’s revenue has significantly risen between 2016 and 2021, reaching a record figure of $21.1 billion in fiscal 2021. However, Altria’s revenue growth seems to have reached a plateau in fiscal year 2021, and has since been declining.
Revenue By Quarter
Altria-revenue-by-quarter
(click image to expand)
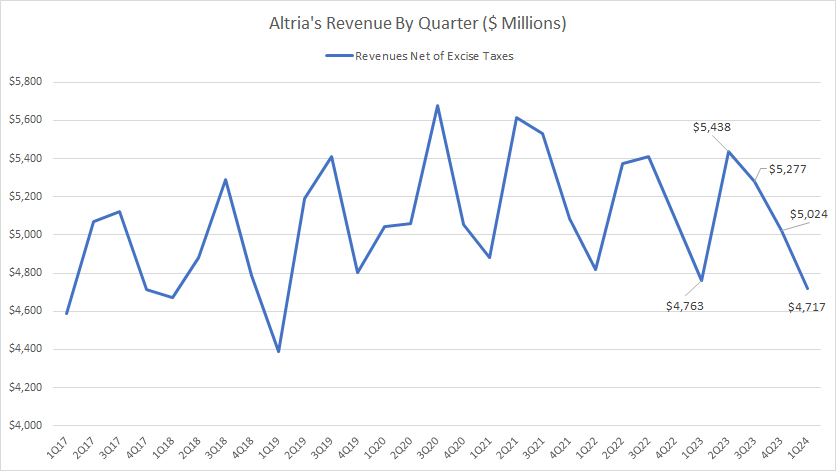
Altria earned $4.7 billion in quarterly revenue in 1Q 2024, roughly in line with the same quarter a year ago.
Altria’s quarterly revenue, net of excise taxes, has averaged $5 billion between 1Q 2023 and 1Q 2024.
Revenue By TTM
Altria-revenue-by-ttm
(click image to expand)
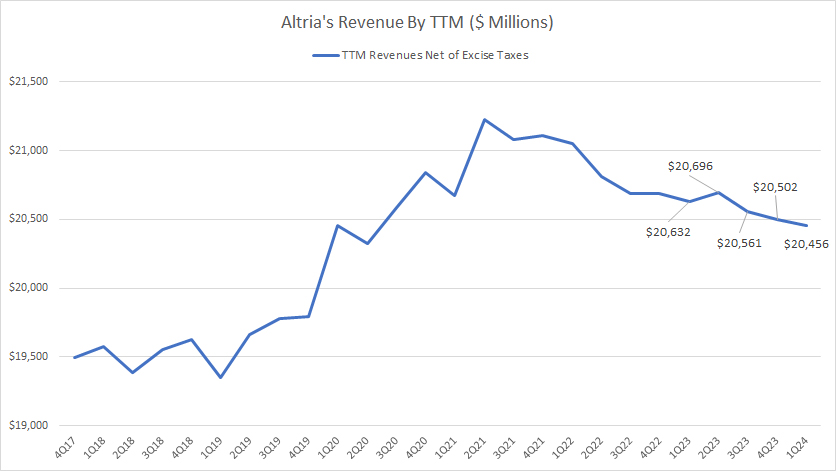
The TTM plot depicts a much clearer trend of Altria’s revenue.
As seen, Altria’s revenue has risen at a much steeper rates during the pre-COVID and COVID periods, but it has steadily decreased in post-pandemic periods, as shown by the TTM plot.
As of 1Q 2024, Altria’s TTM revenue reached $20.5 billion, down 1% from a year ago. The primary concern is that Altria’s revenue may remain stagnant or decline.
YoY Growth Rates Of Revenue By TTM
Altria-growth-rates-of-revenue-by-ttm
(click image to expand)
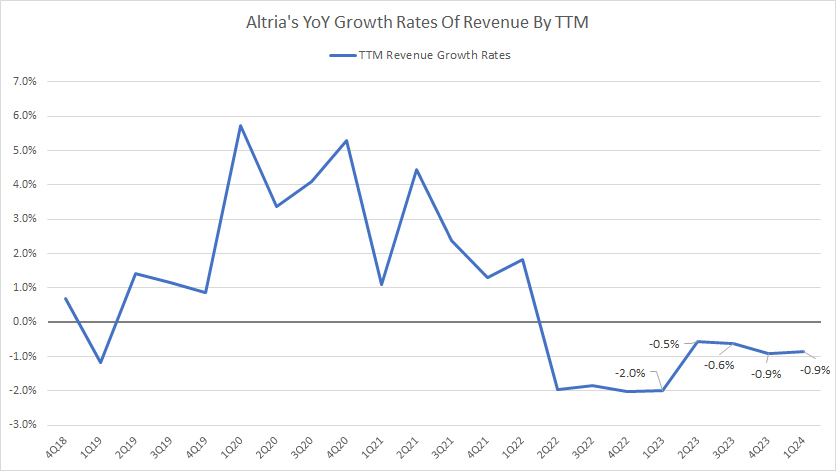
The growth rate plot above shows that Altria’s revenue growth has remained stagnant since 2022 and significantly slowed in recent quarters.
In fact, Altria’s revenue growth has been negative over the last several quarters, driven primarily by the decrease in cigarette sales. On average, Altria has recorded an average growth rate of -1.0% each quarter between 1Q 2023 and 1Q 2024.
Although Altria is shifting towards alternative nicotine delivery systems, such as e-cigarettes, vaping products, and heat-not-burn devices, these secondary income streams have not been able to make a significant impact on revenue growth.
Net Earnings And Earnings Per Share
Altria profitability
(click image to expand)
The definition of Altria’s adjusted earnings is available here: adjusted-earnings.
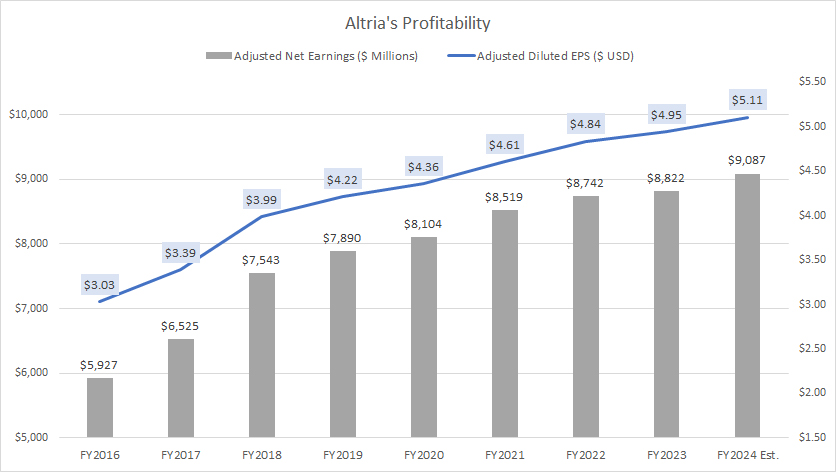
Altria is a highly profitable company, as shown by the increasing adjusted net earnings and adjusted EPS presented in the chart above.
In fact, Altria has never made a loss in any periods presented in the chart.
As seen, Altria’s adjusted net earnings and EPS have significantly risen since 2016, topping $8.8 billion and $4.95 per share, respectively, as of 2023.
Looking ahead, Altria has guided for an adjusted EPS of $5.11 per share midpoint, representing a rise of 3% from the previous year.
Based on the same growth rate as the adjusted EPS, Altria’s adjusted net earnings may reach $9.1 billion by the end of fiscal year 2024.
Gross Margin, OCI Margin And Operating Profit Margin
Altria margins
(click image to expand)
You can find the definition of Altria’s OCI or operating companies income here: operating companies income (OCI).
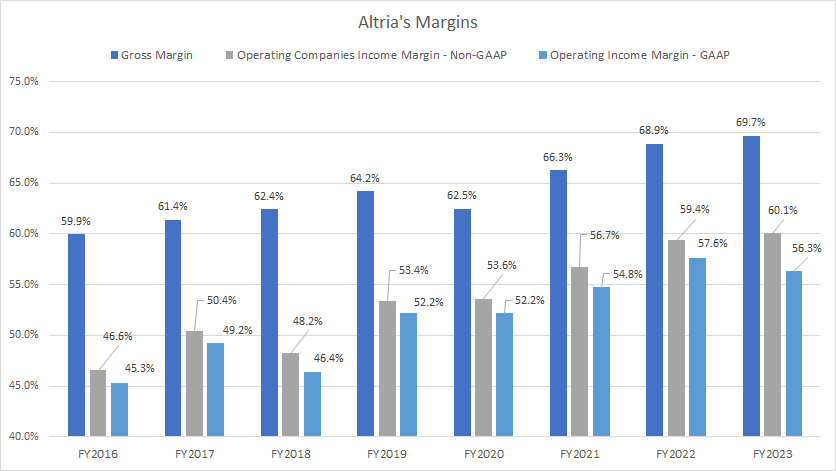
Altria is not just a profitable company but an insanely profitable one. As seen, Altria’s gross margin topped nearly 70% as of 2023, while the GAAP-version operating income margin reached 56.3%.
Altria has been able to increase its gross margin over time due to its ability to raise prices consistently. Altria’s consistent price rise illustrates the company’s strong pricing power and its massive moat in the U.S.
In addition, Altria’s operating efficiency also has considerably improved, as reflected in the growing OCI margin and operating income margin presented in the chart above.
For example, Altria’s OCI margin has risen from 46.6% in 2016 to 60% as of 2023, while the operating profit margin has risen from 45.3% in 2016 to 56.3% as of 2023, a record figure since 2016.
Therefore, Altria is capable of raising prices and operating efficiently. In short, Altria runs an incredibly high-margin business.
Revenue By Product Segment
Altria revenue by product segment
(click image to expand)
You may find more information about Altria’s segments here: Altria’s operating segments.
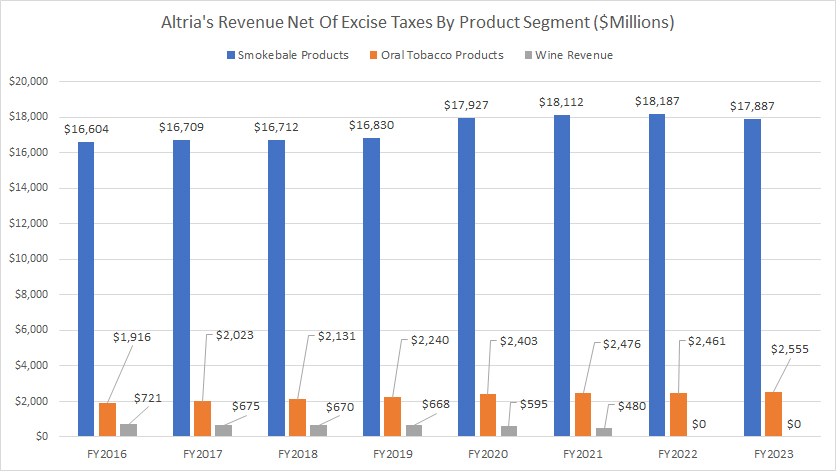
Altria has divested its wine segment since 2021; therefore, the revenue for wine products has come to nil since 2022.
That said, Altria’s revenue from the smokeable product segment is among the largest, topping $17.9 billion in fiscal year 2023, about 1.6% lower than the $18.2 billion reported in 2022.
On the other hand, Altria earned only $2.6 billion in revenue under the oral tobacco product segment, a much smaller figure than the smokeable product segment.
While revenue has steadily risen in the smokeable product segment, the oral tobacco product segment has grown much faster.
Since 2016, revenue from the smokeable product segment has risen by only 8%, while the oral tobacco product segment has risen by a staggering 33%.
Therefore, Altria’s oral tobacco product segment has a much faster revenue growth than the smokeable product segment.
Revenue By Product Segment In Percentage
Altria-revenue-by-product-segment-in-percentage
(click image to expand)
You may find more information about Altria’s segments here: Altria’s operating segments.
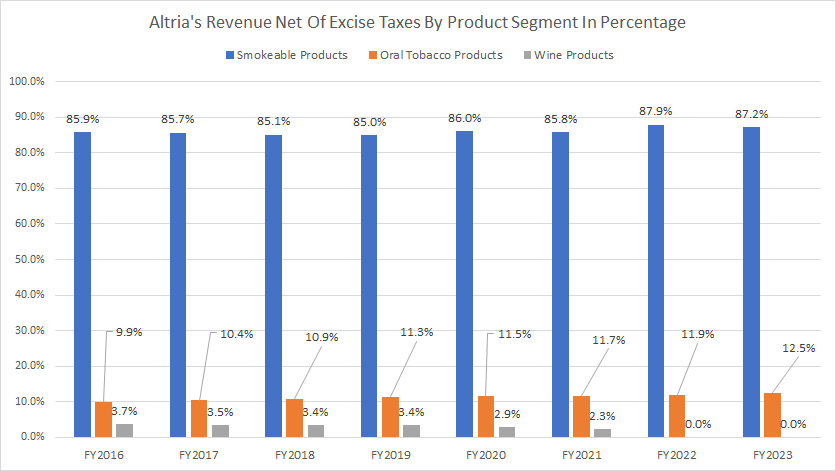
From a percentage perspective, Altria’s smokeable product revenue accounted for 87% of its total revenue in 2023, one of the highest figures ever reached since 2016. This ratio was 88% in fiscal year 2022 and has grown particularly fast since 2022 after divesting the wine product segment.
On the other hand, Altria’s oral tobacco product segment accounted for only 12.5% of its total revenue in 2023, up slightly from 11.9% in 2022. This ratio also has steadily increased, but still not big enough to reduce the company’s dependence on cigarette sales.
Therefore, as of 2023, Altria was still pretty much a cigarette company, with the majority of its sales volume, notably at 87% as of 2023, coming from smokeable products such as cigarettes and cigars.
Annual Growth Rates Of Revenue By Product Segment
Altria-growth-rates-of-revenue-by-product-segment
(click image to expand)
You may find more information about Altria’s segments here: Altria’s operating segments.
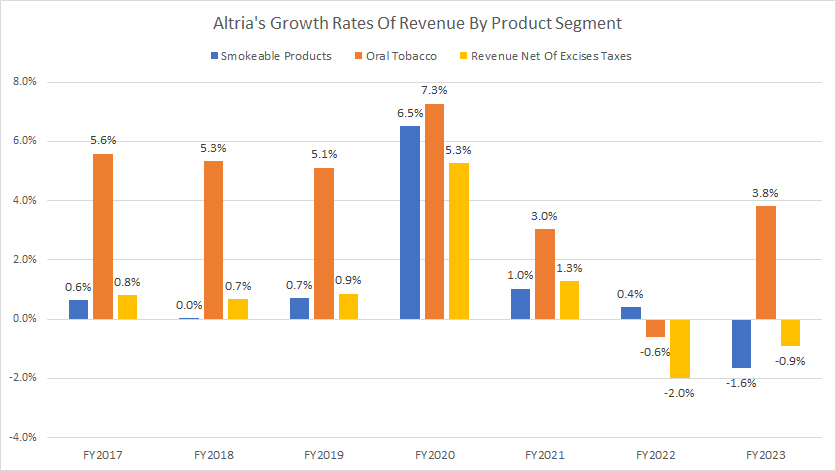
Altria’s revenue growth across all segments was among the worst in 2022, as shown in the chart above. Revenue growth recovered slightly in 2023, but the smokeable product segment experienced a significant decrease.
Globally, Altria’s revenue net of excise taxes decreased by 0.9% in fiscal year 2023 over 2022, compared to a much worse decline of 2.0% in 2022 over 2021.
In fiscal year 2023, Altria’s oral tobacco segment grew by an impressive number of 3.8%, the highest ever measured since 2021.
Profitability By Product Segment
Altria profit by product segment
(click image to expand)
You may find more information about Altria’s segments and the OCI here: Altria’s operating segments and OCI.
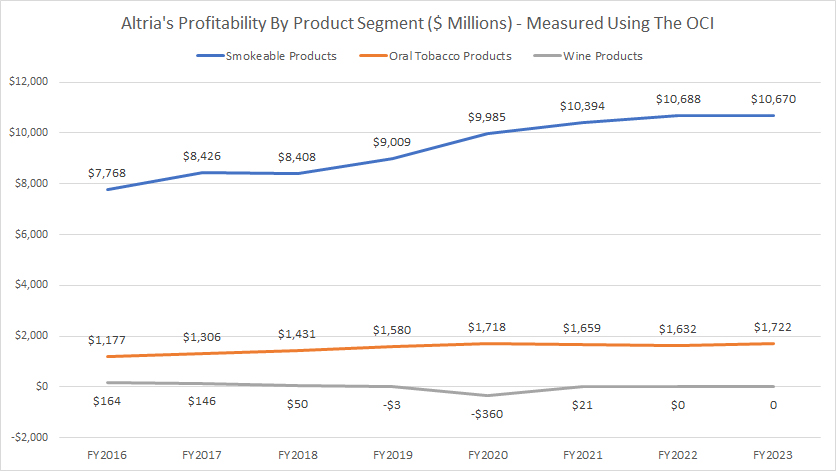
Altria’s smokeable or combustible product segment is among the most profitable, with the OCI topping nearly $11 billion as of 2023, a far higher figure than any other segment.
Apart from being the largest, the profitability of the smokeable product segment also has significantly risen since 2016 and has experienced a comparable growth rate as the oral tobacco product segment, despite its size.
For example, Altria’s smokeable product OCI has grown by 37% since 2016, while the oral tobacco segment has registered a growth rate of 46% during the same period.
Although the OCI of the oral tobacco product segment is far smaller, it has significantly grown since 2016, reaching $1.7 billion as of 2023, the highest ever measured.
Altria’s wine segment was not profitable due to its smaller OCI compared to other segments. As seen in the chart, it suffered an OCI loss of up to $360 million in fiscal 2020 before turning a profit of just $21 million in 2021. Therefore, Altria has divested its wine business since 2021 to avoid further losses.
Again, in 2023, Altria remained primarily a cigarette company, with the majority of its profits coming from combustible products.
Margin By Product Segment
Altria margin by product segment
(click image to expand)
You may find more information about Altria’s segments and the OCI here: Altria’s operating segments and OCI.
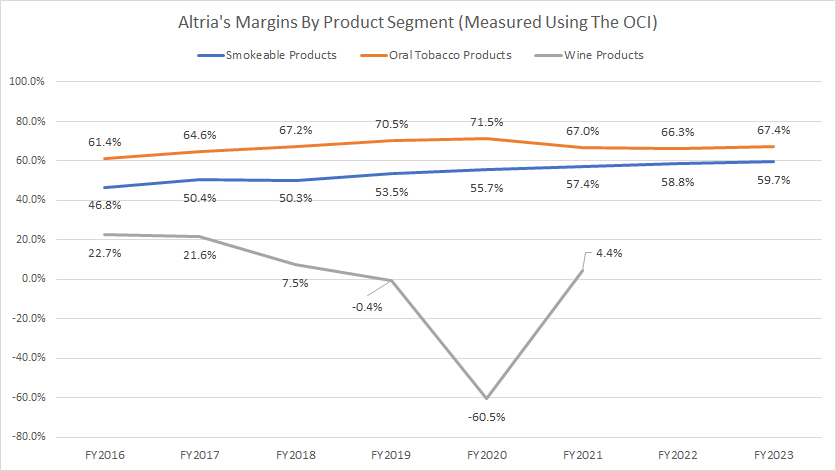
Altria’s oral tobacco product segment has experienced a much higher OCI margin than the smokeable production segment. Therefore, Altria’s oral tobacco product segment is much more profitable than the combustible product segment despite having a far lower OCI value.
As of 2023, Altria’s OCI margin in the oral tobacco product segment topped 67.4%, while the combustible product segment came in at 59.7%, nearly comparable to that of the smokeless product segment.
A noticeable trend is the decline in the margins of the oral tobacco product segment. Altria achieved a peak OCI margin of 71.5% in fiscal year 2020 for its oral tobacco product segment. Since 2020, this ratio has declined considerably, reaching 67.4% as of 2023.
Annual Growth Rates Of Profitability By Product Segment
Altria-growth-rates-of-profitability-by-product-segment
(click image to expand)
You may find more information about Altria’s segments and the OCI here: Altria’s operating segments and OCI.
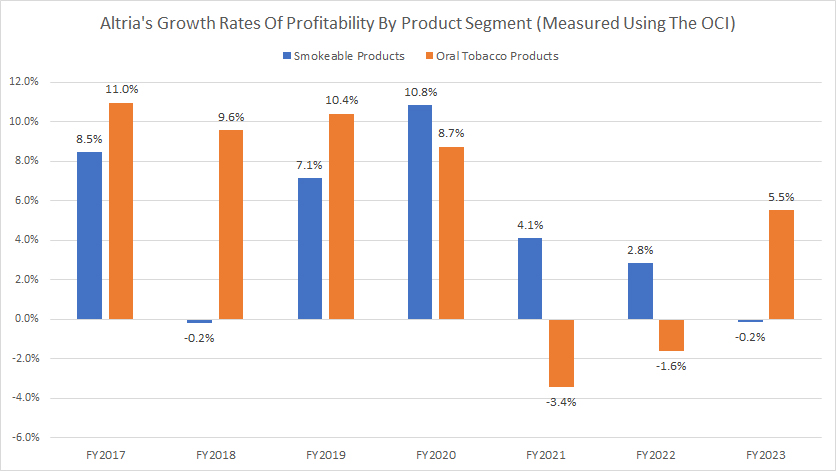
The growth rate plot above shows that the profitability of Altria’s oral tobacco product segment has significantly slowed in post-pandemic periods.
As seen, Altria has experienced consecutive negative OCI growth in the oral tobacco product segment since 2021. However, the YoY growth rate of this segment recovered in 2023 to 5.5%.
Although smokeable product OCI growth rates remained positive, they significantly slowed post-pandemic. As of 2023, Altria’s OCI growth in the smokeable product segment was a decline of 0.2%, compared to a growth of 2.8% in the previous year.
Therefore, the concern over slowing profit growth and declining margins in both the smokeable and oral tobacco product segments is legitimate.
Conclusion
Altria’s main revenue and profit still come from the smokeable or combustible product segment, whose primary products are cigarettes and cigars.
The company has not seen significant progress in the oral tobacco product segment, where margins have decreased and profitability has declined, especially during the post-pandemic period.
In summary, Altria was still pretty much a cigarette and cigar company as of 2023.
References and Credits
1. All financial figures presented in this article were obtained and referenced from Altria’s annual and quarterly reports, SEC filings, investor presentations, earnings reports, press releases, etc., which are available in Altria Investors Relation.
2. Featured images in this article are used under Creative Commons license and sourced from the following websites: Thomas Hawk and g0dd4mn[LZW].
Disclosure
References and examples such as tables, charts, and diagrams are constantly reviewed to avoid errors, but we cannot warrant the total correctness of all content.
The content in this article is for informational purposes only and is neither a recommendation nor a piece of financial advice to purchase a stock.
If you find the information in this article helpful, please consider sharing it on social media and provide a link to this article from any website so that more articles like this can be created.
Thank you!

