Social media space. Pixabay Image.
Pinterest (PINS), a leading social media platform, has more than 500 million monthly active users globally, according to the company’s latest filings.
That said, this article presents the revenue and revenue breakdown of the social media company. Apart from revenue, we also look at Pinterest’s profitability and margins.
In addition, Pinterest’s revenue by geographical region will also be examined. Pinterest’s geographical regions include the U.S. & Canada, Europe, and the Rest Of World. Europe includes Russia and Turkey.
Let’s take a look!
Please use the table of contents to navigate this page.
Table Of Contents
Definitions And Overview
O2. Pinterest Business Strategy
O3. How Does Pinterest Earn Revenue
Consolidated Revenue
A1. Revenue By Year
A2. Revenue By Quarter
A3. Revenue By TTM
A4. YoY Growth Rates Of Revenue By TTM
Consolidated Profits And Margins
B1. Gross Profit, Operating Profit, And Adjusted EBITDA
B2. Gross Margin, Operating Margin, And Adjusted EBITDA Margin
Regional Revenue
C1. U.S. And Canada, Europe, And Rest Of World Revenue
C2. U.S. And Canada, Europe, And Rest Of World Revenue In Percentage
C3. Growth Rates Of U.S. And Canada, Europe, And Rest Of World Revenue
Summary And Reference
S1. Conclusion
S2. References and Credits
S3. Disclosure
Definitions
To help readers understand the content better, the following terms and glossaries have been provided.
Adjusted EBITDA: Pinterest defines the Adjusted EBITDA as net income (loss) adjusted to exclude depreciation and amortization expense, share-based compensation expense, interest income, interest expense and other income (expense), net, provision for income taxes, non-cash charitable contributions, and other non-recurring or one-off expenses.
The purpose of the Adjusted EBITDA is to evaluate the company’s operating results and for financial and operational decision-making purposes.
Pinterest believes the Adjusted EBITDA helps identify underlying trends in its businesses that could otherwise be masked by the effect of the income and expenses it excludes.
This measure provides an additional tool for investors to compare Pinterest’s core business operating results over multiple periods with other companies operating in the same industry.
Revenue By Region: According to Pinterest, Inc., revenue by region is geographically apportioned based on its estimate of the geographic location of its users when they perform a revenue-generating activity.
This allocation is consistent with how the company’s Average Revenue Per User is determined.
Pinterest Business Strategy
Pinterest’s business strategy is centered around being a visual discovery and bookmarking tool that helps users discover new ideas, inspire creativity, and find information through images, GIFs, and videos. The platform operates on a unique model that blends social networking with personalized content curation, allowing users to “pin” content to their boards for later access and sharing with others.
Key components of Pinterest’s business strategy include:
1. **User Growth and Engagement:** Pinterest focuses on growing its user base and keeping users engaged by continuously enhancing its recommendation algorithms, making it easier for users to discover content that matches their interests. The platform encourages user interaction by creating, sharing, and discovering pins.
2. **Advertising and Monetization:** Pinterest generates revenue primarily through advertising. The platform offers businesses and advertisers various advertising products, including promoted pins, video ads, and shopping ads, seamlessly integrated into the user experience. Pinterest’s rich user data allows for targeted advertising based on interests, search behavior, and interaction with content, making it an attractive platform for advertisers looking to reach a highly engaged audience.
3. **E-commerce Integration:** Recognizing the platform’s potential as a driver of online shopping, Pinterest has been enhancing its e-commerce capabilities. Features like shoppable pins, visual search, and product catalogues allow users to discover and purchase products directly through the platform. This improves the user experience and opens up new revenue streams for Pinterest through partnerships with retailers and e-commerce platforms.
4. **International Expansion:** Pinterest has been expanding its global presence by tailoring its platform to cater to users in different regions, optimizing for local content and languages. This strategy aims to grow its user base outside its core markets and tap into new advertising markets.
5. **Investment in Technology and Innovation:** Continuous investment in technology, such as machine learning and artificial intelligence, is a key part of Pinterest’s strategy. These technologies enhance content discovery, improve ad targeting, and create a more personalized and engaging user experience.
Overall, Pinterest’s business strategy is focused on leveraging its unique position as a visual discovery platform to grow its user base, enhance user engagement, and drive revenue through advertising and e-commerce, all while continuously innovating and expanding globally.
How Does Pinterest Earn Revenue
Pinterest generates revenue primarily through advertising, specifically with a model known as promoted pins. Promoted pins are advertisements placed by businesses that look similar to regular pins but are paid for to appear in more prominent positions on Pinterest, such as in search results, home feeds, or category pages, making them more likely to be seen by users. These ads can be targeted based on demographics, interests, and behaviors to reach specific audiences.
Additionally, Pinterest has introduced other revenue streams over the years, including shopping features that allow users to purchase products directly from pins, further leveraging its position as a discovery platform for users planning projects, hobbies, and purchases. This e-commerce integration provides another avenue for Pinterest to monetize its services by either taking a cut from sales made through the platform or charging businesses for enhanced shopping features.
Pinterest also periodically explores new features and services that could potentially open up additional revenue streams, staying responsive to user behavior and market trends.
Revenue By Year
Pinterest-revenue-by-year
(click image to expand)
Pinterest has been experiencing a consistent rise in its revenue over the years. The company’s revenue has grown from $756 million in 2018 to $3.1 billion as of 2023, representing a growth rate of 310% over five years or sligtly over 60% on average per year.
As of 2023, Pinterest’s global revenue reached a record figure of $3.1 billion, up $252 million or 9% over 2022.
Revenue By Quarter
Pinterest-revenue-by-quarter
(click image to expand)
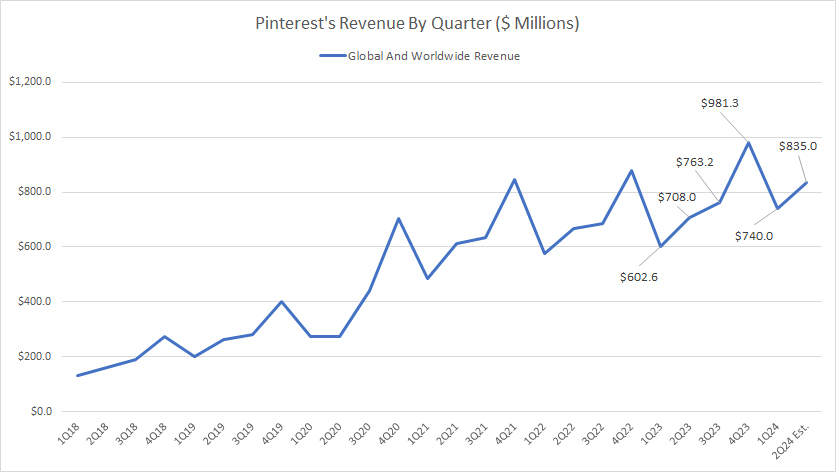
Pinterest’s quarterly revenue totaled $740 million in fiscal 1Q 2024, up 22% from a year ago. On average, Pinterest has earned an average revenue of $759 million each quarter since 1Q 2023. It is expected to reached a minimum of $835 million in 2Q 2024, as stated by the company’s 1Q 2024 earning release.
Despite the challenges posed by the pandemic, Pinterest’s revenue has continued to grow, primarily driven by advertising and e-commerce features on the platform.
The company’s persistent revenue growth is a testament to its ability to provide value to its users and advertisers alike.
Revenue By TTM
Pinterest-revenue-by-ttm
(click image to expand)
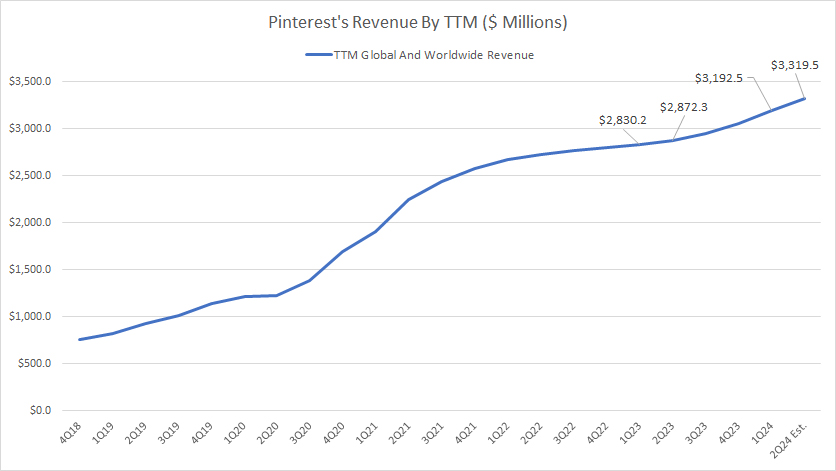
The TTM plot above is much smoother than the quarterly plot, clearly depicting the consistent rise of Pinterest’s advertising sales.
That said, Pinterest’s TTM revenue reached a record high of $3.2 billion as of 1Q 2024, and is expected to further grow to $3.3 billion in the next quarter.
Despite the consistent revenue growth in most periods, Pinterest’s revenue growth has probably slowed in the post-pandemic era.
The chart shows that the TTM revenue plot in the post-pandemic era does not look as steep as in the pre-pandemic period.
YoY Growth Rates Of Revenue By TTM
Pinterest-revenue-by-ttm-growth-rates
(click image to expand)
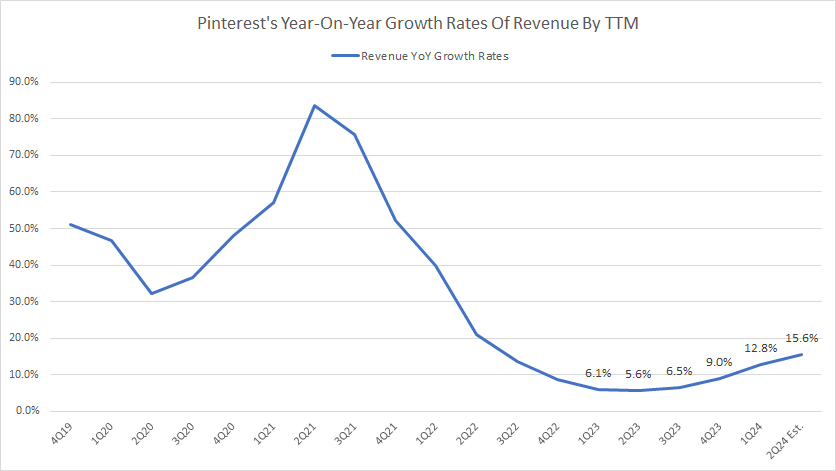
The growth rate plot above shows that Pinterest’s revenue growth has indeed slowed in the post-pandemic era.
As shown in the plot above, Pinterest’s YoY revenue growth amounted to 12.8% as of 1Q 2024, compared to 6.1% recorded a year ago. In the next quarter, Pinterest’s TTM revenue is expected grow by 15.6%, primarily driven by the record quarterly revenue of $835 million guided by the company.
Pinterest’s YoY revenue growth rate since 1Q 2023 has averaged just 8% each quarter, highlighting the significant slowdown of the company’s advertising sales.
Moreover, the curve shown in the chart above has been on a slide since 2021, underscoring the company’s challenges to grow its advertising revenue in the post-pandemic periods.
However, revenue growth may return in fiscal year 2024, as depicted in the chart above, which shows a steady rise of the growth rates since 2023.
Gross Profit, Operating Profit, And Adjusted EBITDA
Pinterest-profitability
(click image to expand)
The definition of Pinterest’s adjusted EBITDA is available here: adjusted EBITDA.
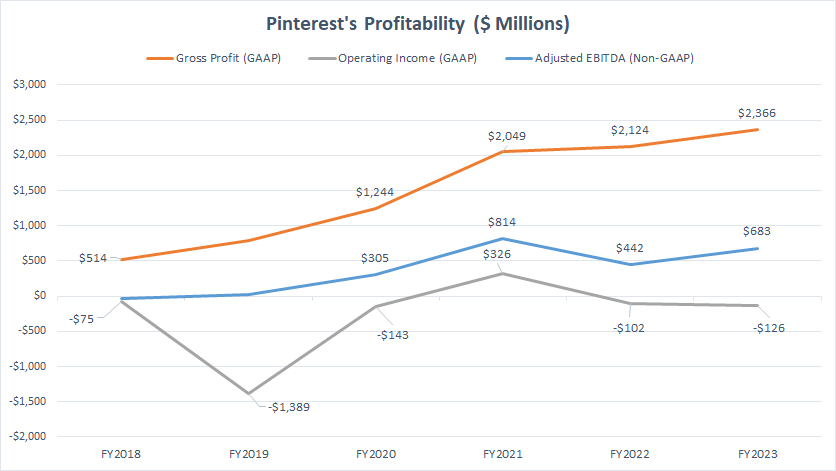
Pinterest’s gross profit has consistently grown over the years, reaching a record figure of $2.4 billion in fiscal 2023, up 11% over 2022.
While gross profit has risen, other profitability metrics such as operating income and adjusted EBITDA have declined.
For example, Pinterest’s non-GAAP adjusted EBITDA was down significantly in 2022, topping only $442 million compared to $814 million in the prior year. In fiscal 2023, the non-GAAP adjusted EBITDA rose 54% year-over-year to $683 million.
In terms of operating profit, Pinterest has consistently incurred operating losses, illustrating the unprofitable nature of the company’s operations. Pinterest has consecutively incurred operating losses of $102 million and $126 million in fiscal year 2022 and 2023, respectively.
In short, Pinterest generates inconsistent profit and has yet to turn a profit.
Gross Margin, Operating Margin, And Adjusted EBITDA Margin
Pinterest’s margins
(click image to expand)
The definition of Pinterest’s adjusted EBITDA is available here: adjusted EBITDA.
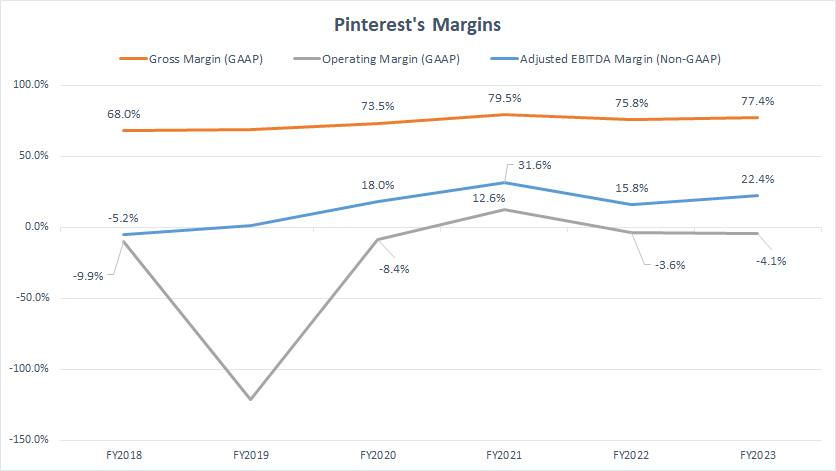
Pinterest has generated impressive gross margins in most fiscal years, topping as much as 77% in fiscal 2023, up slightly from 76% in 2022. Pinterest’s gross margin in fiscal 2021 was even more impressive at nearly 80%.
Since 2018, Pinterest’s gross margin has steadily risen, illustrating the massive profit the company has raked in at the gross level.
While Pinterest produces impressive gross margins, its other profit margins are mediocre. For example, Pinterest produced an adjusted EBITDA margin of 22.4% in fiscal 2023, up significantly from the 15.8% in 2022 but massively down from the 31.6% in 2021.
As Pinterest has reeled in operating losses consistently, its operating margin has been mainly in the red, illustrating the substantial operational expenses incurred by the company.
Although Pinterest produced an operating margin of 12.6% in 2021, this figure reversed to -3.6% and -4.1% in 2022 and 2023, respectively, primarily driven by the significant increase in operating expenses, especially in sales and marketing as well as research and development.
U.S. And Canada, Europe, And Rest Of World Revenue
Pinterest’s revenue by region
(click image to expand)
The definition of Pinterest’s revenue by region is available here: revenue by region.
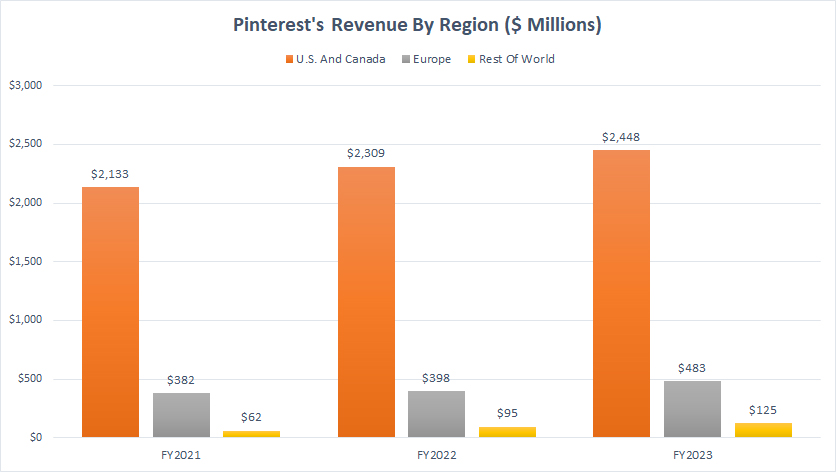
Pinterest earned $2.4 billion in annual revenue in the U.S. and Canada in 2023, up 6% over 2022. Pinterest’s sales from the North American region are by far the biggest source of revenue for the social media giant.
For Europe, Pinterest’s revenue in this segment totaled $483 million in fiscal year 2023, while revenue from the Rest Of World region came in at $125 million in the same period.
Pinterest has experienced significant revenue growth in all regions and countries over the last three years. Since 2021, Pinterest’s revenue from the U.S. and Canada has risen by 15%, while revenue in Europe has grown by 26%. Rest Of World’s revenue has doubled since 2021.
In short, the largest revenue stream for Pinterest is from the U.S. and Canada (North America), while the Rest Of World contributes the least revenue to the social media giant.
U.S. And Canada, Europe, And Rest Of World Revenue In Percentage
Pinterest’s revenue share by region
(click image to expand)
The definition of Pinterest’s revenue by region is available here: revenue by region.
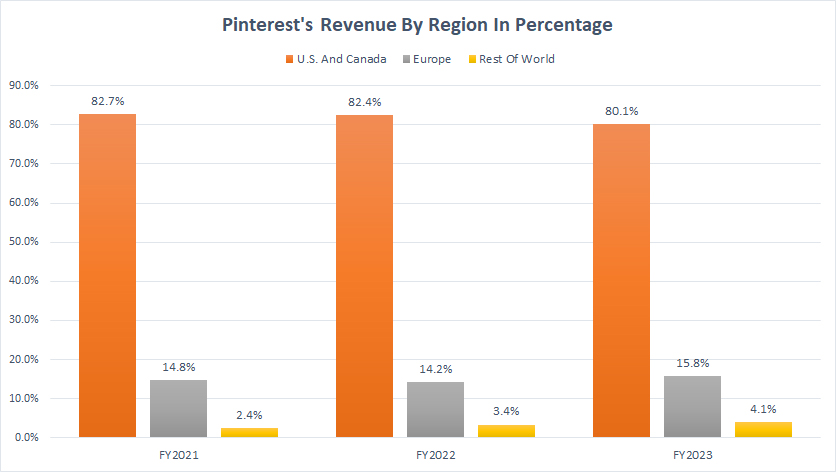
Pinterest’s sales from the U.S. and Canada has accounted for the biggest portion, totaling 82.7%, 82.4%, and 80.1% in fiscal year 2021, 2022, and 2023, respectively.
On the contrary, Pinterest’s Europe revenue represented only 15.8% of the total revenue in 2023, up slightly from the 14.2% in 2022.
Pinterest’s revenue from Rest Of World formed just 4.1% of the total revenue in 2023. This ratio was up from the 3.4% in 2022.
A noticeable trend is the rising revenue share in Europe and the Rest Of World region in the last three years. On the other hand, the revenue share from the U.S. and Canada has slightly decreased since 2021, from nearly 83% in 2017 to 80% as of 2023.
Growth Rates Of U.S. And Canada, Europe, And Rest Of World Revenue
Pinterest’s revenue by region growth rates
(click image to expand)
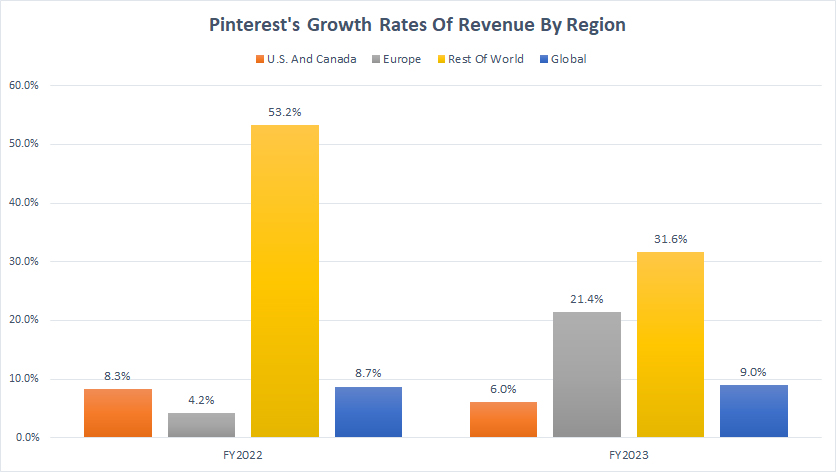
Pinterest’s global revenue grew by 9.0% in 2023, compared to 8.7% in 2022. Pinterest’s global revenue growth is expected to be aligned with those of the U.S. and Canada because this region forms the majority of sales, totaling 80% in 2023.
Pinterest’s revenue from the Rest Of World region has grown the fastest among all regions, with YoY groswth rate reaching 53.2% and 31.6% in fiscal years 2022 and 2023, respectively.
On the other hand, Pinterest’s U.S. and Canada revenue grew just 8.3% and 6.0% in 2022 and 2023, respectively, the lowest among all countries.
Pinterest’s revenue growth from Europe reached a massive 21.4% in fiscal year 2023, compared to just 4.2% in 2022.
Summary
To recap, Pinterest’s revenue has consistently grown despite the challenges posed by the pandemic.
Despite experiencing significant revenue growth, the company remains unprofitable due to its substantial and escalating operating expenses.
Nevertheless, Pinterest has been able to provide value to its users and advertisers, which has contributed to its success in the competitive social media landscape.
References and Credits
1. All financial figures presented in this article are referenced and obtained from the company’s quarterly and annual reports, investor presentations, press releases, earnings releases, SEC filings, webcast, etc., which are available in Pinterest Investor Relation.
2. Pinterest’s business strategies and revenue streams are referenced and obtained from documentations available in All About Pinterest, How Pinterest Businesses Work, Pinterest’s Guides And Education.
3. Image by Gerd Altmann from Pixabay
Disclosure
References and examples such as tables, charts, and diagrams are constantly reviewed to avoid errors, but we cannot warrant the total correctness of all content.
The content in this article is for informational purposes only and is neither a recommendation nor a piece of financial advice to purchase a stock.
If you find the information in this article helpful, please consider sharing it on social media and provide a link to this article from any website so that more articles like this can be created.
Thank you!


