Data analytic. Pexels Images.
This article looks at the research and development (R&D) spending comparison between Palantir Technologies and NVIDIA Corporation. Palantir Technologies and Nvidia are both prominent companies in the tech industry, but they operate in different spaces and offer distinct products and services.
For example, Palantir specializes in big data analytics and software platforms for integrating and analyzing data. On the other hand, Nvidia is a leading company in the field of artificial intelligence (AI) and graphics processing units (GPUs).
Although both companies differ in their specializations and areas of focus, they have both experienced significant growth and have become influential in their respective fields.
In addition, Palantir and Nvidia have invested substantial resources into research and development, consistently striving to excel in their respective fields and push the boundaries of innovation.
Let’s take a closer look at the R&D expenditures of both companies!
Investors looking for other statistics of Palantir and Nvidia may find more resources on these pages:
Please use the table of contents to navigate this page.
Table Of Contents
Definitions And Overview
- Portion Of R&D Incurred As Stock-Based Compensation (SBC) Expenses
- R&D To Revenue Ratio
- R&D To Gross Profit Ratio
- R&D To Operating Expenses Ratio
O2. Who Is Winning The R&D Race?
R&D Spending
A1. Palantir Vs Nvidia In R&D Spending
Portion Of R&D As SBC
B1. Palantir Vs Nvidia In Portion Of R&D Incurred As SBC Expenses
R&D Spending To Revenue
C1. Palantir Vs Nvidia In R&D To Revenue Ratio
R&D Spending To Gross Profit
D1. Palantir Vs Nvidia In R&D To Gross Profit Ratio
R&D Spending To OPEX
E1. Palantir Vs Nvidia In R&D To Operating Expenses Ratio
Summary And Reference
S1. Summary
S2. References and Credits
S3. Disclosure
Definitions Of Ratio
To help readers understand the content better, the following terms and glossaries have been provided.
Portion Of R&D Incurred As Stock-Based Compensation (SBC) Expenses: The Portion of R&D Incurred As Stock-Based Compensation Expenses measures the percentage of a company’s total research and development (R&D) budget used to compensate employees through stock-based compensation.
This metric provides insight into how much of the R&D budget is dedicated to incentivizing and retaining talent via stock options or shares, rather than direct research and development activities. It’s calculated using the following formula:
\[\text{Portion Of R&D Incurred As SBC Expenses} = \left( \frac{\text{SBC Expenses For R&D}}{\text{Total R&D Spending}} \right) \times 100\%\]
This helps stakeholders understand the portion of R&D expenditures directed towards stock-based compensation.
R&D To Revenue Ratio: The R&D to revenue ratio is a financial metric measuring the proportion of a company’s revenue that is spent on research and development (R&D).
It is calculated by dividing the total R&D expenditures by the total revenue, usually expressed as a percentage. This ratio helps investors and analysts understand how much a company is investing in innovation and future growth relative to its sales.
The formula for the R&D to revenue ratio is:
\[\text{R&D to Revenue Ratio} = \left( \frac{\text{R&D Expenditures}}{\text{Total Revenue}} \right) \times 100\%\]
A higher R&D to revenue ratio indicates a stronger commitment to innovation and development, which can be crucial for long-term growth and competitiveness.
R&D To Gross Profit Ratio: The R&D to gross profit ratio is a financial metric measuring the proportion of a company’s gross profit that is spent on research and development (R&D).
This ratio helps investors and analysts evaluate how much of a company’s gross profit is being reinvested into innovation and future growth.
The formula for the R&D to gross profit ratio is:
\[\text{R&D to Gross Profit Ratio} = \left( \frac{\text{R&D Expenditures}}{\text{Gross Profit}} \right) \times 100\%\]
A higher R&D to gross profit ratio indicates a greater investment in innovation relative to the company’s profitability, which can be a sign of a commitment to long-term growth and competitiveness.
R&D To Operating Expenses Ratio: The R&D to operating expenses ratio is a financial metric measuring the proportion of a company’s operating expenses that are spent on research and development (R&D).
This ratio helps evaluate how much of the company’s total expenses are dedicated to innovation and future growth efforts.
The formula for the R&D to operating expenses ratio is:
\[\text{R&D to Operating Expenses Ratio} = \left( \frac{\text{R&D Expenditures}}{\text{Total Operating Expenses}} \right) \times 100\%\]
A higher R&D to operating expenses ratio indicates a greater commitment to innovation relative to the company’s overall spending, which can be a positive indicator of future growth potential. Comparing this ratio with industry peers can provide additional insights into a company’s investment in research and development.
Who Is Winning The R&D Race?
Nvidia’s R&D expenditures are significantly higher than those of Palantir Technologies, reflecting Nvidia’s focus on cutting-edge technologies like AI and GPUs.
Palantir, while investing less in absolute terms, still dedicates a substantial portion of its resources to R&D, particularly in data analytics and integration.
Palantir Vs Nvidia In R&D Spending
palantir-vs-nvidia-in-research-and-development
(click image to expand)
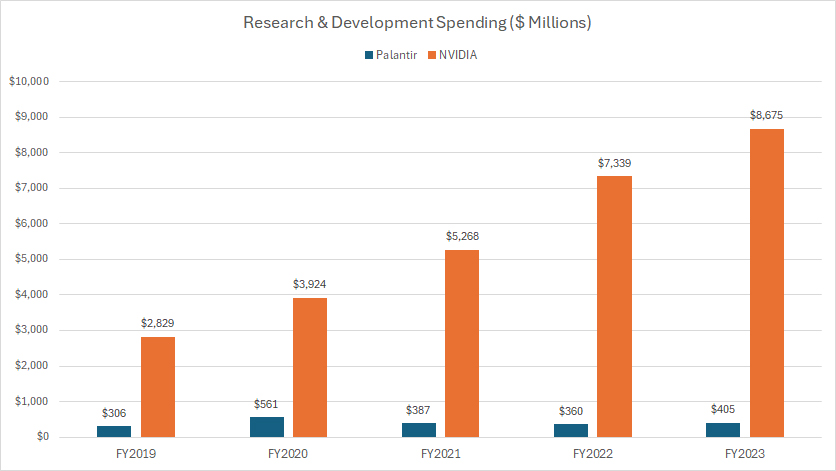
As shown in the chart above, Nvidia’s investment in R&D has consistently been much higher than Palantir’s. This trend is apparent across all the fiscal years depicted in the chart.
In addition to having significantly higher research and development expenses, Nvidia’s R&D spending has consistently increased, growing from $2.8 billion in fiscal year 2019 to an impressive $8.7 billion in fiscal year 2023.
In contrast, Palantir’s investment in research and development is significantly smaller than Nvidia’s. The company allocated only $405 million to R&D in fiscal year 2023. This represents a decrease of approximately 28% compared to the $561 million spent on R&D in fiscal year 2020.
As a result, Palantir’s R&D spending has declined since fiscal year 2020. Additionally, Palantir’s R&D expenditures in fiscal years 2021 and 2022 were markedly lower, at $387 million and $360 million, respectively.
One of the main reasons behind Nvidia’s significantly higher R&D spending is its substantially larger sales revenue compared to Palantir. For instance, in fiscal year 2023, Nvidia generated over $60 billion in revenue, whereas Palantir’s revenue was $2.2 billion for the same period. Similarly, in fiscal year 2022, Nvidia’s revenue was $27 billion, which is approximately 13.5 times higher than Palantir’s revenue.
In short, given the significantly higher revenue generated by Nvidia compared to Palantir, it is reasonable to expect Nvidia to allocate more resources to research and development.
Palantir Vs Nvidia In Portion Of R&D Incurred As SBC Expenses
palantir-vs-nvidia-in-research-and-development-incurred-as-sbc-expense
(click image to expand)
You can find the definition of the portion of R&D incurred as SBC expenses here: portion of R&D incurred as stock-based compensation (SBC) expenses.
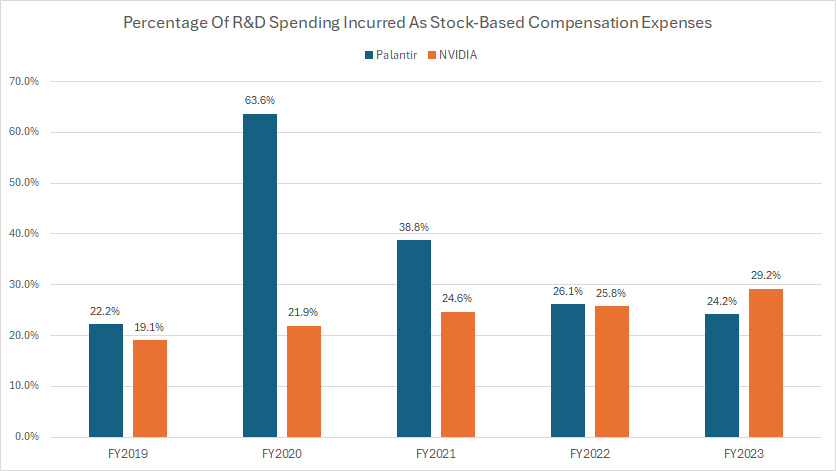
Most companies, especially those with substantial research and development expenditures like Palantir and Nvidia, prefer to compensate employees with stock options. Therefore, it is unsurprising that a significant portion of their research and development expenses is attributed to stock-based compensation, as illustrated in the chart above.
As illustrated in the graph above, the average percentage of R&D spending attributed to stock-based compensation over the past three years was approximately 30% for Palantir and 27% for Nvidia. This translates to about $115 million for Palantir and $1.9 billion for Nvidia.
In fiscal year 2023, approximately 24% of Palantir’s R&D expenditure was attributed to stock-based compensation expenses, amounting to around $98 million. In comparison, 29% of Nvidia’s R&D spending was attributed to stock-based compensation, totaling about $2.5 billion.
A significant trend is that Nvidia’s ratio has substantially increased from 19% in fiscal year 2019 to 29% over four years. Conversely, Palantir’s ratio has seen only a slight rise, from 22% to 24% during the same period.
Consequently, Nvidia has considerably increased its use of stock-based compensation to reward research and development employees, whereas Palantir has only made modest gains in this area.
Palantir Vs Nvidia In R&D To Revenue Ratio
palantir-vs-nvidia-in-research-and-development-to-revenue
(click image to expand)
You can find the definition of the R&D to revenue ratio here: R&D To Revenue Ratio.
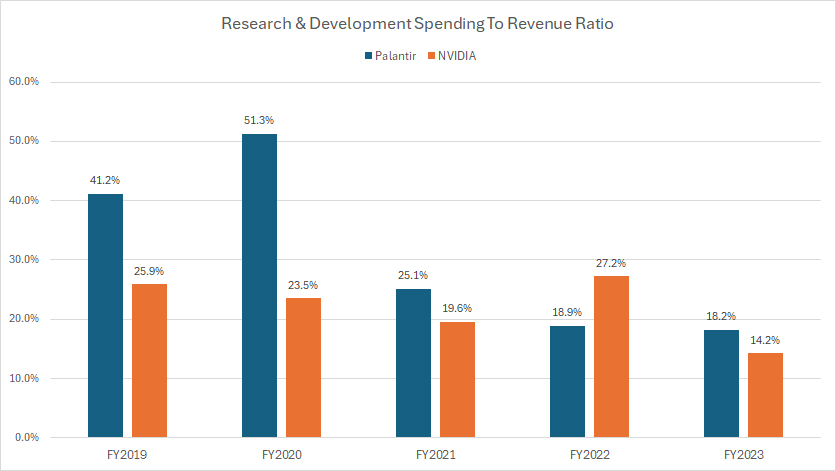
In terms of R&D to revenue, both companies have dedicated a similar portion of their revenue to research and development, as shown in the chart above. Over the last three years, the average R&D to revenue ratio for both companies has been around 20%.
In fiscal year 2023, Palantir’s R&D to revenue ratio was 18%, while Nvidia’s was 14%. The notable decline in Nvidia’s R&D to revenue ratio for fiscal year 2023 can be primarily attributed to a substantial increase in revenue, which more than doubled from the previous fiscal year.
Palantir Vs Nvidia In R&D To Gross Profit Ratio
Palantir-vs-NVIDIA-research-and-development-to-gross-profit
(click image to expand)
You can find the definition of the R&D to gross profit ratio here: R&D To Gross Profit Ratio.
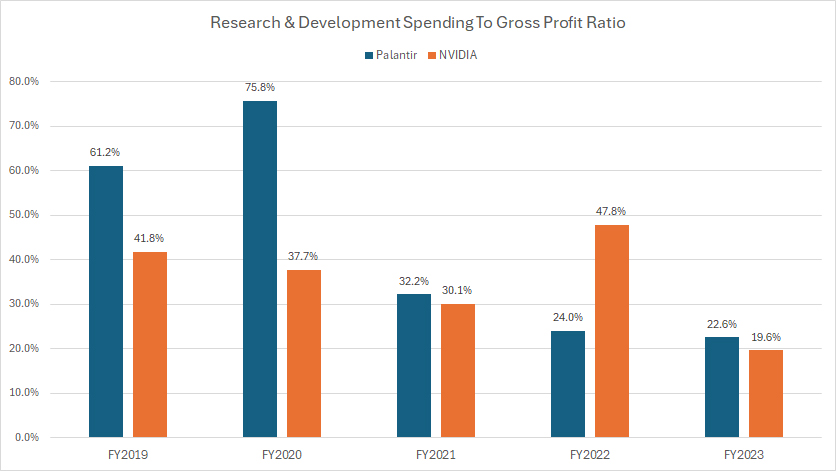
Relative to gross profit, Nvidia allocates a larger portion of its spending to R&D compared to Palantir, as illustrated in the chart above. This disparity is likely due to Palantir’s lower profit margins.
On average, Palantir’s R&D to gross profit ratio was 26% between fiscal years 2021 and 2023, whereas NVIDIA’s was 33% during the same period. Since fiscal year 2021, Palantir’s gross profit has increased by 50%, while NVIDIA’s gross profit has more than doubled.
Palantir Vs Nvidia In R&D To Operating Expenses Ratio
Palantir-vs-NVIDIA-research-and-development-to-opex
(click image to expand)
You can find the definition of the R&D to OPEX ratio here: R&D To Operating Expenses Ratio.
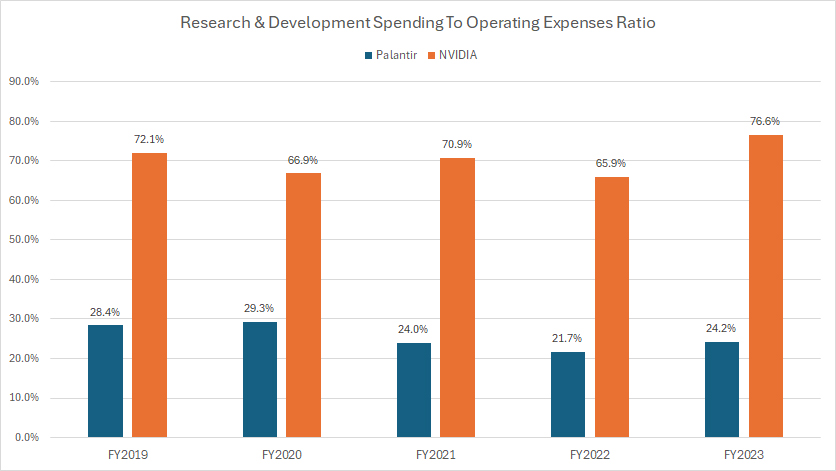
With respect to operating expenses, NVIDIA’s research and development expenditures consume a significantly larger portion compared to Palantir, as depicted in the graph above.
On average, over the last three fiscal years, NVIDIA’s research and development expenditures have accounted for 71% of its total operating expenses, whereas Palantir has allocated just 23% of its operating expenses to R&D.
In fiscal year 2023, NVIDIA’s R&D to operating expenses ratio reached a record high of 77%, compared to Palantir’s 24%. Similarly, in fiscal year 2022, NVIDIA allocated a significantly larger portion of its operating expenses to research and development, with 66% of the total, whereas Palantir’s R&D to operating expenses ratio was just 22%.
A key factor driving Nvidia’s higher R&D budget, as a percentage of its operating expenses, is the company’s significantly higher revenue growth, which provides more financial resources to allocate towards R&D.
Furthermore, Nvidia aims to maintain its leadership in GPUs and AI technologies, necessitating substantial investment in innovation and development. Nvidia’s focus on cutting-edge technologies like AI and data centers requires continuous R&D to stay ahead of competitors.
Conclusion
In summary, Nvidia’s significantly higher R&D spending, driven by its robust revenue growth and focus on maintaining market leadership in cutting-edge technologies, contrasts with Palantir’s more modest and slightly decreasing R&D investments.
References and Credits
1. All financial figures presented in this article were obtained and referenced from Palantir’s annual reports published in the company’s investors relation page: Palantir Financial Reports.
2. Pexels Images.
Disclosure
References and examples such as tables, charts, and diagrams are constantly reviewed to avoid errors, but we cannot warrant the total correctness of all content.
The content in this article is for informational purposes only and is neither a recommendation nor a piece of financial advice to purchase a stock.
If you find the information in this article helpful, please consider sharing it on social media and also provide a link back to this article from any website so that more articles like this one can be created in the future.
Thank you!

