A Tesla sale office. Flickr Image.
This article covers several statistics of Tesla’s inventory, which include the total inventory, inventory breakdown, inventory ratios, days of sales, etc.
Tesla’s inventory comprises all the vehicles and parts it has in stock and available for sale or use in production. They include new vehicles (cars, trucks, etc.), used vehicles, replacement parts, and accessories.
In addition, Tesla’s inventory also includes raw materials and components required for vehicle production. Efficient inventory management is crucial for Tesla to meet customer demand, maintain production schedules, and minimize costs.
As Tesla grows, its inventory has significantly risen over the years. As of 2024, Tesla’s inventory represented over 30% of its current assets, making it the second largest asset after cash.
Tesla’s inventory generates substantial future economic benefits for the company. As such, investors should pay attention to this asset class. A bloating inventory will hurt the company’s financial health, but a properly managed one will bring immersed advantages.
Let’s look at the numbers!
Please use the table of contents to navigate this page.
Table Of Contents
Definitions And Overview
- Inventory To Current Assets Ratio
- Inventory To Revenue Ratio
- Inventory Turnover Ratio
- Inventory Days
- Work In Progress Inventory
- Finished Goods Inventory
O2. How Does Tesla Manage Its Inventory?
O3. What Is In Tesla’s Inventory?
Consolidated Inventory
B1. Inventory Levels
B2. Inventory YoY Growth Rates
Breakdown Of Inventory
C1. Inventory By Components
C2. Inventory By Components In Percentage
Total Inventory To Assets And Revenue Ratios
D1. Total Inventory To Current Assets Ratio
D2. Total Inventory To Revenue Ratio
Inventory Turnover And Days Ratios
E1. Inventory Turnover Ratio
E2. Days Sales In Inventory
E3. Finished Products Inventory Days
Summary And Reference
S1. Summary
S2. References and Credits
S3. Disclosure
Definitions
To help readers understand the content better, the following terms and glossaries have been provided.
Inventory To Current Assets Ratio: The inventory to current asset ratio is a financial metric that compares a company’s inventory to its current assets. This ratio is calculated by dividing the inventory value by the total value of current assets. The formula looks like this:
Inventory to Current Asset Ratio = {Inventory} / {Current Assets}
This ratio provides insights into how much of a company’s current assets are tied up in inventory. It’s an important measure for understanding liquidity and operational efficiency.
A higher ratio may indicate that a significant portion of the company’s resources is invested in inventory, which might suggest issues with inventory management or sales.
Conversely, a lower ratio suggests that the company has a diversified range of current assets, potentially indicating better liquidity and less risk of inventory obsolescence. This ratio is particularly relevant in industries where inventory management is crucial, such as retail, manufacturing, and distribution.
Inventory To Revenue Ratio: The inventory-to-revenue ratio is a financial metric used to evaluate how efficiently a company manages its inventory relative to its sales. It is calculated by dividing the ending inventory balance by the total revenue for the same period. The formula looks like this:
Inventory to Revenue Ratio = {Inventory} / {Revenue}
This ratio helps to understand the proportion of a company’s inventory compared to its revenue. A lower ratio is generally preferred as it indicates that the company is efficiently converting its inventory into sales.
Conversely, a higher ratio may suggest overstocking or inefficiencies in managing inventory, potentially leading to higher holding costs or obsolescence risks. It’s an important indicator for businesses to monitor, especially those in the retail or manufacturing sectors, as it can significantly impact their cash flow and profitability.
Inventory Turnover Ratio: The inventory turnover ratio is a financial metric measuring how often a company’s inventory is sold and replaced over a specific period, typically a year. It is calculated by dividing the cost of goods sold (COGS) by the average inventory.
This ratio helps businesses understand how efficiently they manage their inventory, indicating whether they effectively sell their stock without overstocking or understocking.
A higher inventory turnover ratio implies that a company is selling its inventory quickly and is generally seen as positive, indicating strong sales or effective inventory management. Conversely, a low turnover ratio could suggest weak sales or excessive inventory levels.
Inventory Days: Inventory days, also known as days inventory outstanding (DIO), is a financial metric that measures the average number of days a company takes to sell its entire inventory over a specific period, typically a year.
It reflects how efficiently a company manages its inventory, indicating how quickly it can convert its inventory into sales. A lower number of inventory days suggests that a company is more efficient at selling its inventory, while a higher number suggests slower sales.
To calculate inventory days, you divide the ending inventory by the cost of goods sold (COGS) for the period, then multiply the result by the number of days in the period.
Work In Progress Inventory: Work-in-progress (WIP) inventory refers to the materials and items being manufactured but not yet completed products. It includes all the costs incurred during the manufacturing process, such as raw materials, labor, and overhead costs, up to that point in the production process.
WIP is considered an asset on a company’s balance sheet and is a critical part of the inventory for manufacturing and construction companies, as it provides insight into production efficiency, operational flow, and the potential value of unfinished goods. Proper management of WIP inventory is essential for accurate financial reporting and effective supply chain management.
Finished Goods Inventory: Finished Goods Inventory refers to the stock of completed products that are ready for sale but have not yet been sold. These products have undergone the entire production process, from raw materials to final goods, and are waiting to be distributed to retailers or consumers.
This type of inventory is a crucial component of a manufacturing company’s assets, reflecting both the value of the labor and materials invested in the products. Monitoring and managing finished goods inventory effectively is essential for meeting customer demand, optimizing sales, and maintaining efficient production cycles.
Tesla’s finished goods inventory includes products-in-transit to fulfill customer orders, new vehicles available for sale, used vehicles and energy products available for sale, according to the quarterly and annual reports.
How Does Tesla Manage Its Inventory?
Tesla, Inc. utilizes a distinctive approach to managing its inventory compared to traditional automotive manufacturers. This approach is integral to Tesla’s broader strategy of innovation, efficiency, and customer satisfaction. Here’s an overview of how Tesla manages its inventory:
1. **Direct Sales Model**: Tesla sells its vehicles directly to consumers, bypassing the conventional dealership model. This direct-to-consumer approach helps Tesla maintain tighter control over its inventory levels, reducing excess inventory and associated costs.
2. **Build-to-Order**: Tesla primarily operates on a build-to-order system where customers configure and order their vehicles online. This system allows Tesla to align production closely with demand, minimizing the need for large inventories of unsold vehicles.
3. **Vertical Integration**: Tesla’s high degree of vertical integration, including in-house manufacturing of key components like batteries and electric motors, provides it greater flexibility and control over its supply chain. This control helps Tesla to adjust production plans more swiftly and efficiently, further optimizing inventory levels.
4. **Real-Time Data and Analytics**: Tesla leverages advanced data analytics and real-time monitoring to forecast demand, track inventory levels, and optimize production schedules. This data-driven approach enables Tesla to respond rapidly to changes in market demand and reduce the risk of overproduction or stockouts.
5. **Global Inventory Distribution**: Tesla strategically positions its inventory across various global markets based on regional demand forecasts. This global distribution strategy helps minimize transit times and costs, ensure quicker customer delivery, and optimize regional inventory levels.
6. **Software Updates Over-the-Air (OTA)**: Tesla’s ability to enhance vehicle features and functionality through OTA software updates reduces the need for physical inventory to implement upgrades. This capability allows Tesla to maintain the relevance and value of its vehicles post-manufacture, unlike traditional automakers that might need to manage inventory of updated models or parts.
7. **Efficient Logistics and Delivery**: Tesla continues to invest in improving its logistics and delivery operations. The goal is to reduce delivery times from factory to customer, which enhances customer satisfaction and helps reduce inventory holding costs.
By integrating these strategies, Tesla is able to manage its inventory more effectively, aligning production with demand, reducing unnecessary costs, and ensuring a better match between its manufacturing output and customer orders. This approach is key to Tesla’s operational efficiency and market success.
What Is In Tesla’s Inventory?
Tesla Inventory Components ($ Millions)
| Fiscal Year (Dec 31) | ||||||
|---|---|---|---|---|---|---|
| 2024 Q1 | 2023 | 2022 | 2021 | 2020 | 2019 | |
| Raw Materials | $5,584 | $5,390 | $6,137 | $2,816 | $1,508 | $1,428 |
| Work In Progress | $2,507 | $2,016 | $2,385 | $1,089 | $493 | $362 |
| Service Parts | $1,195 | $1,171 | $842 | $575 | $434 | $406 |
| Finished Goods | $6,747 | $5,049 | $3,475 | $1,277 | $1,666 | $1,356 |
As shown in the table above, Tesla’s inventory consists of the following items:
- 1. Raw materials
- 2. Work in progress
- 4. Service parts
- 3. Finished goods
The finished goods is among the largest component, accounting for over 40% of the total inventory.
Tesla defines its finished goods inventory as vehicles in transit to fulfill customer orders, new vehicles available for sale, used vehicles, and energy products available for sale.
Tesla used to keep a much higher raw material inventory. However, in recent quarters, Tesla’s finished goods have grown much faster and surpassed the raw material inventory by a huge margin.
As of 1Q 2024, Tesla’s finished goods inventory reached nearly $8 billion, making it the largest inventory component, while raw material inventory dived to $5.6 billion. Tesla’s substantial number of finished products can be a double-edged sword, with potential benefits and drawbacks for the company.
The advantage of keeping a large amount of finished goods can ensures that products are always available to meet customer demand, especially during peak sales periods. This can lead to higher customer satisfaction and loyalty, while also protect a business against price increases from suppliers. It locks in costs, providing financial predictability.
The downside to having a bloated finished goods inventory is incurring costs related to storage, insurance, and maintenance. These expenses can reduce the overall profitability of the goods sold. In addition, money invested in inventory is capital that is not available for other potentially more profitable investments. It can affect the liquidity and the financial flexibility of the business.
Inventory Levels
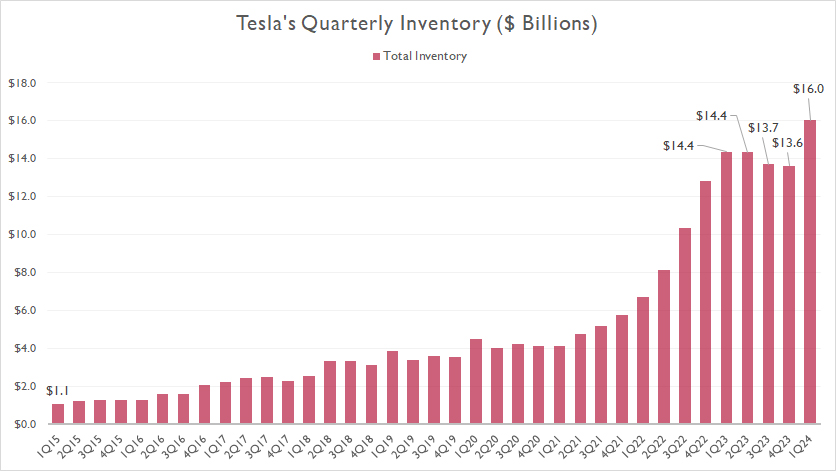
Tesla quarterly inventory
(click image to expand)
Tesla’s total inventory topped a record high of $16.0 billion as of 1Q 2024, up 12% over the same quarter a year ago. On average, Tesla’s total inventory has measured $14.4 billion per quarter between 1Q 2023 and 1Q 2024.
Since 2015, Tesla’s total inventory has multiplied by 16X. The automaker’s expanding inventory suggests a growing and prospering business prospect, driven primarily by the world’s increasing demand for clean energy products. In short, Tesla does not build out its inventory to such a massive scale for no reason.
However, some critics have argued that Tesla’s inventory has grown too fast and may have reached a critical level which may hurt the company. The soaring inventory may even suggest a slowing demand for the automaker’s automotive and energy products.
Therefore, is there a concern or even a problem for Tesla’s surging inventory? Read on.
Inventory YoY Growth Rates
Tesla inventory YoY growth rates
(click image to expand)
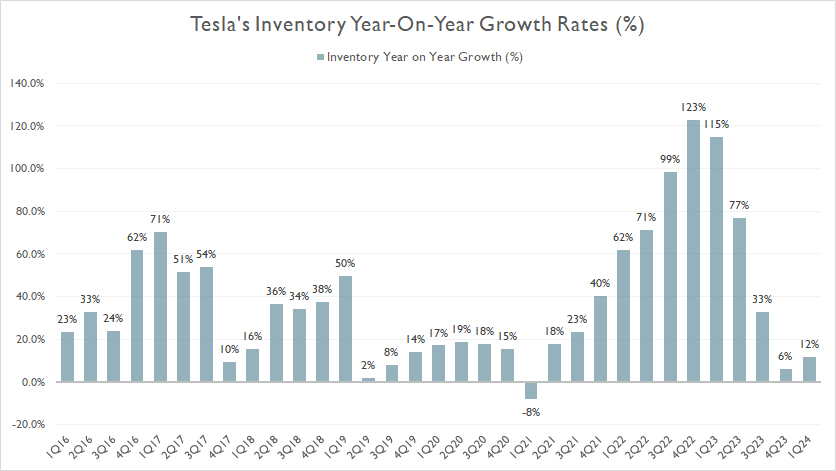
The graph above shows that the growth of Tesla’s inventory looks more like a roller-coaster ride. When the growth gets too robust, it slows down. On the other hand, when the growth gets too pessimistic, it rises again.
Since 2023, the growth of Tesla’s inventory has significantly slowed, as shown in the chart above. As of 1Q 2024, Tesla’s growth of total inventory measured just 12%. The growth rate has averaged 49% between 1Q 2023 and 1Q 2024, a much lower figure than the average 79% measured in 2022.
The slowing growth rates of the inventory suggests that the company may have been in a consolidating phase in the last several quarters, as it foresees rising competition and slowing demand.
Inventory By Components
Tesla inventory breakdown
(click image to expand)
The definitions of Tesla’s work-in-progress and finished goods inventory are available here: work in progress inventory and finished goods inventory.
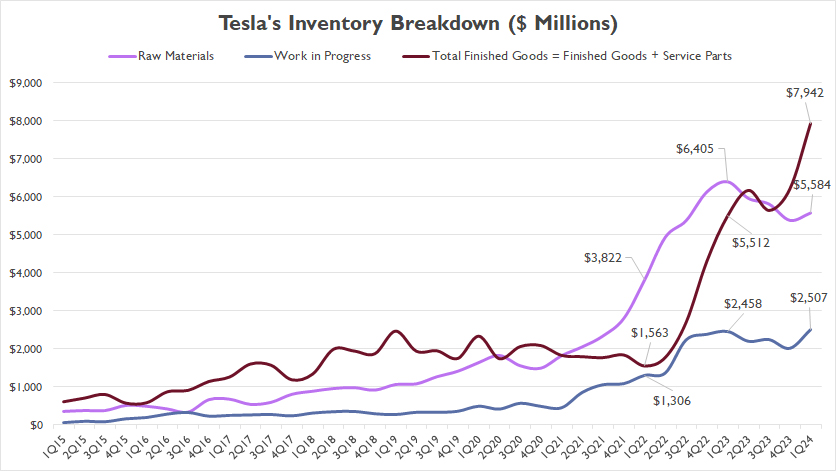
Of all the components, the total finished goods inventory has accounted for the largest portion in recent periods, reaching $7.9 billion as of 1Q 2024.
On the other hand, Tesla’s raw materials inventory has decreased, reaching $5.6 billion as of 1Q 2024, a much lower figure than the finished goods portion.
Tesla’s work-in-progress inventory also has increased, but not as much as raw materials and finished goods. It has remained nearly flat recently.
The surging finished goods inventory does seem like a concern as it has increased by over 40% in just one year. Meanwhile, raw materials have decreased by 12.5%.
The opposite trend of both inventory components does cause some concerns. In a healthy trend, the direction of both inventory components should align, meaning that they should rise and fall simultaneously, like how it had happened between 1Q 2022 and 1Q 2023.
Inventory By Components In Percentage
tesla-inventory-breakdown-in-percentage
(click image to expand)
The definitions of Tesla’s work-in-progress and finished goods inventory are available here: work in progress inventory and finished goods inventory.
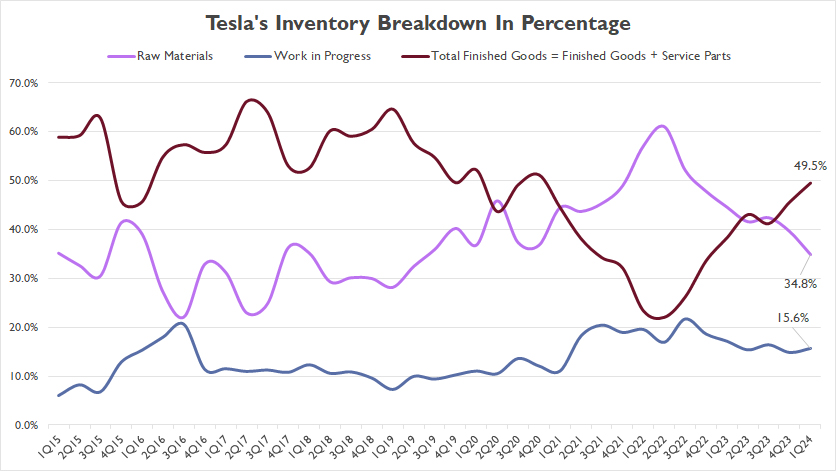
We should focus on the raw materials and finished goods inventory in this chart. The ratio of work-in-progress inventory has remained relatively constant.
As Tesla’s finished goods inventory has been on the rise, the percentage also has significantly risen, reaching 49.6% as of 1Q 2024. On the other hand, the percentage of raw materials has decreased, reaching 34.8% as of 1Q 2024. The plots of both components have rarely gone at the same direction and stayed flat. They usually go in the opposite direction.
Tesla’s work-in-progress inventory made up only 16% of total inventory as of 1Q 2024, the lowest among all components.
Although the absolute value of Tesla’s finished goods inventory has been surging recently, the percentage has appeared to remain at manageable levels. At some points in the past, Tesla’s finished goods inventory had got over 60% of the total inventory.
Before reaching a record figure, the percentage of the finished goods inventory has got so low. At one point, it almost tumbled to 20%. Noticing the low percentage of the finished goods inventory, Tesla may have been ramping to convert a significant portion of raw materials to finished goods, thereby leading to the surging finished goods inventory.
Therefore, Tesla’s inventory at this point looks normal and healthy from the perspective of the ratio to total inventory, even though the finished goods portion has significantly risen. It becomes abnormal if the percentage of the finished goods keeps on increasing and exceeds 60%.
Total Inventory To Current Assets Ratio
Tesla total inventory to current assets ratio
(click image to expand)
The definition of inventory to current assets ratio is available here: inventory to current assets ratio.
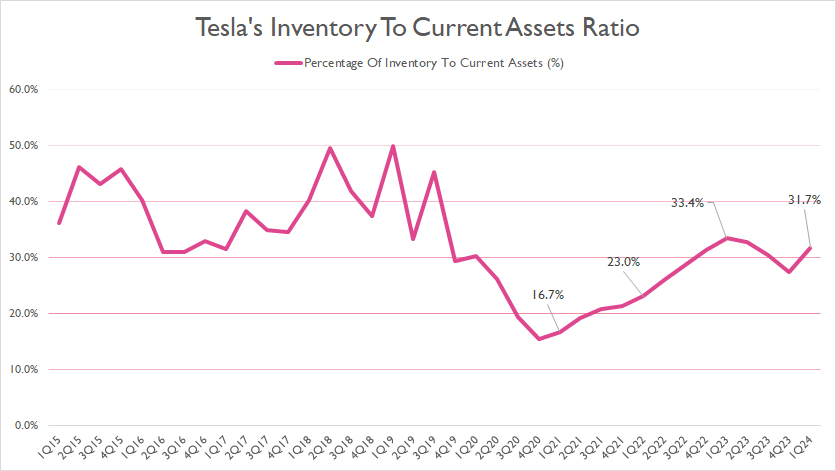
Tesla’s total inventory made up about 32% of its current assets as of fiscal 1Q 2024, slightly lower than the level a year ago. However, this ratio has significantly risen since 2021.
Compared to historical results, Tesla’s latest ratio was still manageable, indicating little concern with the rising inventory. It becomes unhealthy if it crosses the 40% threshold.
Total Inventory To Revenue Ratio
Tesla total inventory to revenue ratio
(click image to expand)
The definition of inventory to revenue ratio is available here: inventory to revenue ratio.
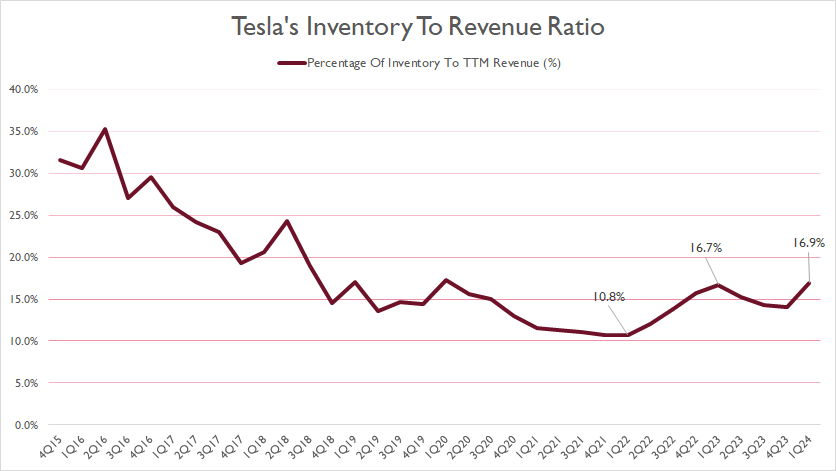
Tesla’s total inventory accounted for 17% of its total revenue as of fiscal 1Q 2024, roughly in line with the level recorded a year ago. However, this ratio has moderately risen from the 10.9% recorded in fiscal 1Q 2022.
Over the years, the proportion of inventory to revenue has progressively decreased, a positive indication of an improving business prospect. However, it has increased recently.
Although at a record high in recent quarters, the ratio was still at manageable level, suggesting little concern with the rising inventory. It becomes a concern if it crosses the 20% threshold and problematic if it cross the 30% threshold.
Inventory Turnover Ratio
Tesla inventory turnover ratio
(click image to expand)
The definition of inventory turnover ratio is available here: inventory turnover ratio.
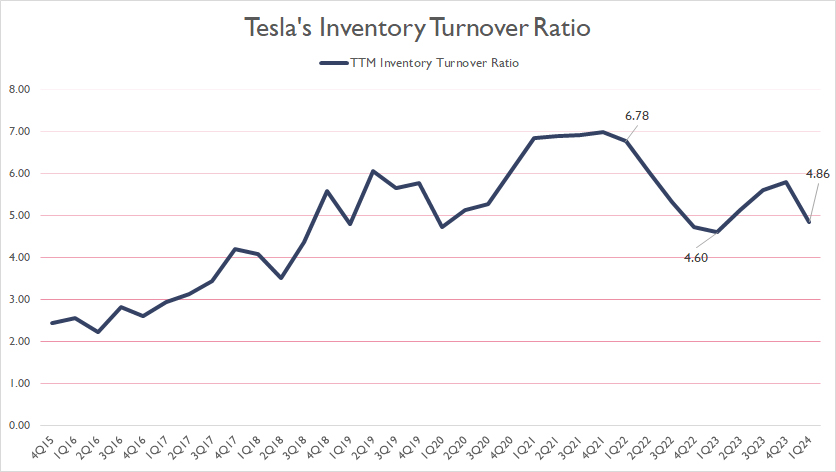
In 2022, Tesla experienced a decline in its product clearance rate, which resulted in a lower inventory turnover ratio. However, by 2023, the product clearance rate improved significantly, causing the inventory turnover ratio to bounce back.
As of 1Q 2024, Tesla’s inventory turnover ratio reached 4.86X, slightly higher than the result a year ago, but still tolerable. It becomes a concern if it surges beyond 6.00X.
Days Sales In Inventory
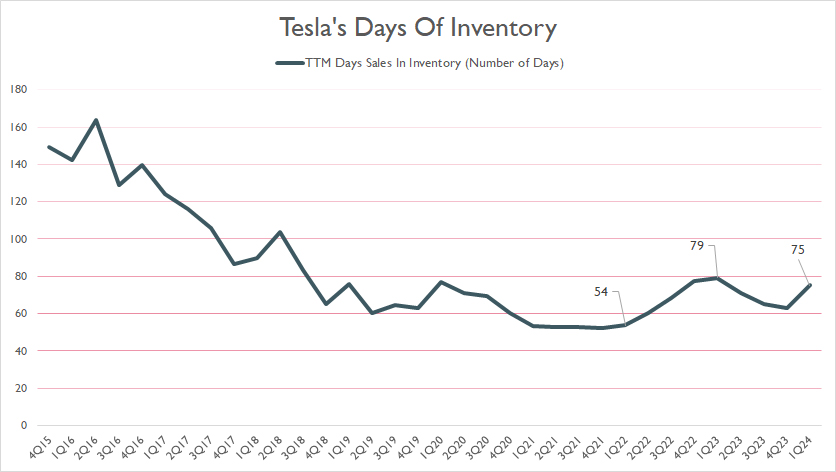
Tesla days of inventory
(click image to expand)
The definition of inventory days is available here: inventory days.
The days of inventory ratio is the number of days it takes for a company to sell its entire inventory. It is calculated by dividing the average inventory by the cost of goods sold and represents how efficiently a company manages its inventory.
As of 1Q 2024, Tesla’s inventory days were 75, roughly in line with the figure a year ago. Compared to the result in 1Q 2022, it was significantly up. In my opinion, it was still tolerable at this level.
Tesla’s inventory days ratio becomes a concern if it breaches the 100 days threshold. As of the latest result, Tesla’s inventory days ratio was acceptable although the total inventory was at a record figure.
Finished Products Inventory Days
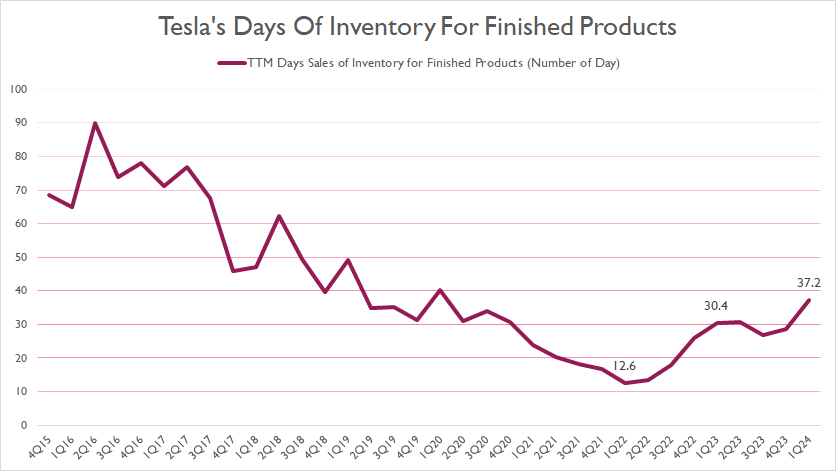
Tesla finished goods inventory days
(click image to expand)
The definition of inventory days is available here: inventory days.
If we focus only on Tesla’s finished goods inventory, the company clears them much faster, at only 37 days as of 1Q 2024, compared to 75 days for the total inventory, which we saw earlier.
Although Tesla’s inventory days ratio for finished goods has tripled since 2022, the figure is still manageable, as it is much lower than the historical highs. I will only start worrying if it breaches the 60 days threshold.
Conclusion
Tesla’s inventory management strategy is vital to its financial performance.
From the results of several ratios, they were acceptable and manageable compared to historical results despite the surging inventory levels, particularly in finished products.
Therefore, the increasing inventory is a positive sign of business growth and definitely not a sign of an inventory issue.
In short, Tesla’s efficient inventory management ensures that the company can meet the growing demand for its products in the market while maintaining its financial stability.
References and Credits
1. All financial figures presented in this article were obtained and referenced from Tesla’s quarterly and annual reports, earnings releases, SEC filings, investors letters, presentations, etc., which are available in Tesla Investor Relations.
2. Featured images in this article are used under a Creative Commons license and sourced from the following websites: 8000vueltas and e-connected.
Disclosure
References and examples such as tables, charts, and diagrams are constantly reviewed to avoid errors, but we cannot warrant the total correctness of all content.
The content in this article is for informational purposes only and is neither a recommendation nor a piece of financial advice to purchase a stock.
If you find the information in this article helpful, please consider sharing it on social media and provide a link to this article from any website so that more articles like this can be created.
Thank you!

An inventory checklist is always important to an interlining supplier. This checklist will help interlining suppliers understand how many raw materials they need to orders for the interlining products such as woven interlining, non-woven interlining and fusible interlining. However, the level of inventory to be ordered is not the same in each ordering period. You should pay attention to the market change in the interlining industry.