Microchips. Pexels Image.
This article presents the revenue by product of Taiwan Semiconductor Manufacturing Company Limited (TSMC).
TSMC’s revenue by product consists of revenue from the sale of semiconductor wafer and other products and services.
Let’s take a look! You may find related statistic of TSMC on these pages:
- TSMC revenue by country – U.S., China, Taiwan, Japan, etc.
- TSMC revenue by process node: 3nm, 5nm, 7nm, 10nm, and more, and
- TSMC profit margin.
Please use the table of contents to navigate this page.
Table Of Contents
Definitions And Overview
O2. What is driving the significant growth in TSMC’s wafer revenue?
Revenue By Product
A1. Revenue From Sales Of Wafer And Others
A2. Percentage Of Revenue From Sales Of Wafer And Others
Revenue Growth By Product
B1. YoY Growth Rates Of Revenue From Sales Of Wafer And Others
Conclusion And Reference
S1. Conclusion
S2. References and Credits
S3. Disclosure
Definitions
To help readers understand the content better, the following terms and glossaries have been provided.
New Taiwan Dollar (TWD): The New Taiwan Dollar (TWD), abbreviated as NT$, is the official currency of Taiwan.
It is used in all forms of transactions within the country, from daily expenses to business dealings. The New Taiwan Dollar is issued by the Central Bank of the Republic of China (Taiwan) and is subdivided into 100 cents.
Its symbol is NT$, and it is known for its stability and wide acceptance in the region. The exchange rate of TWD to USD is NT$1,000 to US$30.30.
Wafer Revenue: TSMC’s wafer revenue refers to the income generated by Taiwan Semiconductor Manufacturing Company (TSMC) from the production and sale of semiconductor wafers.
These wafers are the foundational materials used to fabricate integrated circuits (ICs) and computer chips. TSMC manufactures these wafers using advanced semiconductor processes and sells them to various electronics manufacturers and fabless companies, which design the chips but outsource the manufacturing process.
TSMC’s wafer revenue is a significant component of the company’s overall revenue, driven by the demand for high-performance computing (HPC) products, smartphones, automotive applications, Internet of Things (IoT) devices, and other digital consumer electronics.
The company’s ability to offer cutting-edge process technologies, such as 5nm, 4nm, and 3nm nodes, ensures that its wafers meet the evolving needs of its customers, contributing to sustained revenue growth.
Other Porducts And Services: Besides wafer revenue, TSMC offers a variety of products and services that cater to different segments of the semiconductor industry. Here are some key offerings:
- Advanced Packaging Services: TSMC provides a range of backend services, including advanced packaging technologies that enhance the performance and functionality of semiconductor devices.
- CyberShuttle® Prototyping Service: This service significantly reduces non-recurring engineering (NRE) costs by covering a wide technology range, making it easier for customers to prototype their designs.
- Mask Services: As the world’s largest mask-making operation, TSMC offers mask services that are essential for the lithography process in semiconductor manufacturing.
- eFoundry®: TSMC’s suite of web-based applications gives designers a more active role in the design process, providing tools and resources to streamline their work.
TSMC’s diverse portfolio and comprehensive technology platforms allow it to serve a wide range of industries and applications, making it a key player in the global semiconductor market.
What is driving the significant growth in TSMC’s wafer revenue?
Several factors are driving the significant growth in TSMC’s wafer revenue:
- Advanced Process Technologies: TSMC’s adoption of advanced process technologies, such as the 5nm, 4nm, and 3nm nodes, has been a major growth driver. These advanced processes are used in high-performance computing (HPC) products, flagship smartphones, and AI chips, which are in high demand.
- AI Deployment: The increasing deployment of AI technologies, both in data centers and edge devices, has led to higher wafer consumption per unit. AI chips require advanced manufacturing processes, which TSMC is well-equipped to provide.
- Supply Chain Recovery: The recovery of supply chains, particularly in the automotive and industrial sectors, has contributed to increased demand for semiconductor wafers. As these industries restock and ramp up production, TSMC benefits from the higher demand.
- Cloud AI Infrastructure: The expansion of cloud AI infrastructure has driven the need for more powerful and efficient chips, which TSMC produces. This trend is expected to continue, further boosting wafer revenue.
- Geopolitical Factors: TSMC’s strategic investments in new fabrication plants, such as the one in Phoenix, Arizona, supported by the U.S. Chips Act, help mitigate geopolitical risks and bring production closer to key customers in North America. This proximity to major markets enhances TSMC’s competitive edge.
- Diverse Customer Base: TSMC’s extensive customer base, including major players in the tech industry, ensures a steady stream of orders for its semiconductor wafers. The company’s reputation for quality and reliability makes it a preferred supplier.
- Market Leadership: TSMC’s position as a leader in the semiconductor industry, with a significant market share, allows it to capitalize on industry-wide growth trends. The company’s strong technological edge and customer base contribute to its revenue growth.
These factors collectively contribute to TSMC’s robust wafer revenue growth, positioning the company as a key player in the global semiconductor market.
Revenue From Sales Of Wafer And Others
tsmc-revenue-by-product
(click image to expand)
The definition of TSMC’s revenue by product segment is available here: wafer revenue and Others.
TSMC reports its financial statements primarily in New Taiwan Dollars (TWD). You can find more information about the currency exchange rates between TWD and the US dollar here: New Taiwan Dollar (TWD).
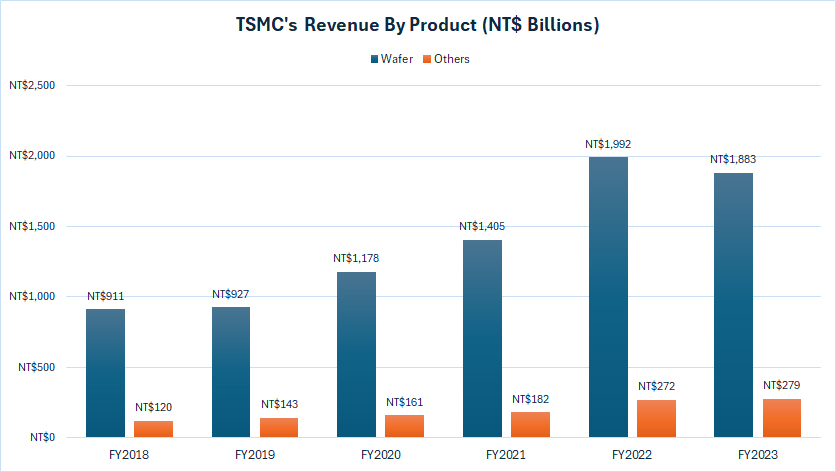
TSMC generates the majority of its revenue from the sale of silicon wafers, as illustrated in the accompanying chart. In fiscal year 2023, TSMC’s wafer revenue reached NT$1,883 billion (US$57.4 billion), marking a 5% decline from NT$1,992 billion (US$60.8 billion) recorded in fiscal year 2022.
Despite this recent dip, TSMC’s wafer revenue has seen remarkable growth over the past six years. It has surged from NT$911 billion (US$27.8 billion) in fiscal year 2018 to NT$1,883 billion (US$57.4 billion) in fiscal year 2023, representing an increase of over 100%.
This impressive growth trajectory highlights TSMC’s continued leadership and innovation in semiconductor manufacturing.
On the other hand, TSMC’s revenue from other products and services amounted to NT$279 billion in fiscal year 2023, remaining relatively stable compared to fiscal year 2022.
However, like wafer revenue, TSMC’s income from other products and services has also grown significantly since fiscal year 2018. Over the past six years, this revenue stream has more than doubled, achieving an all-time high by fiscal year 2024.
Key factors driving the remarkable growth in TSMC’s revenue from wafer sales and other products and services include the company’s advanced manufacturing technologies, increased demand in emerging markets, strategic investments, and a diverse product portfolio.
As TSMC continues to innovate and expand its market presence, the company’s revenue from both wafer sales and other products/services is expected to grow.
The sustained increase in digital adoption, advancements in semiconductor technologies, and strategic investments will be key drivers of this growth.
TSMC’s ability to adapt to market trends and meet the evolving needs of its customers positions it well for continued success in the semiconductor industry.
Percentage Of Revenue From Sales Of Wafer And Others
tsmc-revenue-by-product-in-percentage
(click image to expand)
The definition of TSMC’s revenue by product segment is available here: wafer revenue and Others.
TSMC reports its financial statements primarily in New Taiwan Dollars (TWD). You can find more information about the currency exchange rates between TWD and the US dollar here: New Taiwan Dollar (TWD).
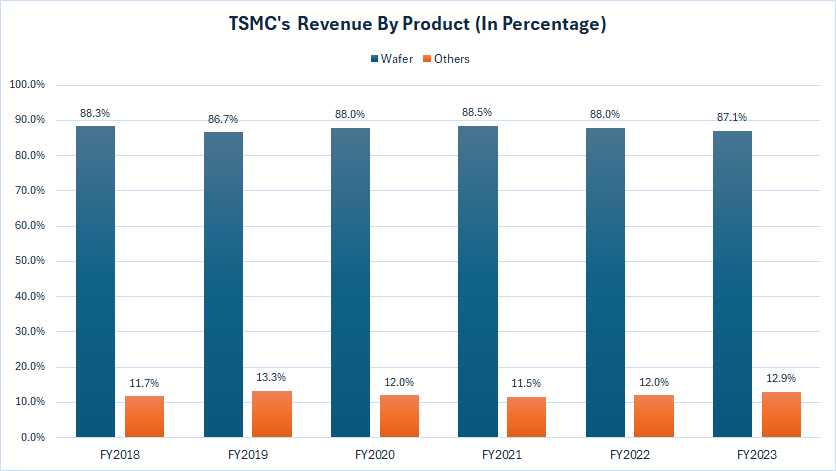
TSMC’s revenue from wafer sales has consistently been the predominant source of its total revenue, as illustrated in the chart above.
In fiscal year 2023, wafer revenue accounted for a significant 87% of TSMC’s total revenue. On average, wafer sales have represented 88% of TSMC’s total revenue over the past three years.
The steady contribution of wafer sales to TSMC’s overall revenue underscores the company’s dominant position in the semiconductor manufacturing industry.
This stability reflects TSMC’s ability to maintain high demand for its advanced semiconductor wafers, which are essential components for various high-tech applications, including smartphones, high-performance computing, AI, and automotive technologies.
On the other hand, TSMC’s revenue from other products and services, which includes advanced packaging, mask services, and other miscellaneous offerings, has consistently made up a smaller yet significant portion of the company’s overall revenue.
In fiscal year 2023, this segment contributed 13% of TSMC’s total revenue, up from 12% in fiscal year 2022. This growth trend reflects TSMC’s successful diversification strategy and its ability to expand its service offerings beyond wafer sales.
Over the past several years, TSMC has invested in enhancing its advanced packaging technologies and other high-value services, enabling the company to capture additional revenue streams.
These services not only provide additional revenue but also strengthen customer relationships by offering comprehensive solutions that complement wafer sales.
For instance, advanced packaging technologies are essential for improving the performance and efficiency of semiconductor devices, making TSMC a valuable partner for customers looking to optimize their products.
YoY Growth Rates Of Revenue From Sales Of Wafer And Others
tsmc-revenue-by-product-yoy-growth-rates
(click image to expand)
The definition of TSMC’s revenue by product segment is available here: wafer revenue and Others.
TSMC reports its financial statements primarily in New Taiwan Dollars (TWD). You can find more information about the currency exchange rates between TWD and the US dollar here: New Taiwan Dollar (TWD).
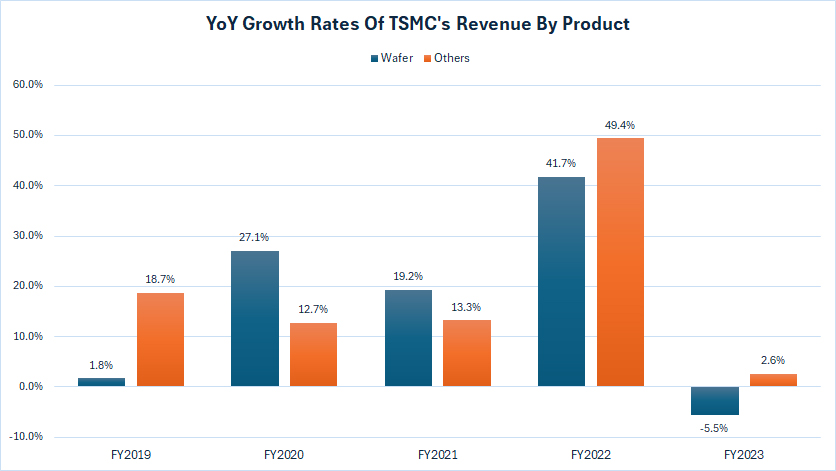
TSMC has experienced slightly higher growth rates in its revenue from other products and services compared to its wafer sales. Over the past three years, from fiscal year 2021 to 2023, the revenue growth for TSMC’s other products and services has averaged 22%.
This growth underscores the company’s successful diversification strategy and its ability to expand its service offerings beyond wafer sales.
In contrast, the revenue growth from wafer sales has averaged 18.5% over the same period. However, it’s important to note that in fiscal year 2023, TSMC’s wafer sales revenue experienced a decline of 5.5%, marking the first decrease since fiscal year 2019.
This dip indicates a temporary setback, which could be attributed to various market conditions, supply chain disruptions, or changes in demand dynamics.
Looking ahead, TSMC’s focus on innovation and expansion is expected to drive continued growth. The company’s ongoing investments in research and development, as well as its commitment to advancing technology, will likely result in further increases in revenue from both segments.
In summary, while TSMC’s wafer sales remain a critical component of its overall revenue, the company’s strategic focus on diversifying its offerings and expanding its service portfolio has resulted in higher growth rates for revenue from other products and services.
Conclusion
In summary, TSMC’s strong revenue performance from both wafer sales and other products and services underscores its market leadership, innovative capabilities, and successful diversification strategy. These factors collectively position TSMC for sustained growth and success in the semiconductor industry.
Credits and References
1. All financial figures presented were obtained and referenced from TSMC’s annual reports published on the company’s investor relations page: TSMC Annual Reports.
2. Pexels Images.
Disclosure
We may utilize the assistance of artificial intelligence (AI) tools to produce some of the text in this article. However, the data is directly obtained from original sources and meticulously cross-checked by our editors multiple times to ensure its accuracy and reliability.
If you find the information in this article helpful, please consider sharing it on social media. Additionally, providing a link back to this article from any website can help us create more content like this in the future.
Thank you for your support and engagement! Your involvement helps us continue to provide high-quality, reliable content.


