Tesla battery. Source: Flickr Image.
Tesla, the innovative electric vehicle manufacturer, is a company that is also making strides in the energy sector. Tesla’s energy segment focuses on developing and selling energy storage systems and solar products designed to enhance the use of renewable energy sources.
The company’s mission is to accelerate the world’s transition to sustainable energy, and its energy segment is a key part of achieving this goal. Tesla offers a range of energy products, including the Powerwall, Powerpack, and Megapack, designed to store energy from solar panels or the grid and provide power when needed.
The company also offers solar panels and roofs, allowing homeowners to generate their own clean energy. With Tesla’s energy products, customers can reduce their reliance on fossil fuels, save money on energy costs, and contribute to a more sustainable future.
In addition, Tesla’s supercharger stations may one day be entirely powered by its own solar energy generation and storage systems, thereby significantly reducing its carbon footprint.
That said, this article presents several statistics of Tesla’s energy segment, which include the energy segment revenue, gross margin, growth rates, and solar and storage deployment.
Let’s take a look!
Please use the table of contents to navigate this page.
Table Of Contents
Definitions And Overview
- Energy Storage Deployment
- Solar Deployment
- Power Purchase Agreement
- Megawatt (MW)
- Megawatt Hour (MWh)
A2. Tesla Energy Business Strategy
A3. How Does Tesla Energy Make Money
Energy Revenue
B1. Energy Revenue By Year
B2. Energy Revenue By Quarter
B3. Energy Revenue By TTM
Energy Revenue Growth Rates
B4. Energy Revenue YoY Growth Rates
Energy Profitability
C1. Energy Gross Margin By Year
C2. Energy Gross Margin By Quarter
C3. Energy Gross Margin By TTM
Solar Deployment
E1. Solar Deployment By Year
E2. Solar Deployment By Quarter
E3. Solar Deployment By TTM
Energy Storage Deployment
F1. Energy Storage Deployment By Year
F2. Energy Storage Deployment By Quarter
F3. Energy Storage Deployment By TTM
Ratio And Comparison
G1. Energy To Total Revenue Ratio
G2. Energy Vs Automotive Revenue
Conclusion And Reference
S1. Conclusion
S2. References and Credits
S3. Disclosure
Definitions
To help readers understand the content better, the following terms and glossaries have been provided.
Enery Storage Deployment: Energy storage deployment refers to the process of installing and utilizing energy storage systems to store excess energy generated from renewable sources, such as solar or wind power, for later use.
These storage systems can provide power during peak demand when energy costs are higher or during power outages. Energy storage deployment is an important aspect of transitioning to a more sustainable and reliable energy system, as it allows for better integration of renewable energy sources and reduces reliance on fossil fuels.
Solar Deployment: Solar deployment refers to installing and utilizing solar energy systems, such as solar panels, to generate electricity from sunlight.
This involves the installation of solar panels on rooftops, fields, or other suitable surfaces to capture sunlight and convert it into usable energy. Solar deployment is an important aspect of transitioning to a more sustainable and renewable energy system, as it allows for the generation of clean energy while reducing reliance on fossil fuels.
Power Purchase Agreement: A power purchase agreement (PPA) is a legal contract between an electricity generator and a buyer, typically a utility or a corporation.
In this agreement, the generator agrees to sell a certain amount of electricity at a pre-determined price over a specified period. PPAs are commonly used in the renewable energy industry to facilitate the financing and development of new renewable energy projects.
Megawatt (MW): A megawatt (MW) is a power unit equal to one million watts. It is commonly used to measure large power plants’ output power or industrial facilities’ power consumption.
One megawatt equals 1,000 kilowatts (kW) or 1,000,000 watts (W). The capacity for 1 megawatt (MW) of power depends on the type of power generation technology used. For example, a 1 MW wind turbine can generate enough electricity to power around 300 homes, while a 1 MW natural gas turbine can power around 1,000 homes.
Megawatt Hour (MWh): A megawatt-hour (MWh) is a unit of energy equivalent to one million watt-hours. It is commonly used to measure the amount of energy consumed or produced over a certain period by large power plants or industrial facilities.
For example, if a power plant generates 1 megawatt of power for one hour, it would produce 1 MWh of energy. The capacity of 1 megawatt-hour (MWh) of energy does not directly correspond to the number of homes it can power, as the amount of energy a home consumes can vary widely depending on factors such as the size of the home, the number of occupants, and the appliances and devices used.
However, as a rough estimate, one MWh of energy could potentially power around 400 to 900 homes for an hour, depending on the average energy consumption of those homes. It’s important to note that this is just an estimate, and the actual number of homes that 1 MWh of energy can power can vary widely depending on many factors.
Tesla Energy Business Strategy
Tesla’s energy business strategy encompasses several key components aimed at reinventing and leading the global shift towards sustainable energy. The strategy can be dissected into the following critical aspects:
1. **Integration of Energy Solutions**: Tesla is not just an electric vehicle (EV) manufacturer; it’s also focused on creating a fully integrated clean energy ecosystem. This includes solar energy products, like solar panels and solar roofs, as well as energy storage solutions, such as the Powerwall, Powerpack, and Megapack. By offering a comprehensive range of products, Tesla aims to enable homes, businesses, and utilities to generate, store, and manage renewable energy efficiently.
2. **Innovation in Energy Storage**: A cornerstone of Tesla’s energy strategy is its emphasis on advanced battery technology. The company continuously innovates in this area, aiming to reduce energy storage costs and increase its batteries’ efficiency and reliability. This is crucial for the viability of renewable energy, as it addresses the issue of intermittency by storing excess energy generated during peak conditions for use when generation is low.
3. **Scaling Production**: Tesla’s Gigafactories are central to its strategy, enabling the mass production of batteries and electric vehicles. By scaling up production, Tesla aims to drive down costs through economies of scale, making sustainable energy products more affordable and accessible to a broader market.
4. **Synergy Between Electric Vehicles and Energy Products**: Tesla’s energy strategy is closely tied to its electric vehicle business. The company envisions a future where homes and businesses generate their own clean energy, store it, and use it to power their everyday needs and their Tesla vehicles. This holistic approach encourages the adoption of both EVs and renewable energy products.
5. **Deployment of Software and Services**: Beyond hardware, Tesla is leveraging software to enhance the value of its energy products. This includes smart management systems that optimize energy use and storage based on real-time data and user preferences. Additionally, Tesla aims to create a virtual power plant by linking distributed energy resources to provide grid services, further stabilizing the grid and reducing the need for fossil fuel-based peak power plants.
6. **Market Expansion and Policy Advocacy**: Tesla is actively working to expand into new markets around the world while also engaging in policy advocacy to support the transition to renewable energy. The company recognizes the importance of favorable regulations and incentives in accelerating the adoption of sustainable energy solutions.
In summary, Tesla’s energy business strategy is multifaceted, aiming to lead in the transition to sustainable transportation and fundamentally change how energy is generated, stored, and consumed. Tesla seeks to drive the world toward a cleaner, more sustainable energy future through innovation, integration, and advocacy.
How Does Tesla Energy Make Money
Tesla energy
(click image to expand)
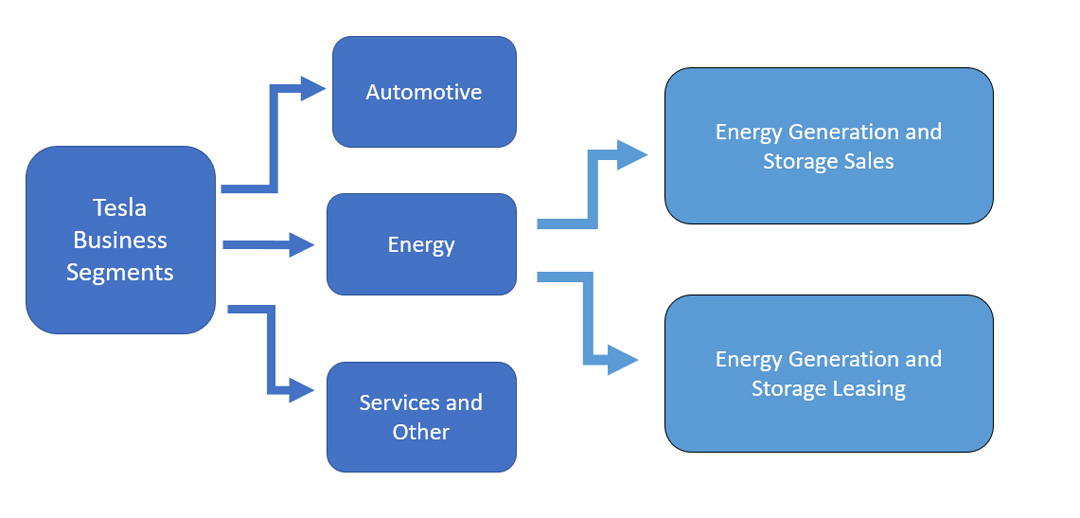
Tesla’s energy gets its revenue primarily from two sources:
- 1. Energy generation and storage sales
- 2. Energy generation and storage leasing
Tesla’s energy generation and storage sales revenue is derived from sales of solar energy systems and energy storage products to residential, small commercial, and large commercial and utility grade customers.
On the other hand, Tesla’s energy generation and storage leasing revenue is derived from leasing solar energy systems and electricity to commercial and retail customers.
In the case of leasing, Tesla is the lessor who owns the assets, while its customers are the lessees.
Apart from leasing the entire solar energy generation systems, Tesla also leases electricity to retail and commercial customers under a power purchase agreement (PPA).
Tesla earns recurring income from customers leasing electricity under a power purchase arrangement.
Energy Revenue By Year
tesla-energy-revenue-by-year
(click image to expand)
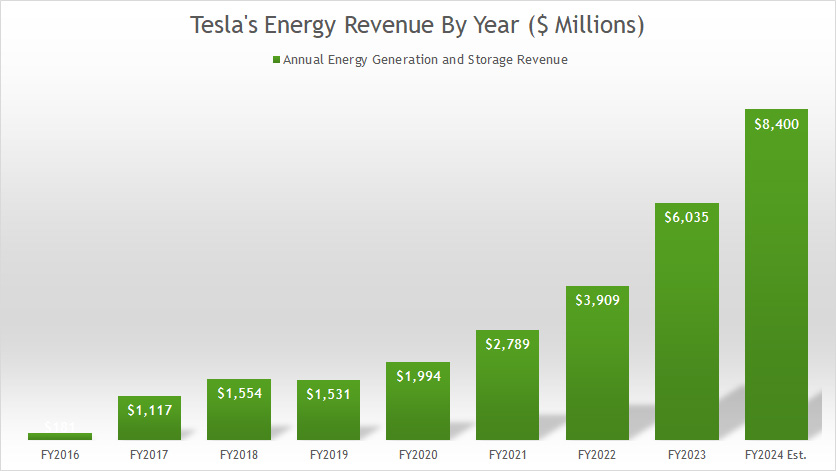
Tesla earned US$6.0 billion, US$3.9 billion, and US$2.8 billion in energy revenue for the year ended on 31 Dec 2023, 2022, and 2021, respectively.
If a similar growth rate continues into 2024, Tesla will earn US$8.4 billion in energy revenue in fiscal 2024.
Energy Revenue By Quarter
tesla-energy-revenue-by-quarter
(click image to expand)
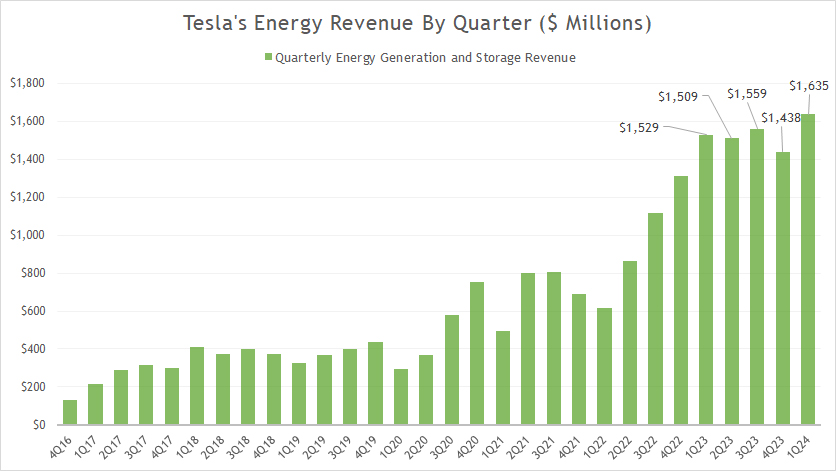
Tesla earned $1.6 billion in quarterly energy revenue in fiscal Q1 2024, about 7% higher from last year. On average, Tesla has generated $1.5 billion in quarterly energy revenue between 1Q 2023 and 1Q 2024.
Energy Revenue By TTM
tesla-energy-revenue-by-ttm
(click image to expand)
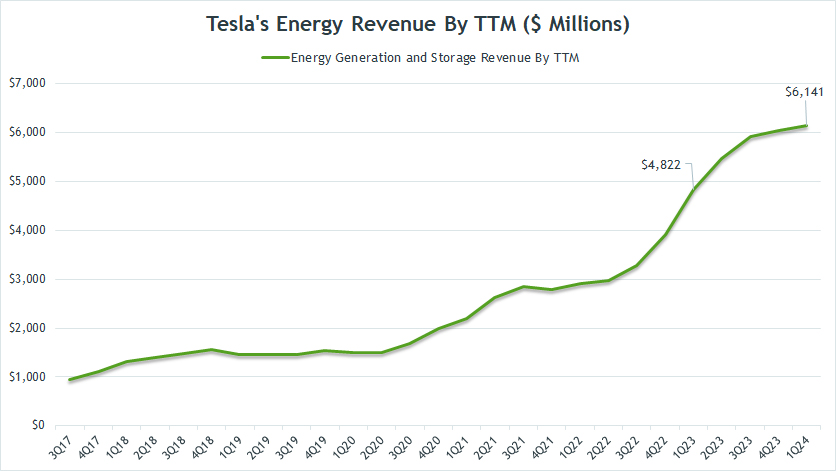
The TTM or trailing 12-month plot above smoothes out the quarterly curve and better reflects the trend of Tesla’s energy revenue.
That said, Tesla’s TTM energy revenue has continued to ramp, reaching a record high of $6.1 billion as of 1Q 2024, up 27% from a year ago.
Energy Revenue YoY Growth Rates
tesla-energy-revenue-yoy-growth-rates
(click image to expand)
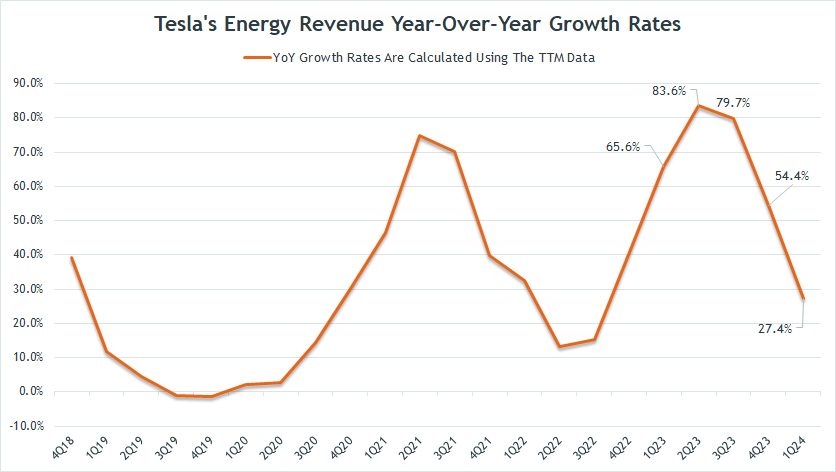
The year-over-year growth of Tesla’s TTM energy revenue has averaged 62% each quarter since 1Q 2023. As of Q1 2024, Tesla’s TTM energy revenue grew 27% year-over-yaer versus 66% a year ago.
Overall, Tesla has reported significant energy revenue growth that has exceeded 60% on average over the last several quarters.
Energy Gross Margin By Year
tesla-energy-gross-margin-by-year
(click image to expand)
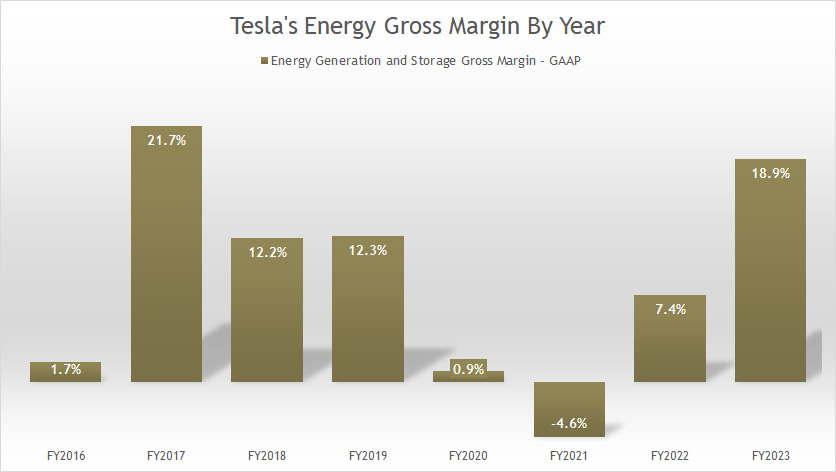
Tesla’s energy does not seem to have a high gross margin, indicating the low profitability of the energy segment. However, Tesla’s energy gross margin has significantly recovered since fiscal 2021, reaching a record figure of 18.9% as of 2023.
Before making a profit, Tesla’s energy mostly had negative gross margins, illustrating the unprofitable nature of the company’s energy business.
Tesla’s low gross margin in the energy segment is due to the high costs of production/installation.
One notable example is the solar roof, for which Tesla needs to painstakingly train its staff for installation to prevent years of leaks as well as damages down the road.
In contrast, Tesla’s automotive segments, such as car sales and leasing sales, generate a much higher gross margin of between 20% and 40%.
Energy Gross Margin By Quarter
tesla-energy-gross-margin-by-quarter
(click image to expand)
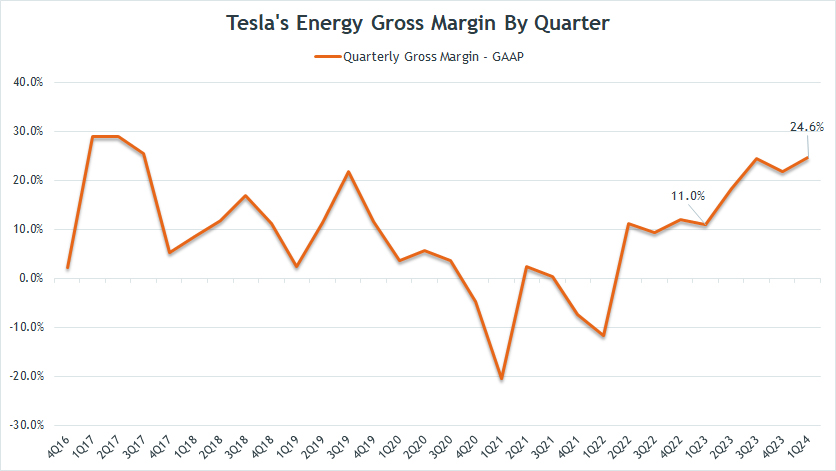
Tesla’s energy gross margin appears to have significantly recovered in the last several quarters. As of 1Q 2024, Tesla managed to record a gross margin of 24.6% in the energy segment, up considerably from 11.0% a year ago.
Energy Gross Margin By TTM
tesla-energy-gross-margin-by-ttm
(click image to expand)
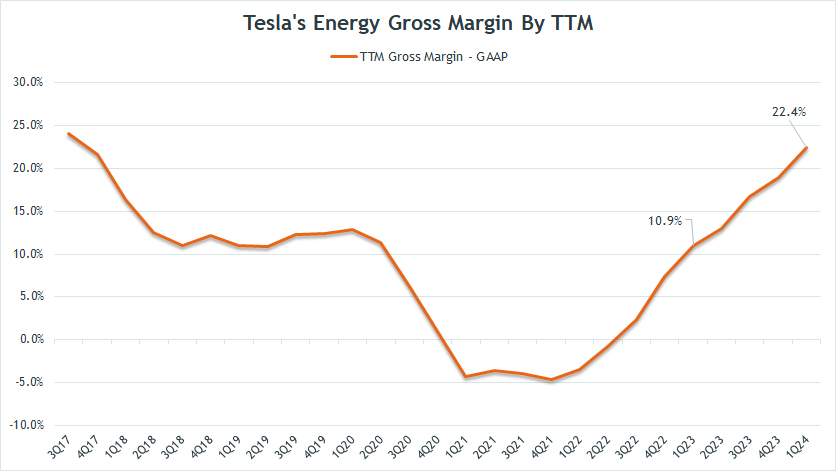
The TTM plot above clearly depicts the recovery of Tesla’s energy gross margin in recent quarters.
As of 1Q 2024, Tesla’s TTM energy gross margin topped 22.4%, a record high since fiscal 2021. The latest figure represents a massive turnaround from a year ago and is more than double the 10.9% from a year ago.
In short, Tesla’s years of investment in the energy sector are paying off now as the profitability in the energy business has been on the rise.
Solar Deployment By Year
tesla-solar-deployment-by-year
(click image to expand)
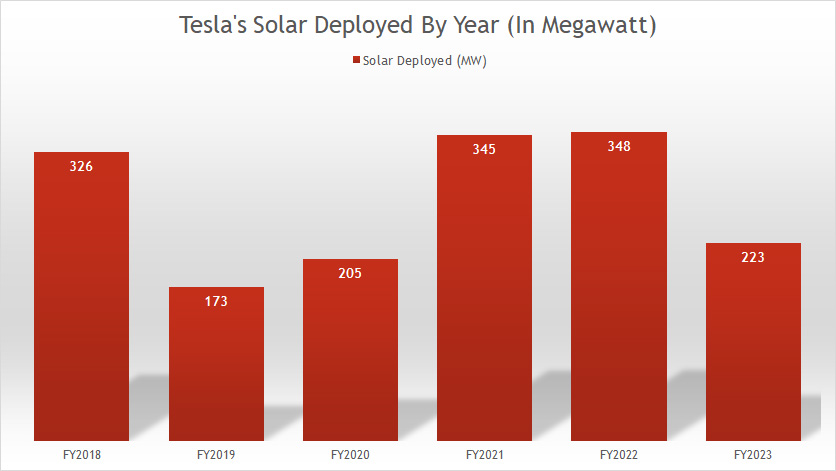
A definition of solar deployment can be found here: solar deployment. Tesla’s solar deployment of 223MW in fiscal 2023 was down significantly from a year ago.
Tesla highlighted that the decrease in solar deployment is primarily due to the high-interest rate environment that has caused an industry-wide postponement of solar purchases.
Solar Deployment By Quarter
tesla-solar-deployment-by-quarter
(click image to expand)
A definition of solar deployment can be found here: solar deployment.
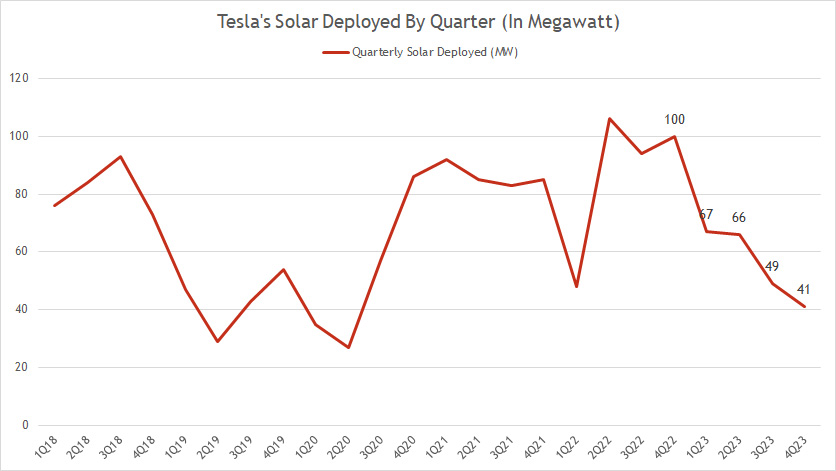
Tesla’s quarterly solar deployment is spiraling downward. As of 4Q 2023, Tesla deployed only 41MW of solar energy, a record low since 2022 and down more than 50% from a year ago.
Solar Deployment By TTM
tesla-solar-deployment-by-ttm
(click image to expand)
A definition of solar deployment can be found here: solar deployment.
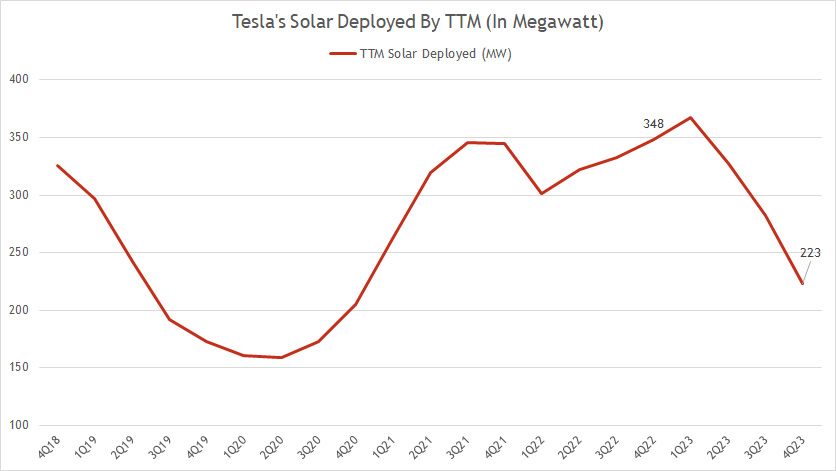
The TTM plot above shows that Tesla’s solar deployment is spiraling downward post-2023.
As of fiscal 4Q 2023, Tesla’s TTM solar deployment totaled 223MW, down 36% over a year ago.
Energy Storage Deployment By Year
tesla-energy-storage-deployment-by-year
(click image to expand)
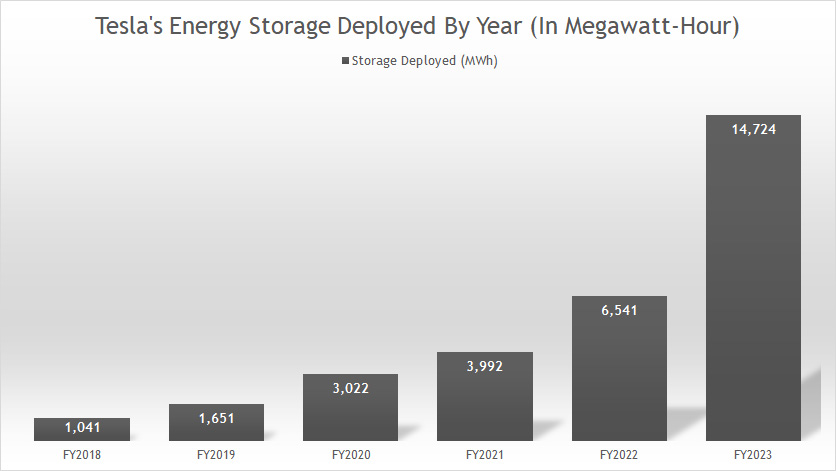
A definition of energy storage deployment can be found here: energy storage deployment. Unlike the solar deployment, Tesla’s energy storage deployment has never slipped a bit, even during the height of the COVID-19 crisis in fiscal 2020.
Since fiscal 2018, Tesla’s storage deployment has grown by more than 500% and reached a record high of 14.7GWh as of fiscal 2023, an increase of 126% year on year.
Tesla’s record energy storage deployment is a result of the ongoing ramp of the Megapack factory (Megafactory) in Lathrop, CA.
It looks like Tesla is hitting the right spot in the energy storage business.
Energy Storage Deployment By Quarter
tesla-energy-storage-deployment-by-quarter
(click image to expand)
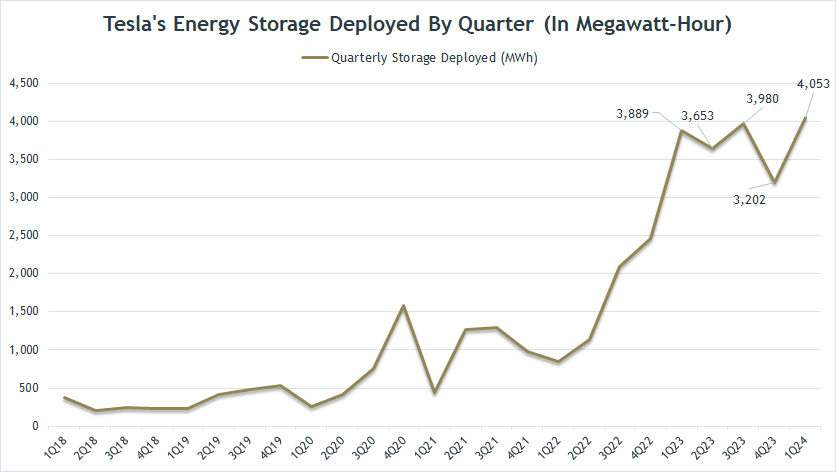
A definition of energy storage deployment can be found here: energy storage deployment. Tesla’s quarterly energy storage deployment grew 5% in fiscal 1Q 2024 from a year ago, reaching a record figure of 4.1GWh.
As shown in the plot above, Tesla’s energy storage deployment has significantly soared since fiscal year 2022, and the uptrend seems to continue towards fiscal year 2024.
Energy Storage Deployment By TTM
tesla-energy-storage-deployment-by-ttm
(click image to expand)
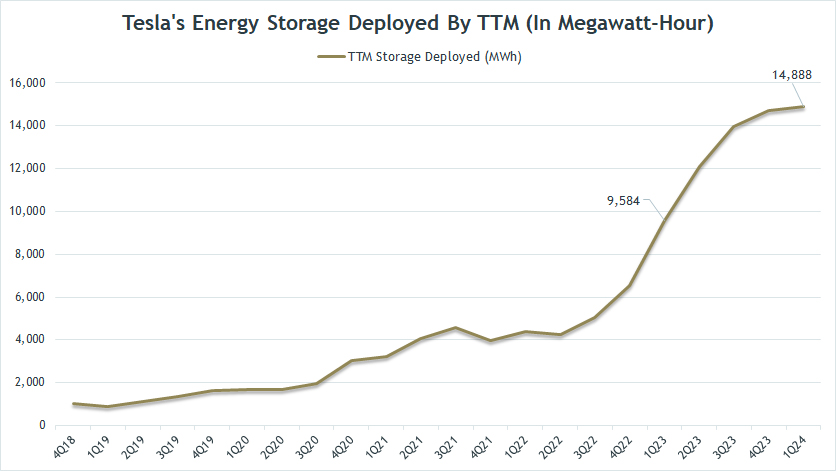
A definition of energy storage deployment can be found here: energy storage deployment. The TTM plot depicts the significant rise in Tesla’s energy storage deployment since fiscal 2022.
On a TTM basis, Tesla’s energy storage deployment reached a recod figure of 14.9GWh as of 1Q 2024, an all-time high.
Energy To Total Revenue Ratio
tesla-energy-revenue-to-total-revenue-ratio
(click image to expand)
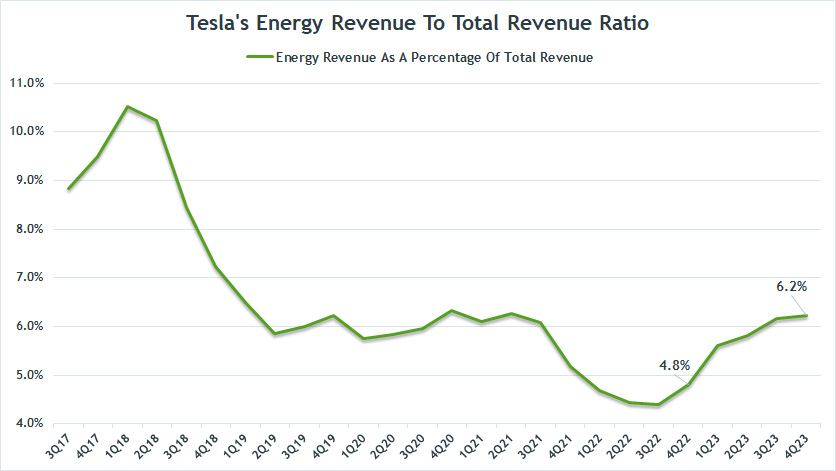
As shown in the chart above, Tesla’s solar business used to contribute more than 10% of sales to total revenue.
Since fiscal 2018, this ratio has dropped drastically. In recent quarters, the energy to total revenue ratio has steadily risen and exceeded 6% as of 4Q 2023.
The rising energy ratio to total revenue illustrates the growing significance of Tesla’s energy and the improving business prospects in the energy business segment.
Energy Vs Automotive Revenue
tesla-energy-vs-automotive-revenue
(click image to expand)
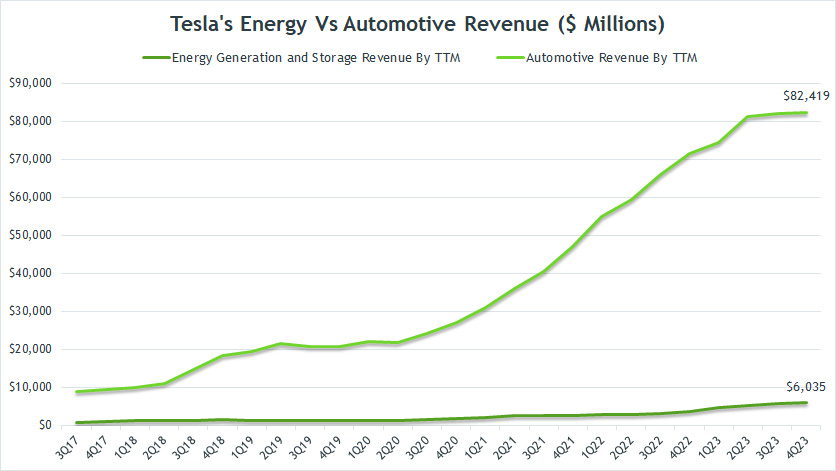
To get an idea of how much Tesla’s energy business has progressed with respect to automotive revenue, the chart above shows the revenue comparison between the energy and automotive segments on a TTM basis.
That said, the chart above depicts a huge contrast between Tesla’s energy and automotive revenue, and the gap is growing.
As of fiscal 4Q 2023, the gap between Tesla’s automotive and energy segments has reached 14X, some of the most significant differences ever measured.
In the latest quarter, Tesla’s automotive revenue totaled $82.4 billion versus $6.0 billion in energy revenue.
The gap between Tesla’s automotive and energy sales was much smaller in earlier years compared to recent results, illustrating the much faster growth of the automotive segment over the solar business.
However, Tesla’s energy may soon close the gap, considering that its growth is starting to gain traction.
Elon Musk believes the energy business may ultimately be as huge as, if not bigger than, the automotive business someday when the adoption of renewable energy accelerates.
Therefore, will we see explosive growth in the energy segment, similar to the automotive sector?
Conclusion
Based on recent results, we are starting to see some traction in Tesla’s energy.
Tesla’s energy is starting to make money, as reflected in the rising margins and improving profitability.
While Tesla’s energy is gaining ground, especially in the energy storage segment, there is still much work for Tesla.
I believe Tesla’s energy is on the right track.
What do you think?
Please leave your comment below.
References and Credits
1. All financial figures presented in this article were obtained and referenced from Tesla’s financial statements, SEC filings, earnings releases, shareholders letter, annual reports, etc., which are available in Tesla Update Letters and Presentations.
2. Featured images were used under Creative Common License and obtained from Dave Dugdale and Nick Ares.
Disclosure
References and examples such as tables, charts, and diagrams are constantly reviewed to avoid errors, but we cannot warrant the total correctness of all content.
The content in this article is for informational purposes only and is neither a recommendation nor a piece of financial advice to purchase a stock.
If you find the information in this article helpful, please consider sharing it on social media and providing a link to this article from any website so that more articles like this can be created in the future.
Thank you!

