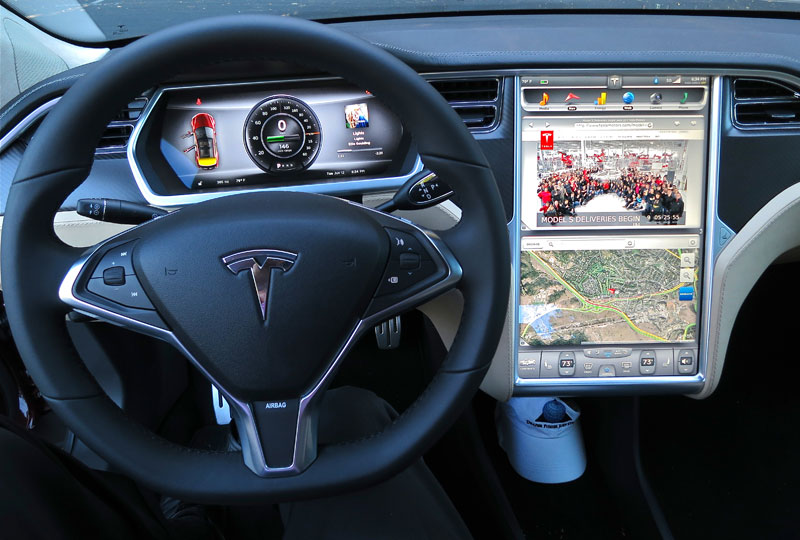
The interior of a Tesla Model S. Flickr Image.
Most companies incur various operating expenses such as research and development, rentals, property maintenance, payroll, marketing, advertising, and administrative costs. Tesla (NASDAQ: TSLA) is no exception.
In recent years, Tesla’s operating expenses have surged dramatically, reaching record levels in 2024.
This article explores several statistics related to the automaker’s operating costs, including the operating expense figures, a breakdown of these costs, various ratios, and growth rates. However, it does not cover costs of sales.
You may find related statistic of Tesla on these pages:
- Tesla advertising and marketing expenses versus Ford and General Motors,
- Tesla inventory turnover and days of inventory, and
- Tesla vehicle margin vs Ford Motor.
Please use the table of contents to navigate this page.
Table Of Contents
Definitions And Overview
O2. What is driving the significant growth in Tesla’s operating expenses?
Consolidated Results
B1. Total Operating Expenses
B2. YoY Growth Rates Of Total Operating Expenses
Results By Category
C1. Breakdown Of Operating Expenses
C2. Breakdown Of Operating Expenses In Percentage
C3. YoY Growth Rates Of Operating Expenses Breakdown
Ratio To Revenue
F1. Total Operating Expenses To Revenue Ratio
F2. R&D And SGA To Revenue Ratio
Summary And Reference
S1. Summary
S2. References and Credits
S3. Disclosure
Definitions
To help readers understand the content better, the following terms and glossaries have been provided.
R&D Expense: Tesla’s R&D expense primarily consist of personnel costs for teams in engineering and research, manufacturing engineering and manufacturing test organizations, prototyping expenses, contract and professional services, and amortized equipment expenses.
SGA Expense: Tesla’s SGA expense primarily consists of personnel and facilities costs related to stores, marketing and advertising, sales, executive, finances, human resources, information technology, legal organizations, and fees for professional and contract services and litigation settlements.
Tesla’s marketing promotional and advertising costs are part of the SGA expense. In the annual reports, Tesla stated that its marketing, promotional, and advertising costs was immaterial.
Restructuring and Other Expense: Tesla’s restructuring and other expenses are related to the following items:
1. Employee termination expenses
2. Losses from sub-leasing a facility
3. Disposal of tangible assets
4. Shortening of the useful life of a trade name intangible asset
5. Impairment losses
6. Court settlement fees
Restructuring expenses were incurred only during specific periods when Tesla undertook particular restructuring actions. These actions included measures such as closing certain stores to reduce costs and enhance operational efficiency.
Operating Expenses to Revenue Ratio: The Operating Expenses to Revenue Ratio is a financial metric measuring a company’s operating expenses as a percentage of its total revenue.
This ratio helps assess how much of a company’s revenue is being used to cover its operating expenses, providing insights into operational efficiency and cost management.
Here’s the formula to calculate the Operating Expenses to Revenue Ratio:
\[\text{OPEX to Revenue Ratio} = \left( \frac{\text{Total OPEX}}{\text{Total Revenue}} \right) \times 100\%\]
A lower ratio indicates that a smaller portion of revenue is consumed by operating expenses, suggesting more efficient operations.
Conversely, a higher ratio means that a larger portion of revenue is used to cover operating costs, which could indicate potential inefficiencies or higher operational costs.
What is driving the significant growth in Tesla’s operating expenses?
The significant growth of Tesla’s operating expenses can be attributed to several key factors:
- Expansion and Scaling: Tesla has been rapidly expanding its production capacity, opening new factories, and increasing its workforce to meet the growing demand for electric vehicles. This expansion requires substantial investments in facilities, equipment, and personnel.
- Research and Development (R&D): Tesla continues to invest heavily in R&D to innovate and develop new technologies, improve existing products, and explore new ventures such as autonomous driving and energy solutions. These investments are crucial for maintaining its competitive edge in the market.
- Marketing and Advertising: As Tesla aims to capture a larger market share, it has increased its marketing and advertising efforts to build brand awareness and attract new customers. This includes promotional campaigns, advertising expenses, and expanding its sales and service network.
- Operational Costs: The costs associated with running and maintaining Tesla’s operations, including payroll, property maintenance, and administrative expenses, have also contributed to the overall increase in operating expenses.
- Strategic Acquisitions and Partnerships: Tesla has engaged in strategic acquisitions and partnerships to enhance its capabilities and expand its product offerings. These activities often involve significant financial commitments.
- Regulatory and Compliance Costs: Tesla has had to navigate various regulatory requirements and compliance standards, which can incur additional costs related to legal, environmental, and safety regulations.
These factors collectively drive the substantial growth in Tesla’s operating expenses, reflecting the company’s aggressive growth strategy and commitment to innovation and market expansion.
Total Operating Expenses
tesla-operating-expenses-by-year
(click image to expand)
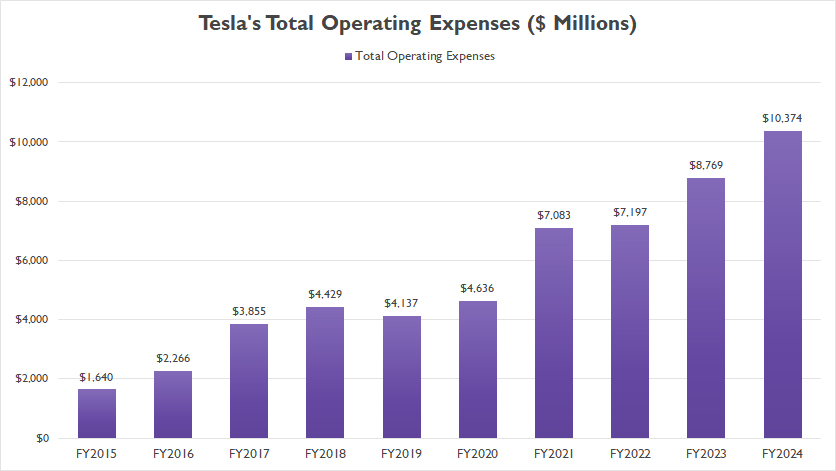
Tesla’s total operating expenses reached a record $10.4 billion in fiscal year 2024, an increase of 18% or $1.6 billion compared to 2023.
Since fiscal year 2015, Tesla’s total operating expenses have surged by more than 500%, escalating from a mere $1.6 billion in fiscal year 2015 to a staggering $10.4 billion in fiscal year 2024.
This dramatic increase highlights Tesla’s aggressive growth and expansion strategy.
The substantial rise in operating expenses can be attributed to various factors such as significant investments in research and development, the expansion of production facilities, increased marketing and advertising efforts, and the scaling up of operations to meet rising demand.
Additionally, Tesla’s commitment to innovation and development of new technologies, such as autonomous driving and energy solutions, has further driven up costs.
This trend underscores the company’s dedication to maintaining its competitive edge and leadership in the electric vehicle market.
YoY Growth Rates Of Total Operating Expenses
tesla-operating-expenses-growth-rates
(click image to expand)
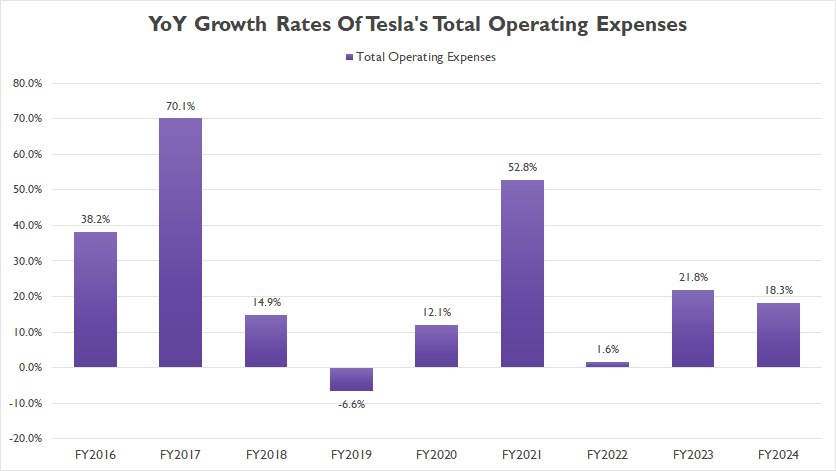
In fiscal year 2024, Tesla’s total operating expenses grew by 18%, slightly lower than the 22% growth rate recorded in fiscal year 2023. This deceleration suggests a more measured pace of cost increase.
Despite this slight decline, Tesla’s operating expenses have continued to expand significantly. Over the past three years, between fiscal years 2022 and 2024, Tesla recorded an average annual growth rate of 14% for its total operating expenses.
This consistent rise in operating expenses reflects Tesla’s ongoing commitment to scaling its operations and investing in future growth. The company continues to channel substantial funds into research and development, production capacity expansion, and global market penetration.
Tesla’s dedication to innovation and maintaining its competitive edge in the rapidly evolving electric vehicle industry necessitates these increased expenditures.
Furthermore, the expansion of its product portfolio and its endeavors in autonomous driving technology and energy solutions also contribute to the overall rise in operating costs.
Overall, while the pace of growth in operating expenses has slightly moderated, Tesla’s financial commitment to achieving its long-term strategic objectives remains robust.
Breakdown Of Operating Expenses
tesla-operating-expenses-breakdown
(click image to expand)
Tesla’s operating expenses consist of R&D cost, SG&A, and restructuring and other costs. The definitions of these components are available here: R&D, SG&A, and restructuring.
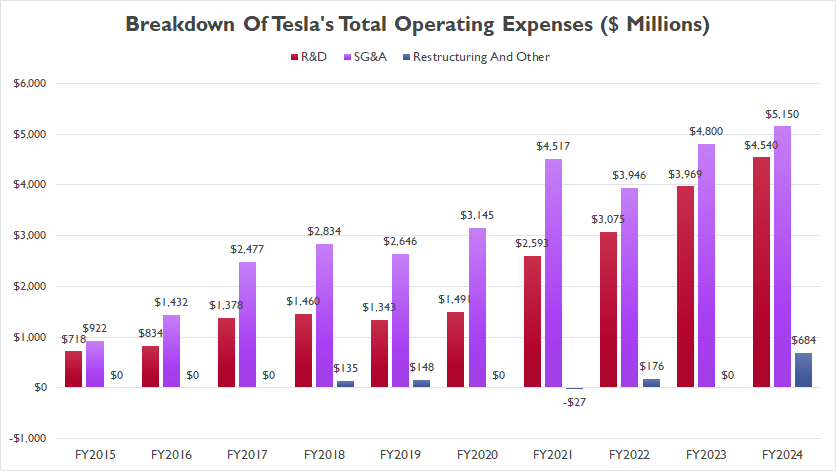
The breakdown of Tesla’s operating expenses, as presented in the chart above, indicates that SG&A (Selling, General, and Administrative) expenses make up the largest portion of the total.
In fiscal year 2024, SG&A expenses amounted to $5.2 billion, representing a 7% increase from the $4.8 billion recorded in fiscal year 2023.
Tesla’s R&D expenses reached $4.5 billion in fiscal year 2024, marking a significant increase from the $4 billion recorded in fiscal year 2023. This makes R&D the second-largest expense category after SG&A.
Both categories of expenses have shown substantial growth over the years, reaching record levels in recent periods. The consistent increase in these expenses highlights Tesla’s aggressive investment strategy and its commitment to scaling operations, driving innovation, and expanding market reach.
The rise in SG&A expenses underscores Tesla’s efforts to strengthen its brand presence and enhance customer engagement. The growth reflects Tesla’s focus on building a robust sales and service network, effective marketing and advertising campaigns, and efficient administrative operations to support its expanding global footprint.
Similarly, the significant growth in R&D expenses underscores Tesla’s dedication to technological advancement and innovation.
The persistent growth of Tesla’s R&D is indicative of the automaker’s ongoing investments in developing new vehicle models, enhancing battery technology, advancing autonomous driving capabilities, and exploring alternative energy solutions.
These investments are crucial for maintaining Tesla’s competitive edge and aligning with its long-term vision of accelerating the world’s transition to sustainable energy.
On the other hand, Tesla’s restructuring expenses constitute a relatively small portion of the company’s total operating expenses. However, in fiscal year 2024, these costs experienced a significant surge, reaching a record high of $684 million.
This marked increase highlights the extensive measures Tesla has undertaken to streamline its operations and optimize its organizational structure.
These expenditures are likely associated with various initiatives, such as organizational realignments, facility closures, employee severance packages, and other cost-cutting measures.
While these expenses represent a short-term financial burden, they are intended to yield long-term benefits by creating a more agile and efficient organization.
Breakdown Of Operating Expenses In Percentage
tesla-operating-expenses-breakdown-in-percentage
(click image to expand)
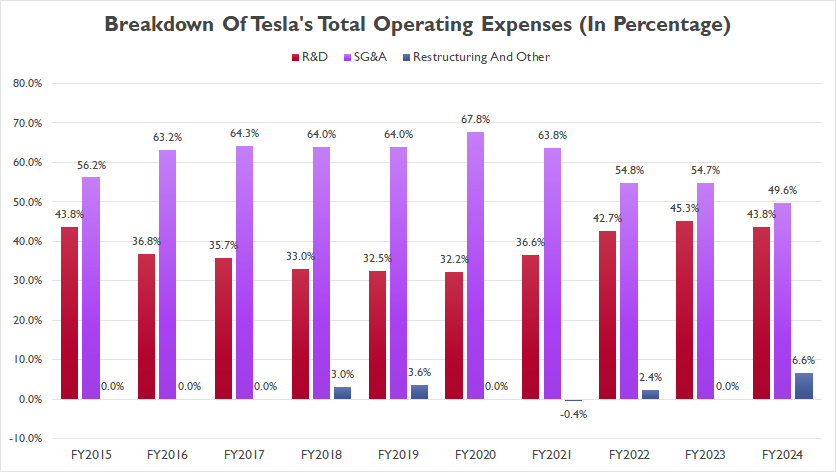
Tesla’s operating expenses consist of R&D cost, SG&A, and restructuring and other costs. The definitions of these components are available here: R&D, SG&A, and restructuring.
Tesla’s SG&A (Selling, General, and Administrative) expenses have consistently accounted for the largest portion of its total operating expenses, as shown in the chart above.
In fiscal year 2024, SG&A expenses made up 50% of Tesla’s total operating expenses, marking a notable decrease from the 55% recorded in fiscal year 2023.
This reduction indicates an improvement in cost management and operational efficiency, even as the overall expenditures continued to grow.
On the other hand, in fiscal year 2024, Tesla’s R&D expense accounted for 44%, while restructuring cost constituted nearly 7%. A notable trend is the significant rise in Tesla’s R&D cost-to-revenue ratio.
After reaching a low of 33% in fiscal year 2020, this ratio climbed substantially, reaching a record high of 44% in fiscal year 2024. This marks a significant increase and brings the ratio back to levels last seen in 2015.
The increase in the R&D cost-to-revenue ratio highlights Tesla’s amplified focus on innovation and technological advancements.
As of fiscal year 2024, Tesla’s restructuring expenses made a significant comeback, comprising 7% of the total operating costs. This notable surge indicates that Tesla has undertaken substantial measures to streamline its operations and enhance efficiency.
The resurgence of restructuring expenses suggests that Tesla has likely engaged in strategic actions such as closing underperforming stores, realigning its organizational structure, optimizing its supply chain, and implementing cost-cutting measures.
YoY Growth Rates Of Operating Expenses Breakdown
tesla-yoy-growth-rates-of-operating-expenses-breakdown
(click image to expand)
Tesla’s operating expenses consist of R&D cost, SG&A, and restructuring and other costs. The definitions of these components are available here: R&D, SG&A, and restructuring.
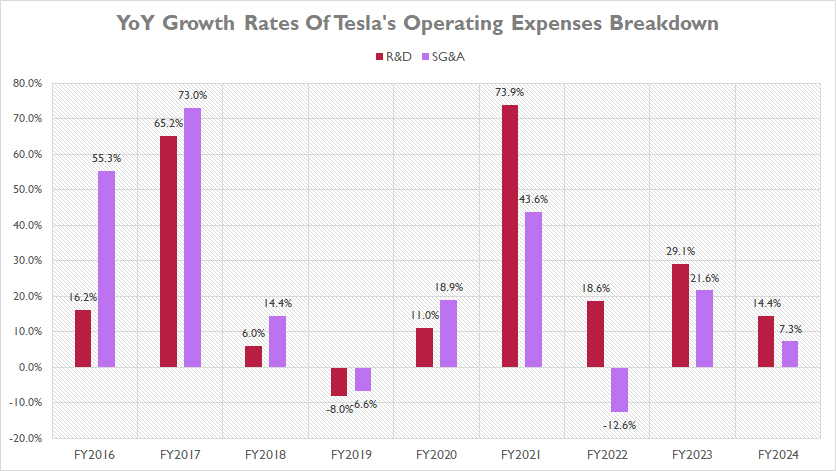
In terms of the YoY growth rate, Tesla’s R&D cost has grown the fastest compared to other operating expenses.
Over the past three years, from fiscal year 2022 to 2024, Tesla’s R&D expenses have grown at an average annual rate of 21%, making it the fastest-growing component among all operating expenses.
In fiscal year 2024, Tesla’s R&D expenses increased by 14% year-over-year, compared to a higher growth rate of 29% recorded in fiscal year 2023.
On the other hand, over the past three years, from fiscal year 2022 to 2024, Tesla has recorded an average annual growth rate of only 5% for its SG&A expense, a signficantly lower figure compared to that of the R&D cost.
In fiscal year 2024, Tesla also registered a significantly lower growth rate for its SG&A cost, measuring just 7% year-over-year, as shown in the chart above.
Overall, the contrasting growth rates of R&D and SG&A expenses highlight Tesla’s focus on balancing operational efficiency with significant investments in technology and innovation to support its long-term growth objectives.
Total Operating Expenses To Revenue Ratio
Tesla’s operating expense to revenue ratia
(click image to expand)
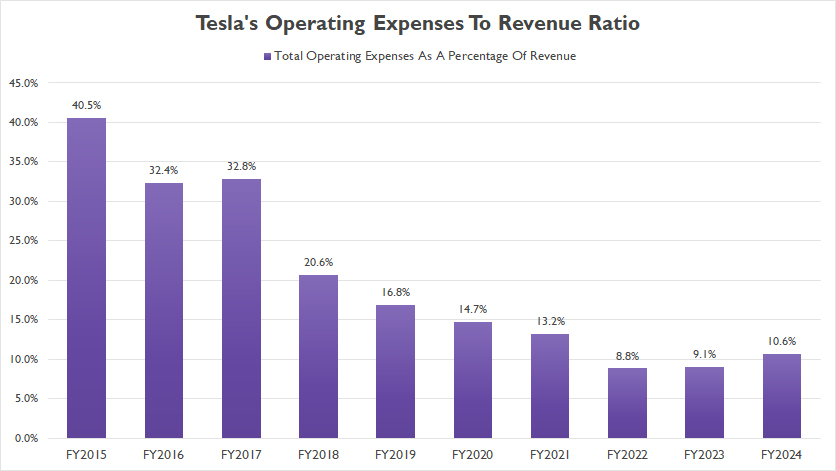
The definition of Tesla’s operating expenses to revenue ratio is available here: operating expenses to revenue ratio.
Despite the significant rise in Tesla’s operating expenses over recent years, the ratio of these expenses to revenue has actually decreased. By the end of fiscal year 2024, this ratio had fallen to just 11%, a significant drop from 40% in fiscal year 2015.
The decline in the operating expenses-to-revenue ratio is a positive indicator of Tesla’s growing revenue base outpacing the increase in its costs.
It demonstrates the company’s ability to achieve higher sales and revenue while maintaining operational efficiency.
This improvement can be attributed to several factors, including increased production capacity, better cost management, and economies of scale as Tesla continues to expand its market presence.
Overall, the decrease in the operating expenses-to-revenue ratio highlights Tesla’s ability to manage its costs effectively while continuing to grow its revenue.
R&D And SGA To Revenue Ratio
R&D and SGA expense to revenue ratio
(click image to expand)
The definition of Tesla’s operating expenses to revenue ratio is available here: operating expenses to revenue ratio.
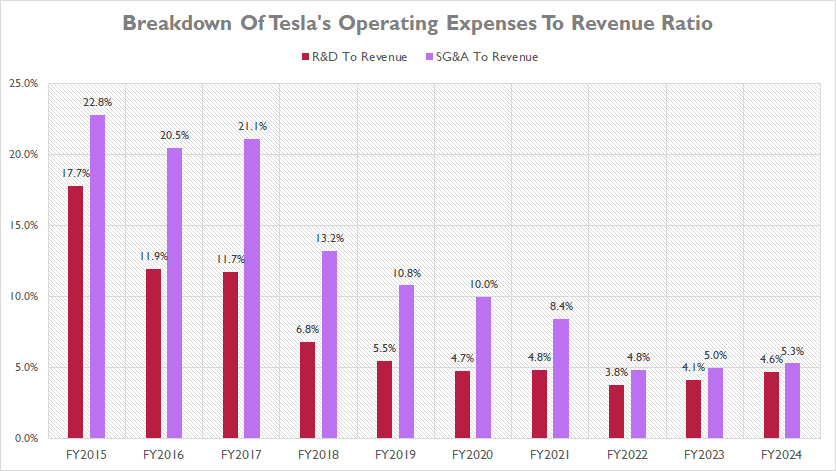
Similarly, while Tesla’s R&D and SG&A expenses have seen significant increases over the years, the respective expenses-to-revenue ratios have actually declined, as illustrated in the chart above.
For instance, by the end of fiscal year 2024, Tesla’s SG&A expenses as a percentage of revenue were just 5%, whereas the R&D-to-revenue ratio stood at 4.6% during the same period.
Although these ratios have experienced slight increases over the past three years, they represent a substantial decline when viewed over the long term.
Back in fiscal year 2015, Tesla’s SG&A and R&D expenses as a percentage of revenue were notably higher, at 23% and 18%, respectively.
The considerable reduction in the expenses-to-revenue ratios over the years indicates Tesla’s impressive growth in revenue, which has outpaced the increase in operating costs.
The decline in these ratios reflects Tesla’s ability to achieve greater efficiency and cost-effectiveness as it continues to expand its operations and scale its production capabilities.
By effectively managing its expenses while driving revenue growth, Tesla has been able to allocate resources more efficiently, supporting its long-term strategic goals and maintaining a competitive edge in the market.
Conclusion
In summary, Tesla’s operating expenses have significantly increased over recent years, driven by substantial investments in SG&A and R&D.
However, the company’s ability to grow its revenue at a faster pace has led to a decrease in the operating expenses-to-revenue ratio, indicating improved operational efficiency and cost management.
References and Credits
1. All financial figures presented were obtained and referenced from Tesla’s annual reports published on the company’s investor relations page: Tesla Investor Relations.
2. Flickr Images
Disclosure
We may utilize the assistance of artificial intelligence (AI) tools to produce some of the text in this article. However, the data is directly obtained from original sources and meticulously cross-checked by our editors multiple times to ensure its accuracy and reliability.
If you find the information in this article helpful, please consider sharing it on social media. Additionally, providing a link back to this article from any website can help us create more content like this in the future.
Thank you for your support and engagement! Your involvement helps us continue to provide high-quality, reliable content.

Hello, thank you for your article. Is it possible to exhibit your graphs in an article I’m writing with proper credit?
Sure, no problem. Please go ahead.
How much of the operating expenses is TRANSPORTATION;
delivery of resources and customer delivery? Any idea what Tesla pays for ‘contract-commercial -trucking’? Yeah, Tesla-Semi is a platform to lower ‘cost-of-transportation’ for delivery of resources and production. Mr. Musk is producing his own trucking empire, …not a truck for delivering @Pepsi snacks