Vintage. Pexels Image.
This article presents General Motors’ (NYSE: GM) vehicle sales by country, specifically focusing on the U.S., China, and Brazil. These countries are selected due to their significant vehicle volumes, which play a crucial role in GM’s global sales strategy.
The vehicle sales statistics presented here are based on GM’s total vehicle sales data extracted from the annual reports. This data encompasses the company’s retail volumes, fleet sales, and vehicles used by dealers in their businesses. More information about GM’s total vehicle sales is available here: GM’s total vehicle sales.
Investors looking for other statistics of General Motors may find more resources on these pages:
- GM ev sales and market share,
- GM global sales and market share, and
- GM wholesale by business segment.
Please use the table of contents to navigate this page.
Table Of Contents
Definitions And Overview
O2. What Is Driving The Decline In GM’s Sales In China?
Vehicle Sales By Country
A1. Sales In The U.S., China And Brazil
A2. Sales In The U.S., China And Brazil In Percentage
Vehicle Sales In Europe
A3. Sales In The U.K. And Germany
Sales Growth By Country
A4. Sales Growth In The U.S., China, And Brazil
Conclusion And Reference
S1. Conclusion
S2. References and Credits
S3. Disclosure
Definitions
To help readers understand the content better, the following terms and glossaries have been provided.
Total Vehicle Sales: Per the latest annual report, General Motors defines its total vehicle sales as:
- retail sales (i.e., sales to consumers who purchase new vehicles from dealers or distributors);
- fleet sales (i.e., sales to large and small businesses, governments and daily rental car companies); and
- certain vehicles used by dealers in their business.
Total vehicle sales data includes all sales by joint ventures on a total vehicle basis, not based on the percentage ownership interest in the joint venture. Certain joint venture agreements in China allow for the contractual right to report vehicle sales of non-GM trademarked vehicles by those joint ventures, which are included in the total vehicle sales it reports for China.
While total vehicle sales data does not correlate directly to the revenue it recognizes during a particular period, GM believes it is indicative of the underlying demand for its vehicles.
Total vehicle sales data represents management’s good faith estimate based on sales reported by dealers, distributors and joint ventures; commercially available data sources such as registration and insurance data; and internal estimates and forecasts when other data is unavailable.
What Is Driving The Decline In GM’s Sales In China?
The decline in GM’s vehicle sales in China can be attributed to several factors:
- Rise of Domestic Brands: Chinese domestic brands, such as BYD and Xiaomi, have gained significant market share by offering advanced and affordable electric vehicles (EVs). These brands have created a brutal price war, making it difficult for foreign automakers like GM to compete on price.
- Government Subsidies: The Chinese government has heavily subsidized the EV industry, leading to a surge in domestic EV production and sales. This has resulted in a highly competitive market where foreign brands struggle to keep up.
- Economic Factors: The Chinese economy has faced challenges, including trade tensions with the U.S. and a general economic slowdown. These factors have impacted consumer spending and demand for vehicles.
- Regulatory Changes: China has implemented stricter regulations for both EVs and internal combustion engine vehicles, adding to the challenges faced by foreign automakers.
- Operational Issues: GM has faced operational setbacks in China, including factory closures and cost-cutting measures. These actions have affected production volumes and sales performance.
Despite these challenges, GM has seen some improvement in its sales momentum in China, particularly in the fourth quarter of 2024. However, the overall trend has been a decline in sales over recent years.
Sales In The U.S., China And Brazil
GM-sales-in-the-us-china-and-brazil
(click image to expand)
The definition of GM’s vehicle sales is available here: total vehicle sales.
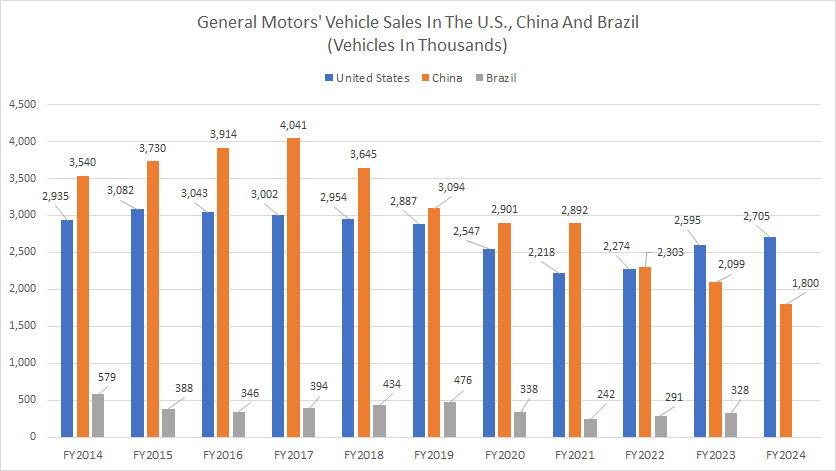
GM delivered 2.7 million vehicles in the U.S. in fiscal year 2024, up by 4% from fiscal year 2023. This marks a significant recovery since bottoming at 2.2 million sales in fiscal year 2021. Over the past three years, GM’s sales in the U.S. have increased by 23%, rising from 2.2 million sales to 2.7 million sales.
On the other hand, GM’s sales in China have continued to decline after peaking at 4 million vehicles in fiscal year 2017. As of fiscal year 2024, GM delivered just 1.8 million vehicles in China, marking the lowest level recorded in a decade.
Several factors are driving the decline in GM’s sales in China, which can be found in the detailed analysis provided here: GM’s sales decline in China.
For Brazil, GM has experienced a similar downtrend in sales. As of fiscal year 2023, GM delivered 328,000 vehicles in Brazil, marking a significant rise from the 291,000 units sold in fiscal year 2022.
Similar to the trend observed in the U.S., GM’s sales in Brazil have remarkably recovered post-pandemic since fiscal year 2021. GM’s Brazil sales bottomed at 242,000 vehicles in fiscal year 2021. Since then, GM’s Brazil sales have increased by 36%, rising from 242,000 units to 328,000 units over two years.
Sales In The U.S., China And Brazil In Percentage
GM-percentage-of-sales-in-the-us-china-and-brazil
(click image to expand)
The definition of GM’s vehicle sales is available here: total vehicle sales.
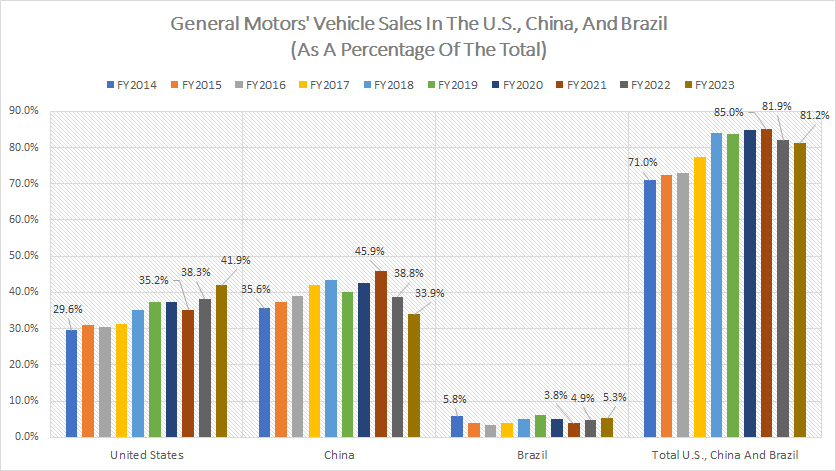
Relative to the total, GM’s U.S. sales have accounted for the highest portion, reaching 42% in fiscal year 2023. Meanwhile, GM’s China sales made up 34% of the total in the same period, while Brazil accounted for only 5.3% of the total.
Together, GM’s sales in the U.S., China, and Brazil in 2023 accounted for approximately 81% of the company’s worldwide vehicle volumes, nearly encompassing the entire sales volume of the company. This ratio has grown from 71% to 81% over the past ten years, illustrating the increasing significance of these markets to the automaker.
A notable trend is the considerable increase in sales contribution from the United States, which has risen from 30% in fiscal year 2014 to 42% as of fiscal year 2023.
On the other hand, the sales contribution from GM’s China has slightly decreased from 36% to 34% over the past decade, while that of Brazil has remained flat at slightly above 5%.
As a result, the growth in the sales contribution of the combined volume from the U.S., China, and Brazil has been primarily attributed to the increase in sales from the U.S., as sales in China and Brazil have remained muted.
Sales In The U.K. And Germany
GM-sales-in-the-uk-and-germany
(click image to expand)
The definition of GM’s vehicle sales is available here: total vehicle sales.
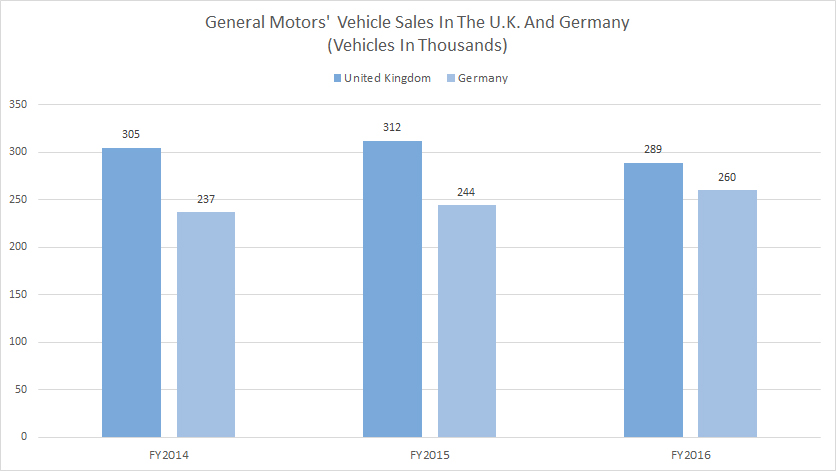
General Motors sold nearly 290,000 vehicles in the UK and 260,000 vehicles in Germany in fiscal year 2016 before exiting these markets. These were the latest sales figures for GM in these countries.
For your information, GM has not provided a breakdown of vehicle sales data for the UK and Germany since 2017.
Sales Growth In The U.S., China, And Brazil
GM-sales-growth-in-the-us-china-and-brazil
(click image to expand)
The definition of GM’s vehicle sales is available here: total vehicle sales.
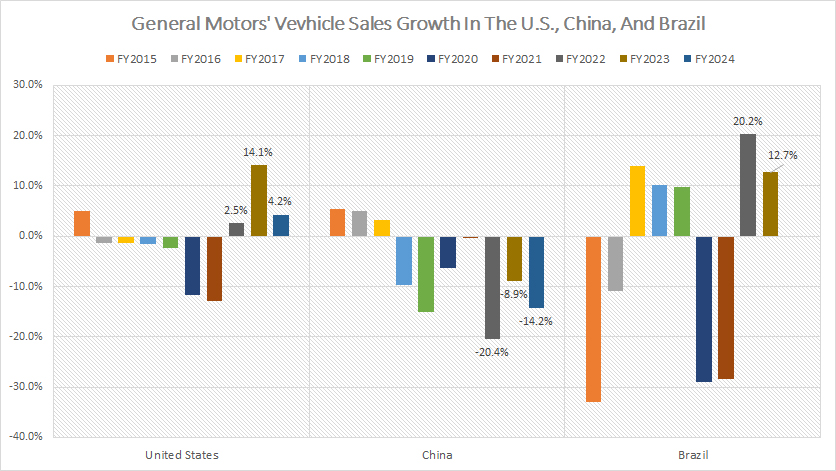
As shown in the graph above, GM has experienced a significant decline in vehicle sales in China. Since fiscal year 2018, GM has not reported positive vehicle sales growth in China.
In fiscal year 2024, GM’s sales in China tumbled by 14%, one of the worst figures ever reported. On average, the automaker has recorded an annual vehicle sales decline of 15% over the past three years.
In contrast, GM’s vehicle sales in the U.S. have significantly recovered over the past three years, averaging around 7% annually between fiscal year 2022 and 2024, as illustrated in the chart above.
In fiscal year 2024, GM’s sales growth in the U.S. amounted to 4%, compared to 14% recorded in the previous year.
GM’s sales in Brazil have rebounded since fiscal year 2022, totaling approximately 20% in fiscal year 2022 and 13% in fiscal year 2023. On average, the automaker recorded an annual sales growth of 2% between fiscal year 2021 and 2023.
Conclusion
One key summary from GM’s vehicle sales data is the significant regional disparity in sales performance. While GM has seen a remarkable recovery and growth in the U.S., with sales increasing by 7% between fiscal year 2022 and 2024, its performance in China has been dismal, with a consistent decline since 2017 and a 14% drop in fiscal year 2024 alone.
This contrast highlights the challenges GM faces in different markets and underscores the importance of regional strategies tailored to local conditions and consumer preferences.
Additionally, the rebound in Brazil post-pandemic, with a 2% increase in sales annually on average since fiscal year 2021, indicates potential for more growth in emerging markets.
However, the overall contribution of these regions (U.S., China, and Brazil) to GM’s global sales remains critical, accounting for approximately 81% of the company’s worldwide vehicle volumes.
This summary suggests that GM’s future success will depend heavily on its ability to navigate regional challenges and capitalize on growth opportunities in key markets.
Credits and References
1. All sales figures presented were obtained and referenced from General Motors’ annual reports and vehicle sales releases published on the company’s investor relations page: GM News Releases.
2. Flickr Images.
Disclosure
We may utilize the assistance of artificial intelligence (AI) tools to produce some of the text in this article. However, the data is directly obtained from original sources and meticulously cross-checked by our editors multiple times to ensure its accuracy and reliability.
If you find the information in this article helpful, please consider sharing it on social media. Additionally, providing a link back to this article from any website can help us create more content like this in the future.
Thank you for your support and engagement! Your involvement helps us continue to provide high-quality, reliable content.


