A 1958 GM Oldsmobile vehicle. Flickr Image.
This article presents General Motors (NYSE: GM) vehicle wholesale figures.
For your information, GM publishes two types of vehicle sales data:
(2) Total vehicle sales.
What Is Vehicle Wholesale
According to GM, wholesale vehicles are delivered to dealers or distributors, and the sales of these vehicles are translated into revenue in the income statements.
However, wholesale numbers do not include vehicles sold by GM’s joint ventures or affiliates, such as those in China in which GM does not have a controlling interest.
Here is a quote extracted from GM’s statements regarding wholesale deliveries.
-
“We present wholesale and total vehicle sales data to assist in the analysis of our revenue and our market share.
Wholesale vehicle sales data consists of sales to GM’s dealers and distributors and sales to the U.S. Government and excludes vehicles sold by our joint ventures.
Wholesale vehicle sales data correlates to our revenue recognized from the sale of vehicles, which is the largest component of Automotive net sales and revenue.”
Referring to the statements above, GM’s wholesale vehicles are vehicles delivered to dealers and distributors, and revenues are recorded once the transactions are completed.
What Is Total Vehicle Sales
On the other hand, total vehicle sales are retail sales and are vehicles delivered from dealers or distributors to end consumers.
Total vehicle delivery bypasses General Motors and has no relationship with the company.
Therefore, total vehicle sales do not translate to GM’s sales revenue presented in the income statements.
Here is a quote extracted from GM’s statements regarding total vehicle sales.
-
“Total vehicle sales data represents:
(1) retail sales (i.e., sales to consumers who purchase new vehicles from dealers or distributors);
(2) fleet sales, such as sales to large and small businesses, governments, and daily rental car companies; and
(3) vehicles used by dealers in their businesses, including courtesy transportation vehicles.Total vehicle sales data includes all sales by joint ventures on a total vehicle basis, not based on our percentage ownership interest in the joint venture.”
Therefore, GM’s total vehicle sales include retail volume, fleet sales, and vehicles delivered from dealers to other businesses. However, the sales of these vehicles are not recognized as sales revenue earned by GM.
What Is Presented In This Article
In this article, you will find GM’s vehicle wholesale or vehicle sales data that correlate with revenue in the income statements.
The wholesale and total sales data are vastly different and can differ considerably.
The vehicle sales data presented on other websites may not be clearly explained, whether they are wholesale or retail sales data.
Sometimes, the retail sales data may not necessarily indicate the realistic nature of GM’s business condition simply because the retail sales data represents only sales from dealers and distributors to customers.
Readers interested in GM’s retail sales may find more information on this webpage – GM retail sales and market share.
Let’s look at GM vehicle wholesale.
Please use the table of contents to navigate this page.
Table Of Contents
Definitions And Overview
O2. How Does General Motors Distribute Its Vehicles?
Consolidated Results
A1. Vehicle Wholesale By Quarter
A2. Vehicle Wholesale By TTM
A3. Vehicle Wholesale By Year
Results By Segment
B1. GMNA And GMI Vehicle Wholesale By Quarter
B2. GMNA And GMI Vehicle Wholesale By TTM
B3. GMNA And GMI Vehicle Wholesale By Year
B4. GMNA And GMI Vehicle Wholesale By Year In Percentage
Automotive Revenue
C1. Vehicle Wholesale Vs Automotive Revenue
GM Vehicle Average Sales Price
D1. Vehicle Average Selling Price (ASP)
Growth Rates
E1. Vehicle Wholesale Year-On-Year Growth Rates
Summary And Reference
S1. Conclusion
S2. References and Credits
S3. Disclosure
Definitions
To help readers understand the content better, the following terms and glossaries have been provided.
Revenue Per Vehicle: Revenue per vehicle is a financial metric used primarily in automotive companies dealing with vehicle sales, rentals, or leasing.
It represents the average income generated per vehicle over a specific period. This metric is calculated by dividing the total revenue earned from the vehicles by the number of vehicles involved in generating that revenue.
It helps automotive companies assess the profitability and efficiency of their vehicle-related operations and make informed decisions regarding pricing, inventory management, and promotional strategies.
How Does General Motors Distribute Its Vehicles
General Motors (GM) employs a comprehensive and multi-tiered distribution strategy to ensure its vehicles reach customers around the globe. This strategy includes the following key components:
1. **Global Manufacturing Facilities**: GM manufactures vehicles in several countries across North America, South America, Europe, and Asia. This allows the company to produce vehicles closer to their main markets, reducing shipping times and costs.
2. **Dealer Network**: One of the primary methods GM uses to distribute its vehicles is through an extensive network of authorized dealerships. These dealerships are independently owned businesses with GM agreements to sell and service their vehicles. This network allows customers to purchase vehicles in their local area and receive ongoing support and maintenance.
Investors interested in GM’s number of distributors may find more information on this page: GM competitive advantage and core competencies.
3. **Online Sales Platforms**: GM has also embraced online sales platforms in recent years. These allow customers to browse models, customize their vehicle options, and even commence the purchasing process online. While the final transaction and delivery often involve a dealership, this approach offers customers more flexibility and convenience in shopping for a new vehicle.
4. **Fleet Sales and Commercial Accounts**: GM also distributes vehicles through direct sales to businesses and government agencies. This includes selling multiple vehicles at once to large organizations, rental car companies, and service providers requiring a vehicle fleet. This sales channel helps GM to secure large volume sales and maintain relationships with key commercial customers.
5. **Export Operations**: For markets where GM does not have manufacturing facilities, the company exports vehicles from its plants in other countries. This involves complex logistics, including transportation by sea or land, customs clearance, and adherence to local regulations and standards in the destination country.
6. **Partnerships and Alliances**: GM sometimes collaborates with other automotive manufacturers and distributors to penetrate specific markets or offer a broader product lineup. These partnerships can include joint ventures, technology-sharing agreements, or distribution agreements.
7. **After-Sales Support and Services**: Beyond the initial sale, GM ensures the availability of parts and services through authorized service centers and parts distributors. This network supports the long-term maintenance of vehicles, promoting brand loyalty and customer satisfaction.
By utilizing this multifaceted distribution approach, General Motors can effectively reach different customer segments and adapt to the unique demands of various global markets, ensuring their vehicles are available where and when customers want them.
Vehicle Wholesale By Quarter
GM vehicle wholesale by quarter
(click image to expand)
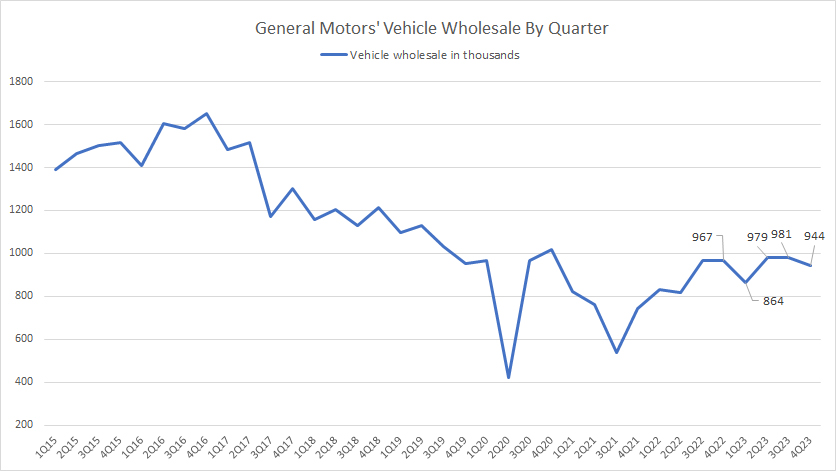
GM’s quarterly vehicle sales have significantly decreased in recent years, as shown in the chart above. For example, GM used to deliver more than 1.5 million vehicles globally per quarter.
However, this figure has come to less than 1 million vehicles per quarter in recent years. In fiscal 4Q 2023, GM delivered just 944 thousand cars globally, slightly lower than the figure reported a year ago.
On average, GM’s vehicle wholesale totaled about 942 thousand units per quarter for the past four quarters. Therefore, GM’s recent vehicle sales were much lower than its prior high of over 1 million units delivered.
GM Vehicle Wholesale By TTM
GM vehicle wholesale by ttm
(click image to expand)
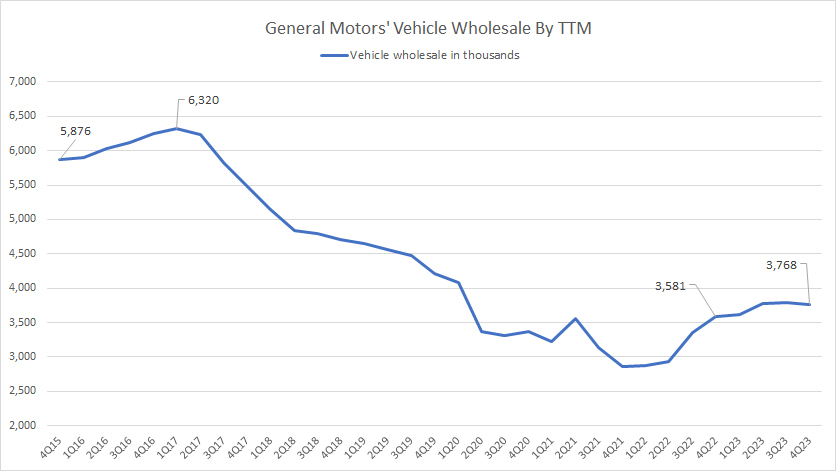
To smooth out the bumps in the quarterly plot, I created the TTM or trailing 12-month plot above better to represent the long-term trend of GM’s vehicle deliveries.
As seen, the TTM plot displays a much better trend compared to the quarterly plot. On a TTM basis, GM’s global vehicle wholesale has clearly been trending down since fiscal 2015.
The downtrend seemed much worse in fiscal 2020 and 2021, most likely driven by the COVID-19 crisis. However, in fiscal 2022, the plot reversed downward and has since been moving higher, illustrating that the bottom may have already been reached and a turnaround is ongoing.
As of 4Q 2023, GM’s global vehicle sales trended to a record high of 3.8 million units on a TTM basis, up 5% from the quarter a year ago.
Vehicle Wholesale By Year
GM vehicle wholesale
(click image to expand)
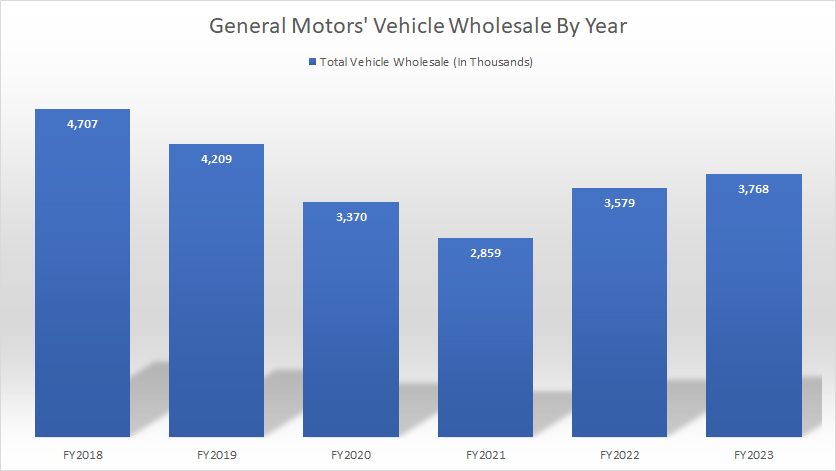
Globally, GM delivered 3.8 million vehicles in fiscal year 2023, up 5% over 2022. Although GM’s recent vehicle sales have trended higher, they are still considerably low compared to historical highs. For example, GM used to do nearly 5 million vehicle sales back in fiscal 2018.
However, this figure has significantly declined and reached a record low of 2.9 million vehicles in fiscal 2021 before recovering to 3.8 million units in 2023.
GMNA And GMI Vehicle Wholesale By Quarter
GM quarterly vehicle wholesale by region
(click image to expand)
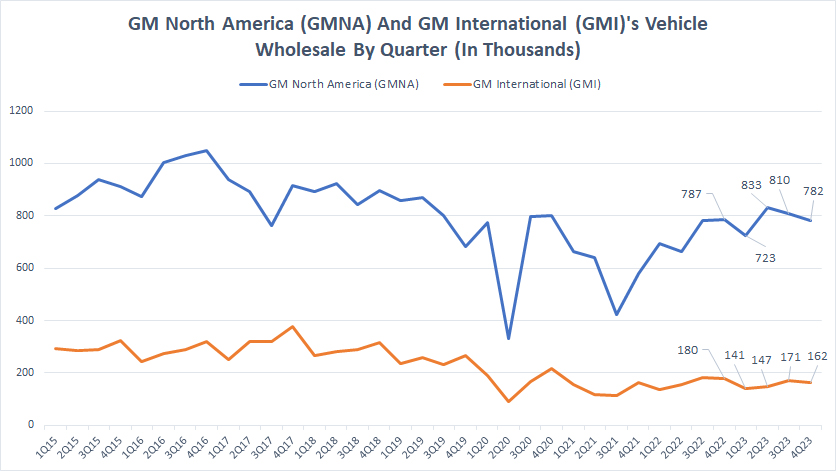
General Motors has two segments in terms of vehicle wholesale: GM North America (GMNA) and GM International (GMI). GM Europe was divested in fiscal 2017 and has ceased to exist.
GMNA delivered 800 thousand vehicles per quarter on average, while GM International’s average quarterly sales reached 155 thousand units over the past four quarters.
Their vehicle wholesale numbers are much lower than the historical highs. For example, GMNA delivered over 1 million cars per quarter in earlier years, while GMI delivered over 300 thousand units per quarter.
GMNA And GMI Vehicle Wholesale By TTM
GM vehicle wholesale by region on TTM basis
(click image to expand)
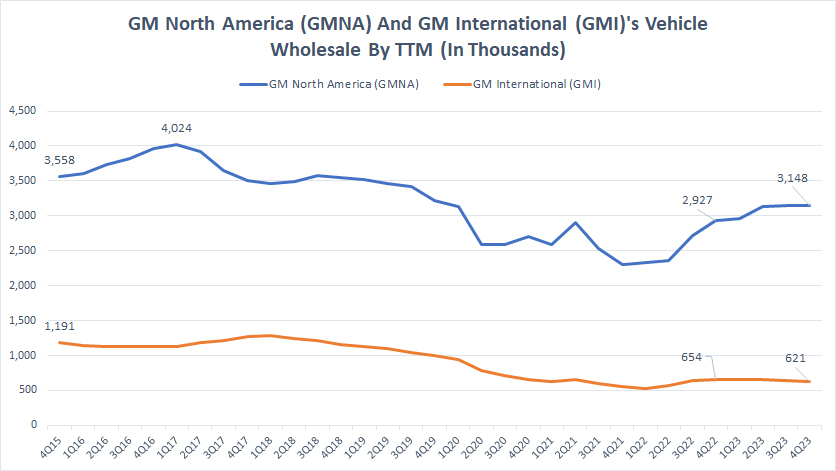
The TTM plot shows the downtrend of GM’s vehicle wholesale in both GMNA and GMI.
The vehicle wholesale of GMNA and GMI is much lower now compared to historical highs. GMNA delivered over 4 million cars in earlier years, while GMI sold over 1 million cars on a TTM basis. These results have significantly decreased in recent years.
In fiscal 2023 Q4, GMNA delivered 3.1 million cars while GMI sold 621 thousand vehicles on a TTM basis, considerably lower than their historical highs. GMI’s vehicle wholesale has been reduced by half since 2015.
Moreover, GM International appears to have recovered much slower than GMNA. As of Q4 2023, GMNA’s vehicle sales of 3.1 million units were up 8% year-on-year. On the other hand, GM International’s vehicle sales were down 5% year-on-year during the same period.
Also, GMNA’s vehicle deliveries are much higher than GMI’s, at over 5X difference.
GMNA And GMI Vehicle Wholesale By Year
GM vehicle wholesale by region
(click image to expand)
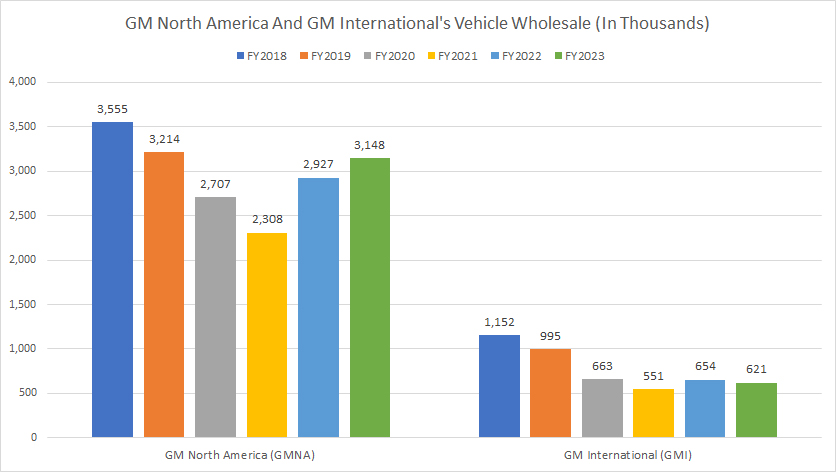
General Motors has two segments in terms of vehicle wholesale: GM North America (GMNA) and GM International (GMI). GM Europe was divested in fiscal 2017 and has ceased to exist.
Granted, fiscal 2022 represents the pivot point for General Motors. As seen, there was a significant rise in vehicle deliveries in fiscal 2022 in all segments.
GM’s vehicle wholesale had been on a downtrend before 2022. A significant turnaround occurred in 2022.
As of 2023, GM’s vehicle sales reached 3.1 million units for its North American operation, while GM International delivered 621 thousand units in the same year.
Also, GM’s vehicle sales in North America are much bigger, notably over 5X larger than the figure reported in the International segment.
In addition, GMI’s vehicle sales seem to have recovered much slower than GMNA’s. In fiscal 2023, GMI’s result was only 12% higher than in 2021, while GMNA’s recovery exceeded 30% over 2021.
GMNA And GMI Vehicle Wholesale By Year In Percentage
general-motors-vehicle-wholesale-by-region-in-percentage
(click image to expand)
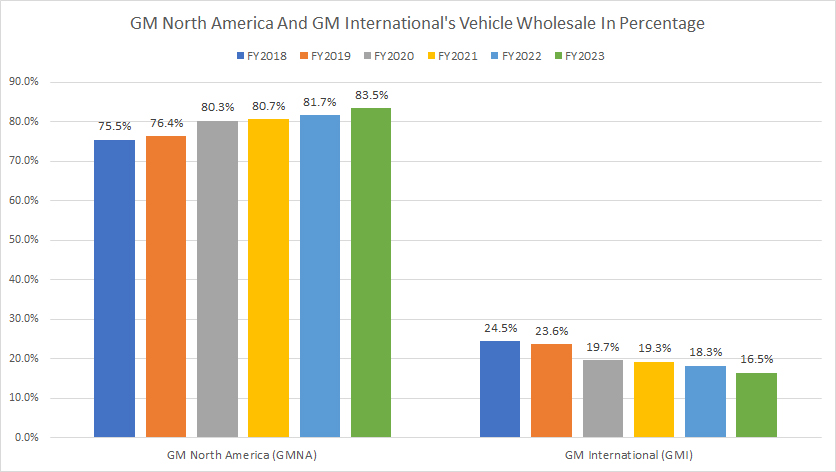
General Motors has two segments in terms of vehicle wholesale: GM North America (GMNA) and GM International (GMI). GM Europe was divested in fiscal 2017 and has ceased to exist.
The percentage of GMNA’s vehicle wholesale has significantly risen since 2018, reaching as much as 83.5% as of 2023, a record figure over the past six years.
On the other hand, the wholesale percentage of GMI’s vehicles has decreased considerably. It reached just 16.5% as of 2023.
Therefore, GMNA has a much greater impact on General Motors in terms of vehicle sales than GMI does, and this impact has been increasing, as depicted in the rising percentage figures.
GM Vehicle Wholesale Vs Automotive Revenue
GM vehicle wholesale vs automotive revenue
(click image to expand)
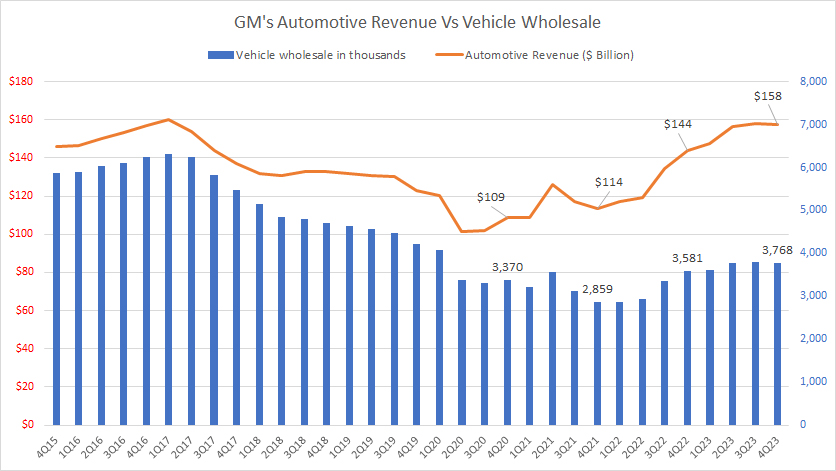
According to the chart, GM’s automotive revenue appears to have risen at a much faster pace than the results of the vehicle wholesale.
For example, GM’s automotive revenue has grown by 45% since 4Q20, while vehicle wholesale has only grown by 12% during the same period.
As of 4Q 2023, GM’s automotive revenue was already at the same level as the pre-pandemic result, while vehicle wholesale was still in one of the record lows.
Although vehicle delivery is slower than revenue growth, both results correlate closely. When vehicle delivery increases, the automotive revenue increases and vice versa. However, the automotive revenue tends to grow at a much faster pace.
That explains the rising revenue per vehicle, which we will discuss in the next section.
Average Revenue Per Vehicle
GM vehicle average selling price
(click image to expand)
The definition of GM’s revenue per vehicle is available here: revenue per vehicle.
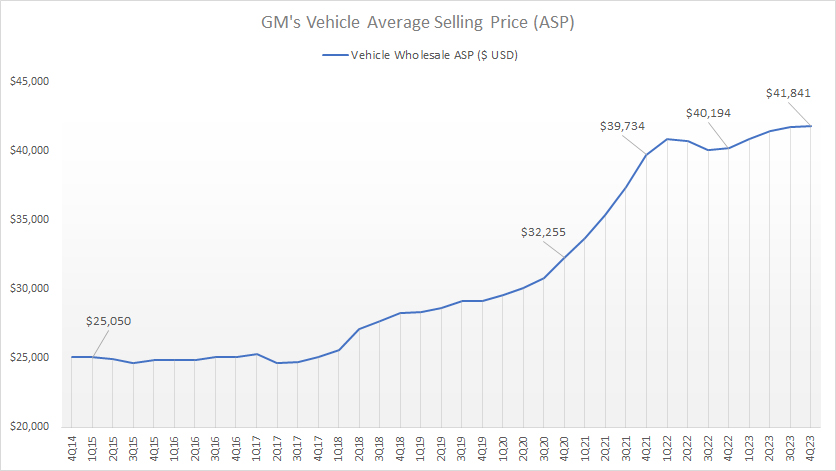
As the name implies, the vehicle’s average selling price (ASP) represents the average revenue a vehicle earns. This figure can be estimated based on the automotive revenue and vehicle wholesale figures presented in GM’s financial reports.
According to accounting standards, GM’s automotive revenue is only recognized when the ownership of vehicles is passed to dealers or when the vehicle is delivered to the hands of dealers. Therefore, we can use this information to estimate GM’s average selling price or average revenue of a vehicle.
Keep in mind that the estimated ASP represents only the wholesale price and not the retail price, which can be much higher.
According to the chart above, GM’s ASP has significantly risen since 2014. In fiscal 2014, GM’s ASP was only $25,000 per vehicle. This figure reached nearly $42,000 as of fiscal 4Q 2023. The growth rate was over 60% compared to the 2014 results.
Moreover, GM’s vehicle ASP has soared the most between 2019 and 2022. In fiscal 2021 alone, GM’s average revenue per vehicle grew by 23%, from $32,300 reported in 4Q 2020 to $39,700 reported in 4Q 2021.
On average, GM’s ASP has grown by nearly 7.0% year-on-year since fiscal 2014. In the last four quarters, on average, GM’s ASP has grown by 2.5% year-on-year. Therefore, it is no surprise to see the sky-high retail prices of trucks, cars, and SUVs in most GM dealerships nowadays.
Besides, GM’s rising ASP also explains the much faster growth rates of GM’s automotive revenue compared to the vehicle wholesale, which we saw in this section: GM automotive revenue vs wholesale.
GM Vehicle Wholesale Growth Rates
GM vehicle wholesale YoY growth rates
(click image to expand)
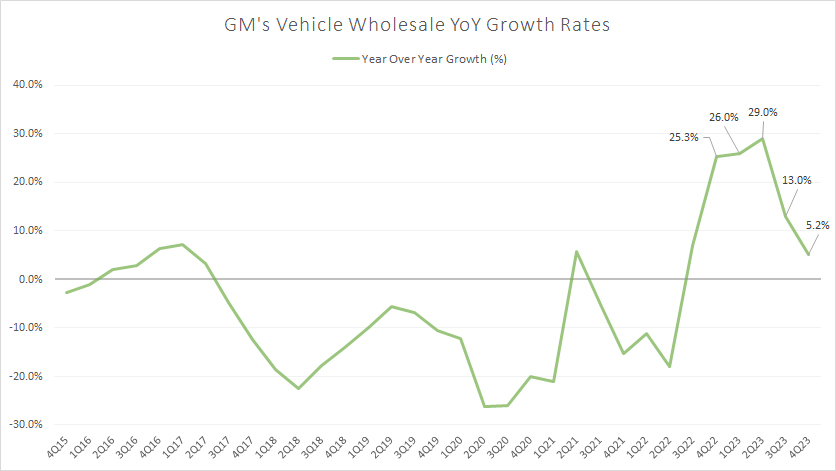
You can see that GM has experienced almost no growth in terms of global vehicle wholesale because most growth rate figures are negative, as shown in the chart above.
However, General Motors has managed to return to growth in post-COVID periods. As depicted in the chart above, GM has recorded impressive growth rates since 2022, with figures exceeding 20% in some quarters.
As of fiscal 4Q 2023, GM’s vehicle sales YoY growth tumbled to just 5.2%, a record low since 2022. Far from over, GM’s global vehicle sales growth has considerably declined at the beginning of 2023.
Does that mean GM’s vehicle sales growth has already reached a plateau?
Conclusion
In summary, General Motors’s vehicle wholesale has declined considerably over the long term, but the post-pandemic recovery looks promising.
GM North America (GMNA) and GM International (GMI) have recorded a considerable uptick in vehicle wholesale since fiscal 2022, and the rally continued into fiscal 2023.
While GM has sold fewer vehicles over the years, it has recorded an increase in automotive revenue, all due to the rising average revenue per vehicle or vehicle average sale price (ASP).
GM’s ASP has increased by nearly 7.0% annually in the past ten years. It rose the most between fiscal 2020 and 2022, illustrating the ability of the company to raise vehicle sale prices.
References and Credits
1. All data presented in this article were obtained and referenced from GM quarterly and annual reports, earnings presentations, press releases, investors slides, SEC filings, etc., which are available at General Motors Investor Relation.
2. Featured images in this article are used under Creative Commons licenses and sourced from the following websites: Cam Miller and GM Europe.
Disclosure
References and examples such as tables, charts, and diagrams are constantly reviewed to avoid errors, but we cannot warrant the total correctness of all content.
The content in this article is for informational purposes only and is neither a recommendation nor a piece of financial advice to purchase a stock.
If you find the information in this article helpful, please consider sharing it on social media and provide a link to it from any website to create more articles like this.
Thank you!

