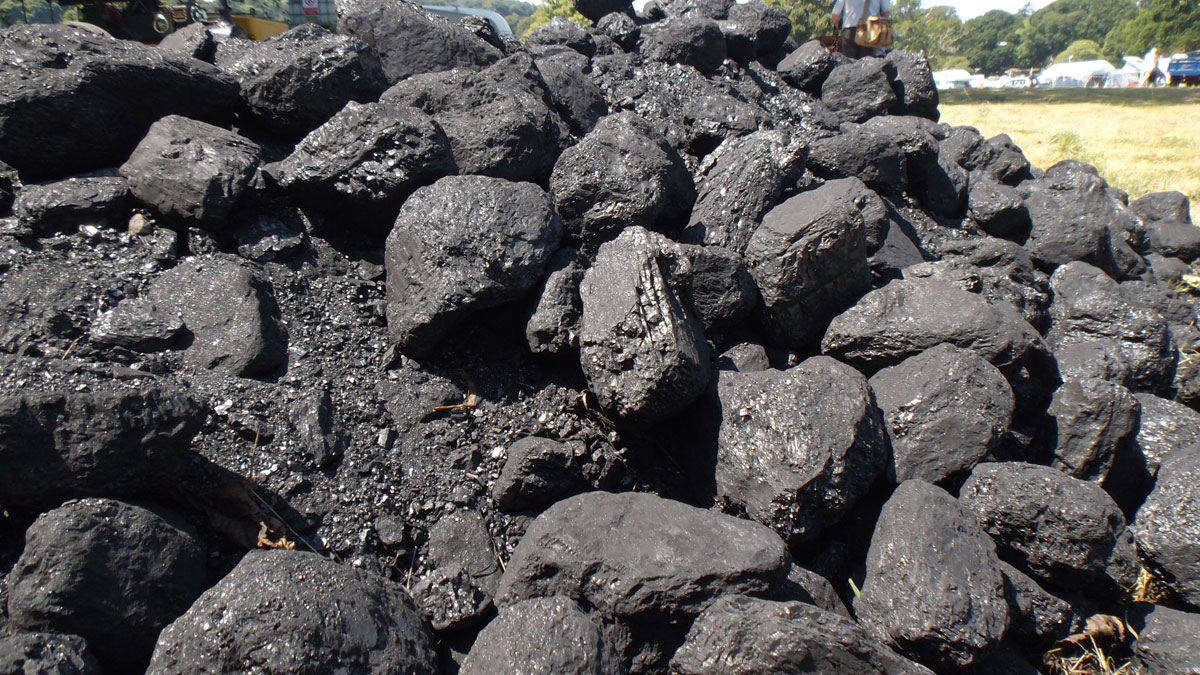
Piles Of Coal. Image source: Flickr Image.
Coal may be dying due to the pollution that it is causing and the shift of the world’s energy usage toward renewable energy.
But coal stocks are definitely not dying and are coming back, and probably at a much stronger cycle than the prior one.
Look at the stock price of Peabody Energy (NYSE:BTU), one of the biggest coal miners in the U.S. in the snapshot below.
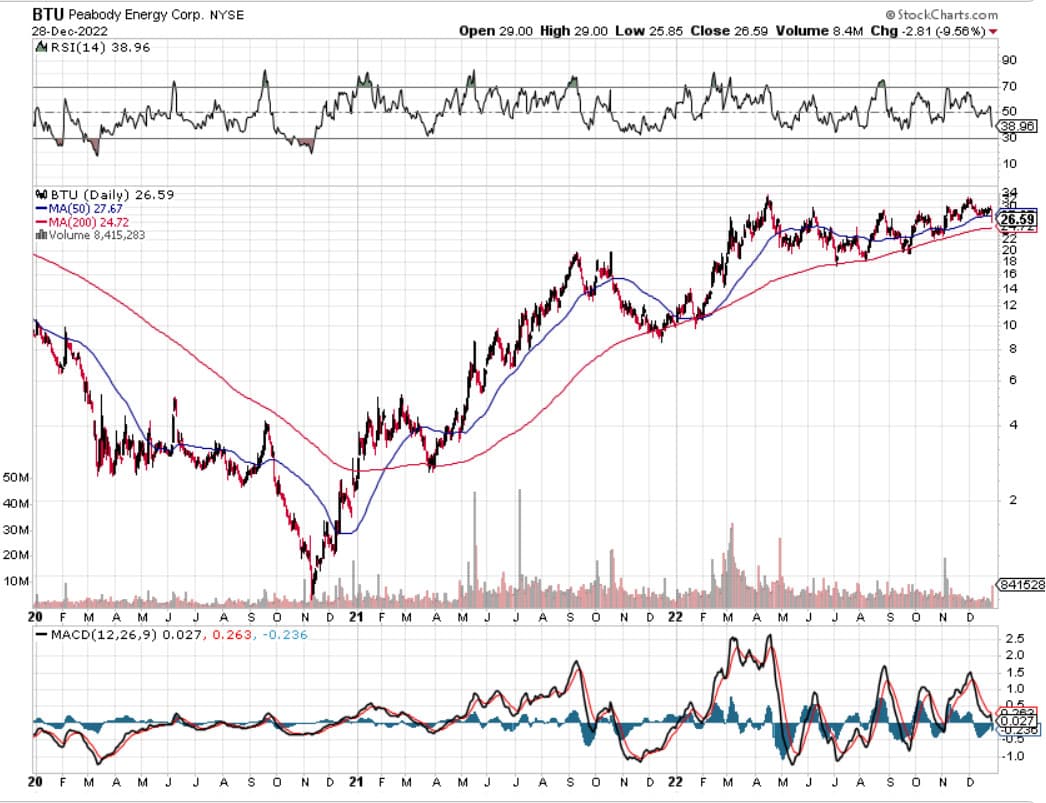
BTU historical stock price. Source: StockCharts.com
It has been shooting through the roof lately and reached as much as $27 USD per share as of Dec 2022.
As of Dec 2022, BTU is a $4 billion company, making it the largest coal miner in the U.S. by market capitalization.
Since 2021, BTU has rallied by nearly 10,000%, going from a penny stock to $27 USD per share in Dec 2022.
BTU’s stock rally in the last 3 years has put some of the growth stocks such as Tesla and NVIDIA to shame.
Prior to 2021, Peabody was nearly on the brink of bankruptcy.
After 3 years, the company has not only survived but is thriving.
So what has been going on?
In this article, we are going to examine Peabody Energy’s coal sales volumes and the 2023 outlook provided by the company.
Let’s start with the following topics.
Peabody Coal Sales Volumes Topics
Results Overview
00. Results Overview
Consolidated Results
A1. Global Coal Sales Volumes By Year
A2. Global Coal Sales Volumes By TTM
U.S. Results
B1. Total U.S. Thermal Coal Sales Volumes By Year
B2. Total U.S. Thermal Coal Sales Volumes By TTM
Breakdown Of U.S. Results
C1. Powder River Basin And Other U.S. Results By Year
C2. Powder River Basin And Other U.S. Results By TTM
Overseas Results
D1. Seaborne Coal Sales Volumes By Year
D2. Seaborne Coal Sales Volumes By TTM
Results By Percentages
E1. Percentages Of Global Coal Sales Volume
E2. Percentages Of U.S. Coal Sales Volume
Conclusion And Reference
S1. Conclusion
S2. References and Credits
S3. Disclosure
Peabody’s Coal Shipment Overview
For your information, Peabody’s coal shipment volumes are divided into the U.S. and seaborne segments.
Seaborne coal means that the coal is mined and shipped outside of the United States to countries that need to import energy.
Apart from the sales breakdown by region or by country, BTU’s coal sales are also divided by category or by coal type.
In this case, Peabody mines and ships 2 types of coal, namely thermal and metallurgical coal.
Thermal coal is used primarily for power generation and therefore is sold to utility companies.
In contrast, metallurgical coal or coking coal is used for steelmaking and therefore is sold primarily to steelmaking companies.
That said, let’s proceed to look at the coal sales numbers.
Peabody Global Coal Sales Volumes By Year
Peabody global coal sales volumes by year
(click image to enlarge)
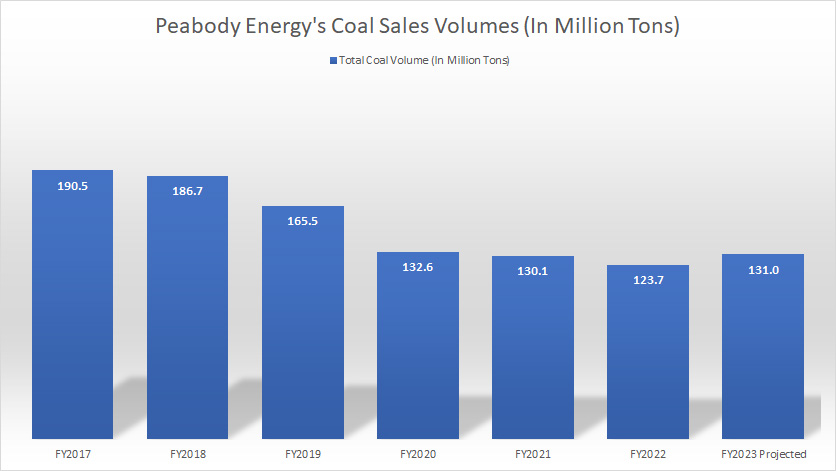
On a consolidated basis, Peabody’s global coal sales volume reached a record low of 124 million tons in fiscal 2022, down roughly 5% over 2021.
For fiscal 2023, Peabody’s global coal sales volume is projected to go significantly higher to 131 million tons based on the guidance provided by the company.
Since 2017, Peabody’s coal sales volumes on a worldwide basis have gone lower considerably, down 35% between 2017 and 2022 or roughly 7% on average per year.
The decline was the most significant in fiscal 2020 when the company shipped only 133 million tons of coal compared to 166 million tons recorded in the prior year, down by a massive 19% year-over-year.
Peabody’s poor coal shipment volume in 2020 was most likely driven by the COVID-19 lockdown which occurred around the world since the beginning of the pandemic.
Peabody Global Coal Sales Volumes By TTM
Peabody global coal sales volumes by ttm
(click image to enlarge)
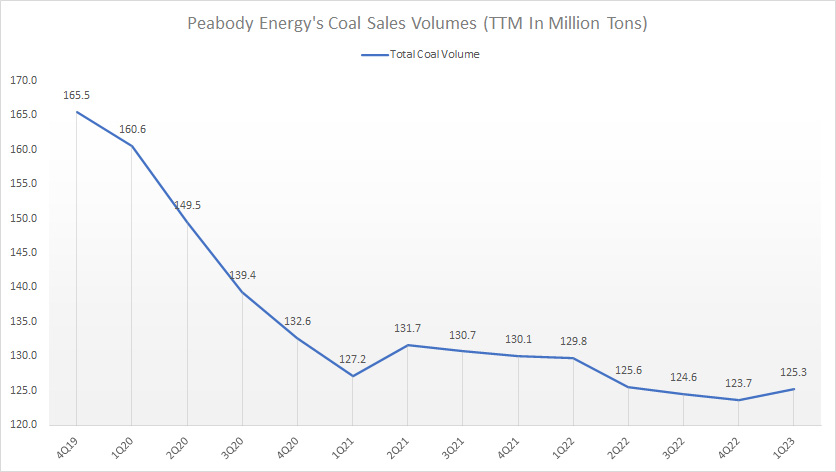
The TTM plot above shows that Peabody’s coal sales volumes on a global basis have indeed been on a decline and reached a record low of only 125 million tons as of 1Q 2023.
The decline was particularly severe during the onset of the COVID-19 pandemic which occurred in 2020 when the whole world was in lockdown.
However, Peabody’s global coal shipment volumes not only did not recover but continued to slump in the post-pandemic periods despite the lifting of restrictions in most parts of the world.
As seen, Peabody’s coal sales volumes recorded after fiscal 2021 had remained roughly the same and were significantly lower than the results reported prior to the pandemic.
Peabody’s U.S. Thermal Coal Sales Volumes By Year
Peabody U.S. thermal coal sales volumes by year
(click image to enlarge)
Of all the coal that Peabody has shipped, the largest volume actually comes from the U.S. in the Powder River Basin located between Montana and Wyoming.
The majority of the coal extracted from the Powder River Basin region is of the thermal type which is usually used for electricity generation.
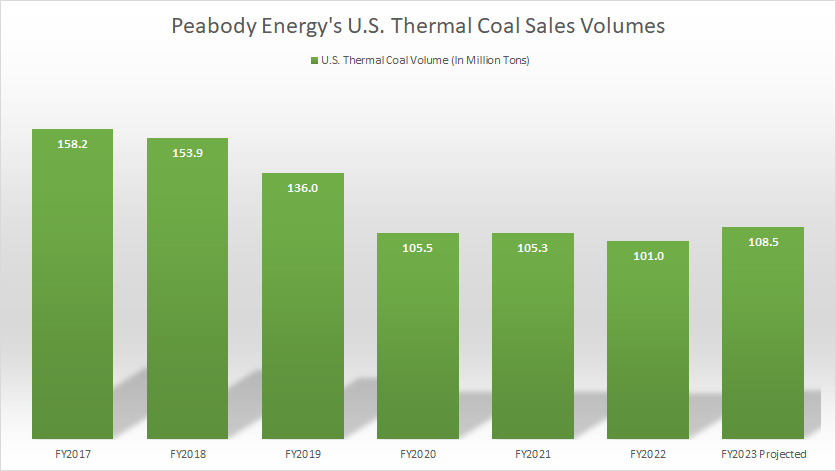
Granted, Peabody’s U.S. thermal coal sales volume reached 101 million tons as of fiscal 2022, down 4% over 2021, and was at a record low over the past 6 years.
While Peabody’s U.S. thermal coal had been on a decline, it is projected to go higher to 108.5 million tons by the end of fiscal 2023, according to the company.
Nevertheless, Peabody’s U.S. thermal coal shipment volumes have been on a decline and the rate of decline was the most during fiscal 2020, down more than 20% in that year alone over 2019, driven primarily by lower thermal coal consumption as the world was in lockdown in 2020 and the transitions toward renewable energy in post-pandemic periods.
If the projected figure in fiscal 2023 holds true, Peabody’s U.S. thermal coal sales may have reached a bottom in 2022 and is on the verge of a turnaround going forward.
Peabody’s U.S. Thermal Coal Sales Volumes By TTM
Peabody U.S. thermal coal sales volumes by ttm
(click image to enlarge)
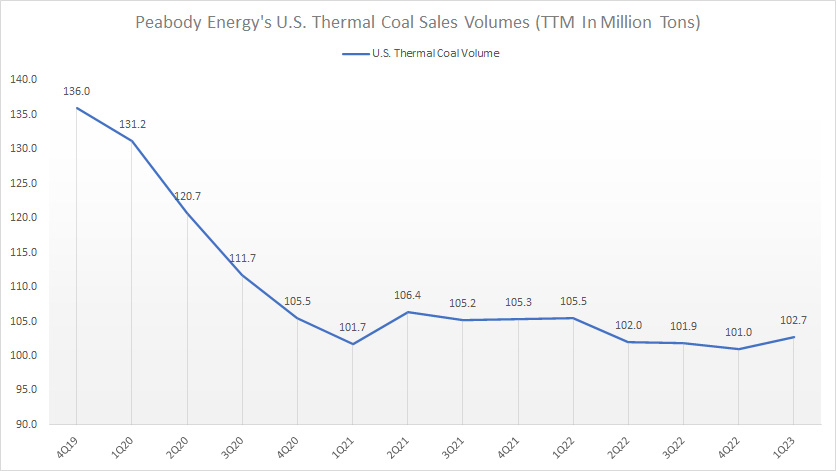
The TTM plot above clearly demonstrates the decline of Peabody’s U.S. thermal coal shipment volume since 2019.
While U.S. thermal coal shipment volume has gone down significantly in 2020, it has not been the case after 2021.
As seen, the sales volumes have been roughly flat on a TTM basis since 2021, illustrating that a bottom may have already been reached.
As of Q1 2023, Peabody sold 103 million tons of thermal coal in the U.S., down 3% over the same quarter a year ago.
Peabody’s Powder River Basin And Other U.S. Results By Year
Peabody Powder River Basin thermal coal sales volumes by year
(click image to enlarge)
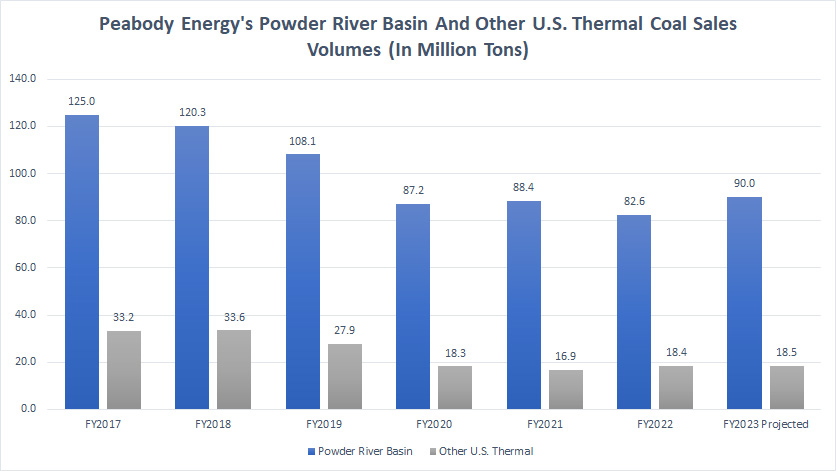
As mentioned, Peabody’s U.S. coal volumes come primarily from the Powder River Basin mining operation in which thermal coals are being mined.
Peabody’s other U.S. coal mining operations include locations in the Midwestern and Western U.S.
However, these other U.S. mining operations represent only a small part of Peabody’s U.S. coal sales volumes as shown in the chart above.
As of 2022, Peabody shipped only 82.6 million tons of thermal coal from the Powder River Basin mining operation while other U.S. mining operations delivered 18.4 million tons of thermal coal.
Therefore, Peabody’s coal sales volumes from the Powder River Basin alone were more than 4X higher than the rest of the locations in the U.S.
Moreover, Peabody is expected to deliver significantly higher thermal coal sales volumes in fiscal 2023, notably at 90 million tons and 18.5 million tons from Powder River Basin and other U.S. mining operations, respectively, according to the guidance provided by Peabody in its 1Q 2023 earning report.
Peabody’s Powder River Basin And Other U.S. Results By TTM
Peabody Powder River Basin thermal coal sales volumes by ttm
(click image to enlarge)
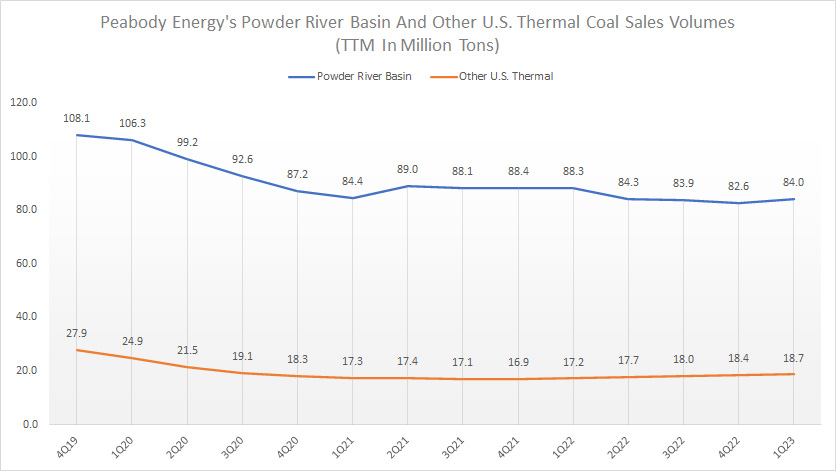
The TTM plots in the chart above clearly show the declining trend of Peabody’s coal sales volumes in the U.S.
For example, Peabody shipped only 84 million tons of thermal coal from the Powder River Basin as of Q1 2023, one of the new lows that the company has ever reported.
On the other hand, Peabody’s coal shipments from other U.S. mining operations have slowly recovered and reached 18.7 million tons as of 2023 Q1, a significantly higher figure compared to the bottom recorded back in 2021.
Peabody’s Seaborne Coal Sales Volumes By Year
Peabody seaborne coal sales volumes by year
(click image to enlarge)
Peabody’s seaborne coal sales volumes come from overseas mining operations such as those operating in Australia.
For your information, Peabody’s largest overseas mining operation is located in Wilpinjong, New South Wales, Australia, an area of the size of 5,500 football fields.
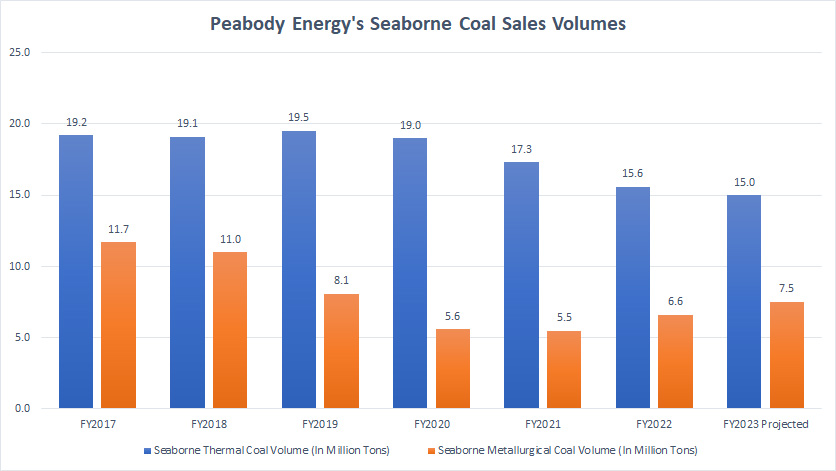
According to the chart above, Peabody’s seaborne mining operations are divided into 2 segments, namely thermal and metallurgical.
Metallurgical coal is used for steelmaking and therefore, is primarily sold to steel-making companies whereas thermal coal is sold primarily to utility companies for electricity generation purposes.
That said, according to the chart, Peabody’s seaborne thermal coal sales volumes have significantly declined over the years while that of metallurgical coal has recovered in 2022 and may be heading for a turnaround going forward, based on the guidance provided for 2023.
As of fiscal 2022, Peabody shipped 15.6 million tons of seaborne thermal coal while metallurgical coal sales volume grew to 6.6 million tons in the same year.
Going forward, Peabody guided for lower seaborne thermal coal shipment volumes which is expected to come in at 15 million tons for fiscal 2023.
On the other hand, Peabody’s seaborne metallurgical coal shipment volumes may further grow to 7.5 million tons in fiscal 2023.
Therefore, Peabody’s seaborne metallurgical coal sales may have bottomed in 2021 and are headed higher going forward.
In short, Peabody is likely to ship less seaborne thermal coal while seaborne metallurgical coal may trend higher.
Peabody’s Seaborne Coal Sales Volumes By TTM
Peabody seaborne coal sales volumes by ttm
(click image to enlarge)
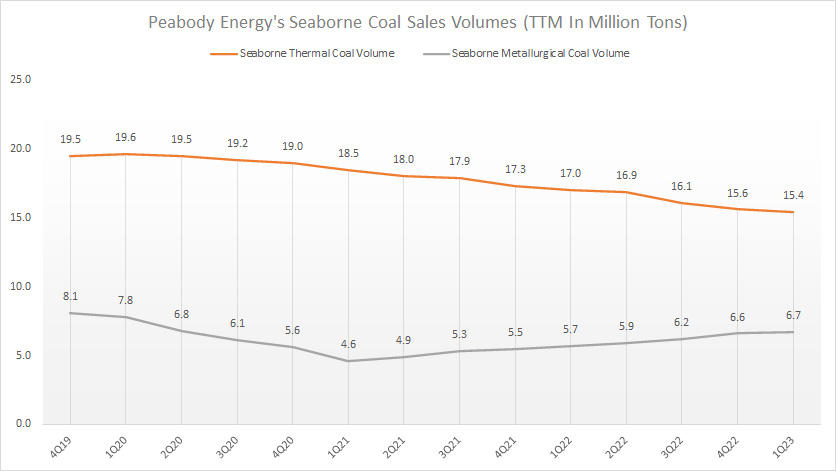
The TTM plots clearly show that Peabody’s seaborne thermal coal sales are on a downtrend while seaborne metallurgical coal sales have significantly recovered after reaching the bottom in fiscal 2021.
As of 1Q 2023, Peabody shipped 15.4 million tons of seaborne thermal coal, a record low since 2019.
On the other hand, Peabody’s seaborne metallurgical coal sales volume has grown to 6.7 million tons as of Q1 2023 on a TTM basis, a record high since 2021.
Peabody’s Percentages Of Global Coal Sales Volume
Peabody percentage of global coal sales volumes
(click image to enlarge)
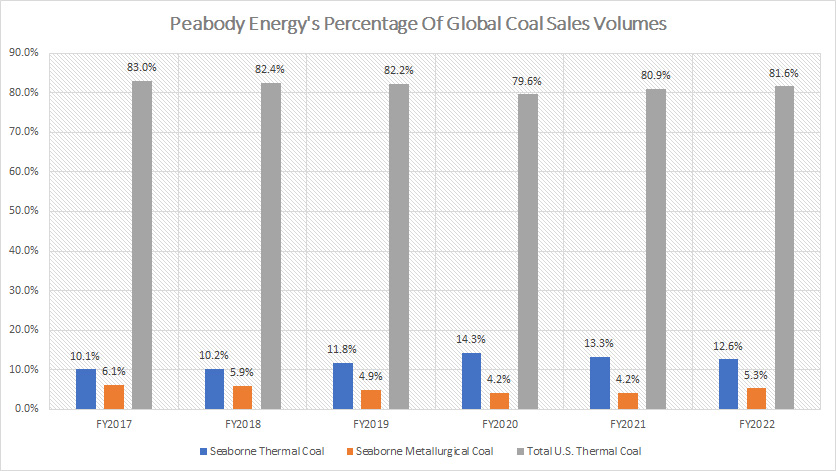
From the perspective of percentage, Peabody’s U.S. thermal coal takes the lion’s share of the total sales volume, notably at 81.6% recorded in 2022.
Peabody’s seaborne thermal coal comes in second at 12.6% of total sales volume as of 2022 while that of seaborne metallurgical coal totals 5.3% in the same year, the lowest among all regions.
Peabody’s overseas coal sales account for only 18% of the company’s total volume in 2022, a far cry from the U.S. thermal coal which forms more than 80% of the company’s total sales volume.
A trend worth mentioning is that the percentages have remained roughly the same over the years despite major changes we saw in sales volume.
The only exception to this is Peabody’s seaborne thermal coal sales whose percentages have slightly increased over the years.
Peabody’s Percentages Of U.S. Coal Sales Volume
Peabody percentage of U.S. coal sales volumes
(click image to enlarge)
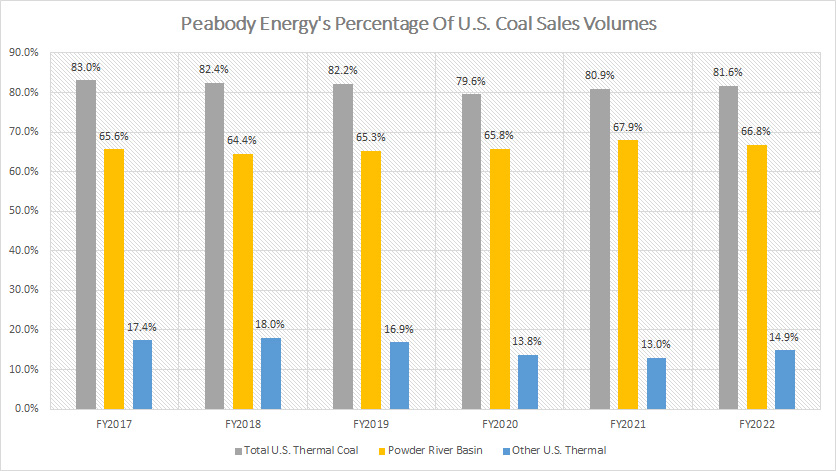
For U.S. coal sales volume, Peabody’s Powder River Basin contributes the lion’s share to the total volume, at 67% out of the total 81.6% as of 2022.
The remaining percentages are contributed by other U.S. mining operations located primarily in the Western and Midwestern regions of the USA.
The ratios for Powder River Basin have grown slightly higher while that of other U.S. regions have declined.
Conclusion
In short, Peabody’s U.S. and seaborne thermal coal shipment volumes have been on a decline while its metallurgical coal shipment volume has risen significantly in recent years.
Despite the rise of metallurgical coal sales volume, it made up only 5.3% of Peabody’s total shipment volumes as of 2022, a seemingly low figure compared to thermal coal.
On the other hand, Peabody’s U.S. and seaborne thermal coal shipments account for more than 90% of the company’s total sales volume.
However, Peabody’s thermal coal sales volume seems to have remained low even in post-pandemic periods, illustrating that the demand for thermal coal may have reached a plateau.
References and Credits
1. All financial figures in this article were obtained and referenced from Peabody’s earnings reports, SEC filings, and other statements which are available in Peabody Investor Center.
2. Featured images in this article are used under creative commons license and sourced from the following websites: burning coals and Piles of Coal.
Disclosure
References and examples such as tables, charts, and diagrams are constantly reviewed to avoid errors, but we cannot warrant the full correctness of all content.
The content in this article is for informational purposes only and is neither a recommendation nor a piece of financial advice to purchase a stock.
If you find the information in this article helpful, please consider sharing it on social media and also provide a link back to this article from any website so that more articles like this one can be created in the future.
Thank you!

