Farming. Pexels Image.
This article presents the tractor sale statistics of Mahindra & Mahindra Limited or M&M Limited.
Mahindra & Mahindra Limited is a major Indian multinational conglomerate headquartered in Mumbai, Maharashtra. It is one of the largest vehicle manufacturers by production in India and the largest manufacturer of tractors worldwide.
The company is part of the larger Mahindra Group, a conglomerate with diverse interests in agribusiness, aerospace, construction equipment, defence, energy, finance, hospitality, information technology, leisure and hospitality, real estate, and retail.
In addition to its dominance in the automotive and farm equipment sectors, Mahindra & Mahindra has expanded its footprint globally through acquisitions and partnerships. It owns several international companies, including SsangYong Motor Company in South Korea and Peugeot Motorcycles in France, and has a stake in Mitsubishi Agricultural Machinery in Japan.
That said, investors interested in Mahindra’s vehicle sales numbers and market share may find more information on these pages – Mahindra vehicle sales and Mahindra market share.
Please use the table of contents to navigate this page.
Table Of Contents
Definitions And Overview
Total Tractor Sales
B1. Tractor Sales By Fiscal Year
B2. YoY Growth Rates Of Tractor Sales
Tractor Sales By Market Type
C1. Domestic And Export Tractor Sales
C2. Domestic And Export Tractor Sales In Percentage
Conclusion And Reference
S1. Conclusion
S2. References and Credits
S3. Disclosure
Definitions
To help readers understand the content better, the following terms and glossaries have been provided.
Farm Equipment Sector: Mahindra’s farm equipment sector primarily focuses on manufacturing and marketing a comprehensive range of agricultural machinery and services.
This segment produces a wide variety of tractors, which are among the most recognized products in this sector, as well as implements, attachments, and other related farming equipment. Mahindra is globally renowned for being the largest manufacturer of tractors by volume, with a reputation for ruggedness and reliability.
Their product range caters to various agricultural needs, from basic tilling and ploughing to more complex farming operations. The company’s innovations in this sector often revolve around technology that aims to improve productivity, efficiency, and sustainability in farming.
They also offer support and services to farmers, including financing options, to help improve agricultural practices and outcomes. Mahindra’s commitment to the farm equipment sector is part of its broader mission to drive positive change in the lives of farmers and contribute to the agricultural development of the communities it serves.
Tractor Sales Overview
Mahindra’s farm equipment sector
(click image to expand)
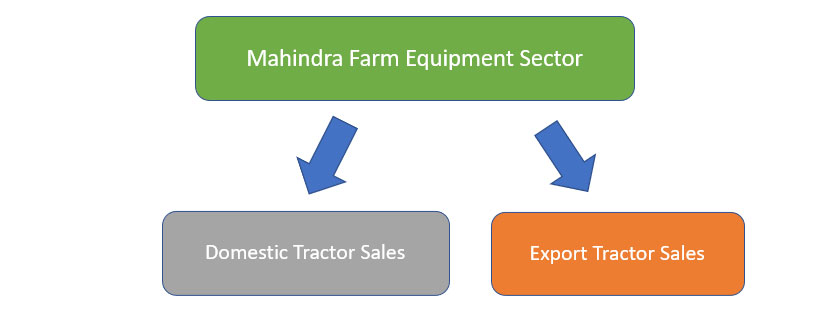
There are only 2 categories under the farm equipment segment and they are domestic and export sales.
Well-known tractor brand names under the domestic category include Mahindra, Swaraj, and Trakstar.
Additionally, Mahindra ships some of its tractors internationally through brand names such as Mahindra, Mitsubishi, and Erkunt.
Tractor Sales By Fiscal Year
mahindra-tractor-sales-by-year
(click image to expand)
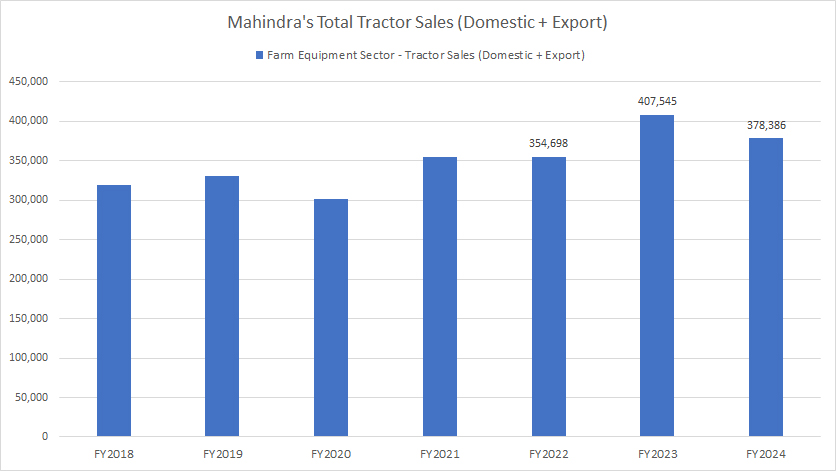
Mahindra’s sales of farming tractors have been steadily on the rise over the years, as shown in the chart above.
As of fiscal 2024, Mahindra’s tractor sales topped 378,400 units, down slightly from 407,500 units reported in fiscal year 2023 but was up 7% over fiscal year 2022.
Mahindra’s growing sales of tractors have not been majorly impacted by any obstacles or disruptions, including the COVID-19 pandemic, the ongoing war in Ukraine, as well as the high inflationary environment triggered by materials shortages.
After all, people still need to eat no matter what happens, be it COVID outbreak or materials crisis.
Therefore, the demand for tractors will always be there, especially for India where the agriculture sector is one of the most primary sectors.
YoY Growth Rates Of Tractor Sales
mahindra-growth-rates-of-tractor-sales
(click image to expand)
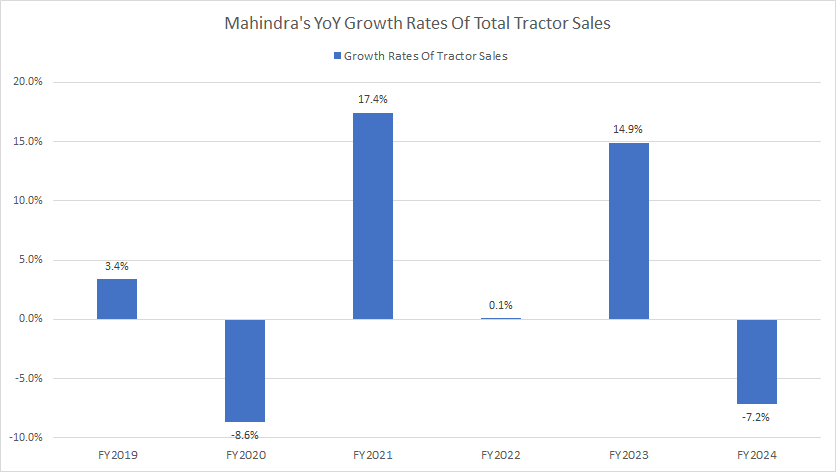
Mahindra’s growth in tractor sales is the most apparent between fiscal 2021 and 2022, with figures reaching nearly double digits on average.
However, tractor sales growth stalled in fiscal year 2024 as growth rate was reported at -7.2%.
On average, Mahindra’s tractor sales have managed to grow by 2.6% between fiscal year 2022 and 2024.
Domestic And Export Tractor Sales
mahindra-domestic-and-export-tractor-sales
(click image to expand)
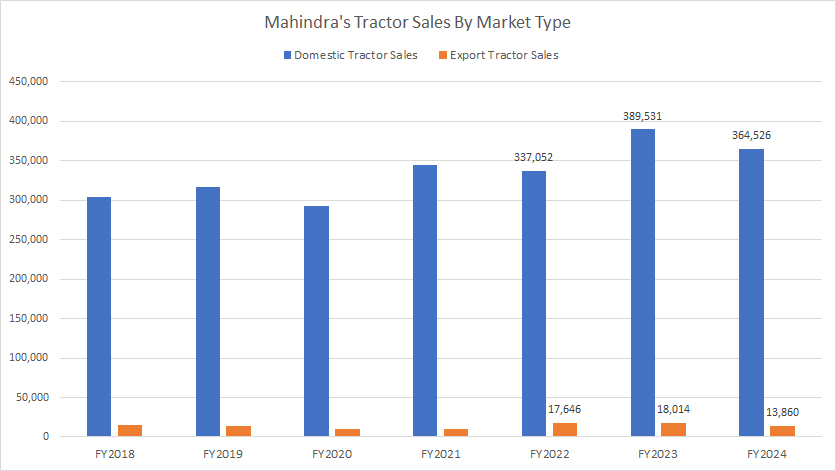
Mahindra sells most of its tractors in the domestic market of India and exports only a handful to overseas markets.
As seen in the plot above, Mahindra’s sales of tractors in the domestic market totaled 364,500 units in fiscal 2024 compared to only 13,800 units for the export market in the same period.
The domestic tractor sales of 364,500 units in fiscal 2024 represents a decrease of 6% over the result in fiscal year 2023, while export sales were down by more than 20% year-over-year in the same period.
A significant trend is that tractors sold domestically have been on the rise while those for export have remained roughly flat over the years.
As the domestic shipment makes up the bulk of the sales, Mahindra should rely on the Indian market for growth and put its focus on the domestic market.
Domestic And Export Tractor Sales In Percentage
mahindra-domestic-and-export-tractor-sales-in-percentage
(click image to expand)
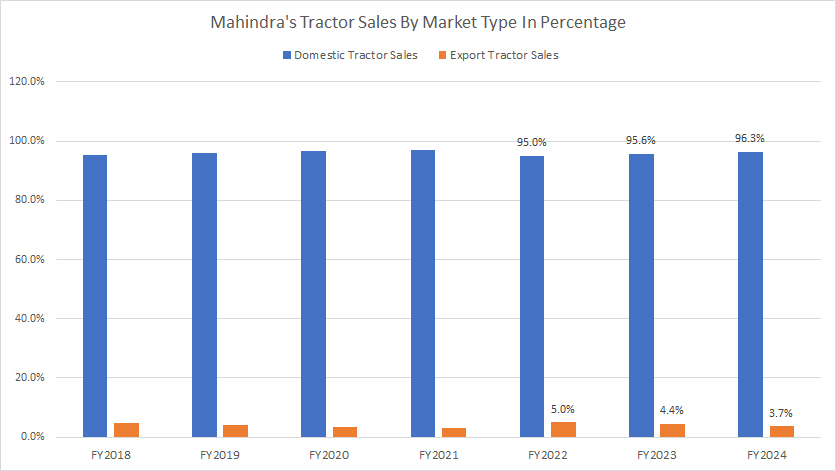
From the perspective of percentages, Mahindra’s domestic tractor shipments have consistently represented 95% of its total tractor volume in all fiscal years.
As of fiscal 2024, the ratio clocked 96% compared to 4% for export shipments.
Again, Mahindra sells the bulk of its farming tractors in India while only exporting a low percentage overseas.
Conclusion
Mahindra’s tractor sales in fiscal 2024 tumbled to 378,400 units, down 7% year-over-year. Mahindra’s domestic tractor sales were slightly lower, down by more than 20,000 units or 6% year-over-yaer. The export sales declined the most, lower by more than 20% year-over-year.
Despite the decline, Mahindra’s domestic tractor sales still represented the majority of the company’s total tractor volume, at 96% in fiscal year 2024.
Credits And References
1. All financial data presented in this article was obtained and referenced from Mahindra’s earnings releases, annual reports, investors letters, presentations, news releases, etc., which are available in M&M’s Investor Relation.
2. Pexels Images.
Disclosure
References and examples such as tables, charts, and diagrams are constantly reviewed to avoid errors, but we cannot warrant the full correctness of all content.
The content in this article is for informational purposes only and is neither a recommendation nor a piece of financial advice to purchase a stock.
If you find the information in this article helpful, please consider sharing it on social media and also provide a link back to this article from any website so that more articles like this one can be created in the future.
Thank you!


