Ford Mustang. Pixabay Image.
This article presents the revenue per car of Ford Motor Company (NYSE: F).
Apart from having the consolidated results, we also explore Ford Motor’s revenue per car by region.
The regions that will be discussed include North America, South America, Europe, China, the Middle East, Africa, Asia Pacific, etc.
Let’s look at more details starting with the table of contents below.
Table Of Contents
Consolidated Results
A1. Revenue Per Car
Results For America
B1. Revenue Per Car – North America
B2. Revenue Per Car – South America
Results For Europe
Results For The Middle East & Africa
Results For Asia
E1. Revenue Per Car – China
E2. Revenue Per Car – Asia Pacific
Results For Other Regions
Conclusion And Reference
S1. Conclusion
S2. References and Credits
S3. Disclosure
Revenue Per Car
Ford-Motor-revenue-per-car
(click image to expand)
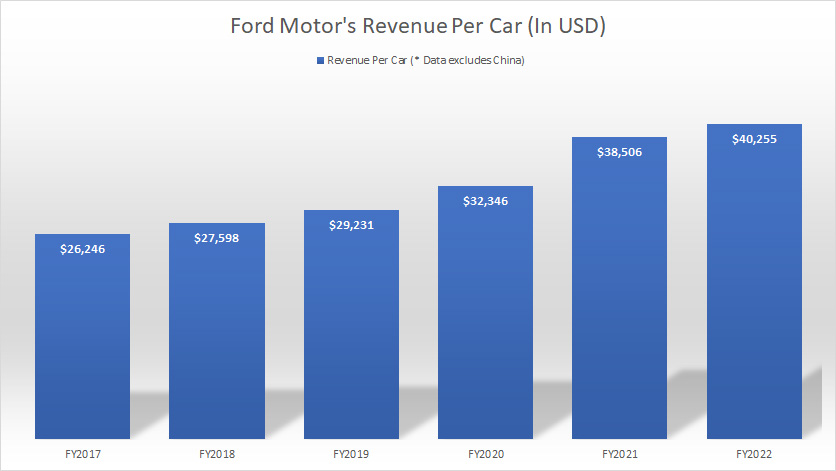
Ford’s revenue per car is calculated as the amount of automotive revenue divided by vehicle wholesale excluding unconsolidated affiliates.
Keep in mind that the results presented here exclude data from China but include data from the rest of the regions.
On a consolidated basis, Ford’s revenue per vehicle totaled as much as $40,000 as of fiscal 2022, a record high and a rise of 4.5% over 2021.
Since fiscal 2017, Ford’s revenue per car has dramatically risen. Ford earned only $26,000 per vehicle in fiscal 2017, but this figure has grown more than 50% over a period of 5 years.
Revenue Per Car – North America
Ford-Motor-revenue-per-car-North-America
(click image to expand)
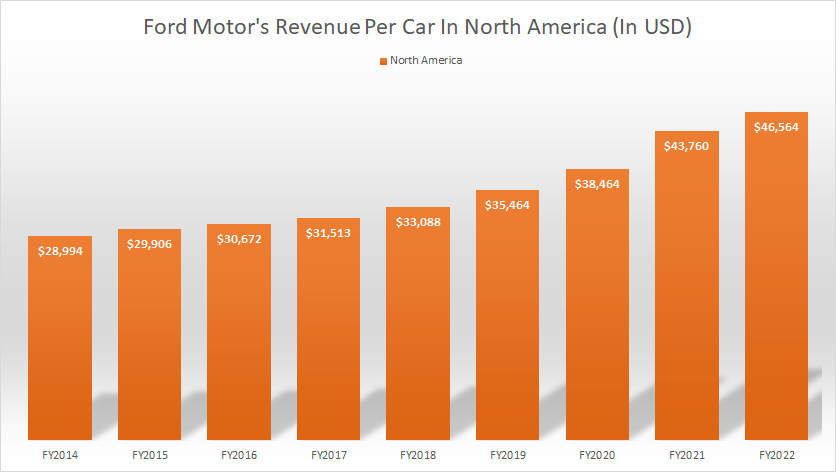
Ford’s revenue per car in North America is calculated as the amount of North America automotive revenue divided by North America vehicle wholesale excluding unconsolidated affiliates.
Ford earned roughly $46,600 per car in North America as of fiscal 2022, up 6% over 2021. This figure is much higher than the consolidated result we saw in prior discussions and is probably the highest among all regions in Ford’s market.
Similar to the consolidated number, Ford’s revenue per car in North America has dramatically risen.
Since fiscal 2014, Ford’s revenue per vehicle in North America has grown by more than 60% before reaching a record number in fiscal 2022.
Revenue Per Car – South America
Ford-Motor-revenue-per-car-South-America
(click image to expand)
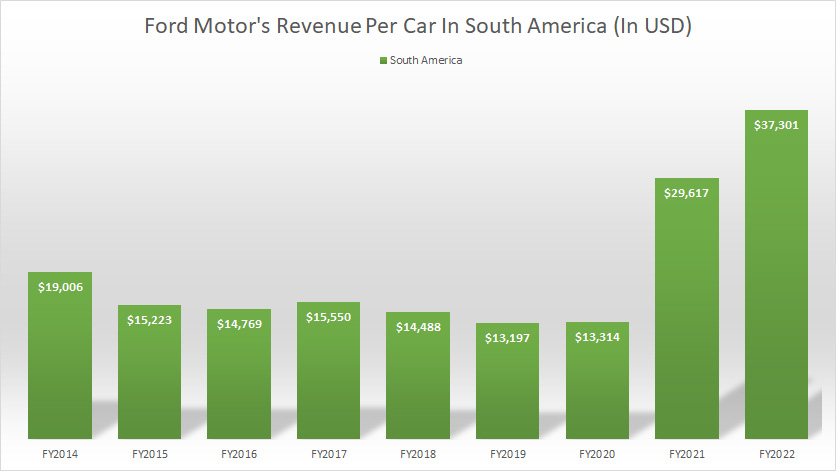
Ford’s revenue per car in South America is calculated as the amount of South America automotive revenue divided by South America vehicle wholesale excluding unconsolidated affiliates.
Ford’s revenue per car in South America has swung quite dramatically. For example, the revenue per vehicle in fiscal 2022 in South America totaled $37,300, a dramatic rise over that in fiscal 2021 and nearly tripled the figure in 2020.
Ford’s revenue per car in South America certainly has grown significantly in post-pandemic periods or the age of the EV.
Revenue Per Car – Europe
Ford-Motor-revenue-per-car-Europe
(click image to expand)
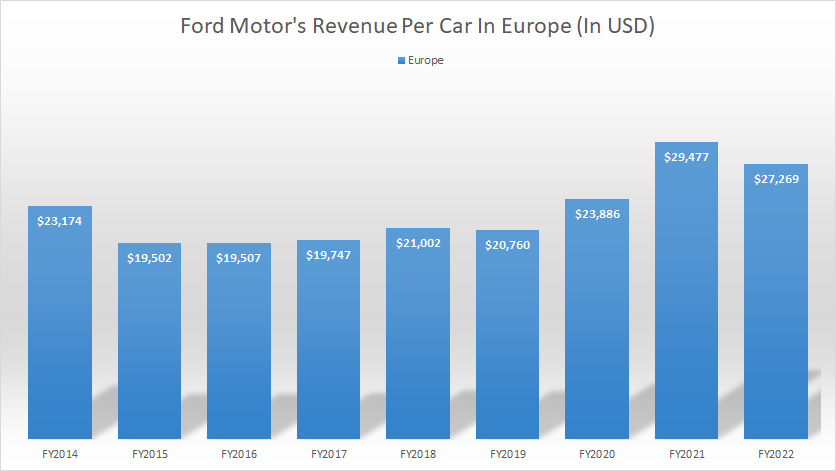
Ford’s revenue per car in Europe is calculated as the amount of Europe automotive revenue divided by Europe vehicle wholesale excluding unconsolidated affiliates.
Ford earned revenue of about $27,300 per vehicle sold in Europe in fiscal 2022, a decline of 7% over 2021 and one of the lowest among all regions in comparison.
Compared to America, the swing in Ford’s revenue per car in Europe has not been that dramatic.
Still, the figure is a rise over the long term.
Revenue Per Car – MEA
Ford-Motor-revenue-per-car-Middle-East-and-Africa
(click image to expand)
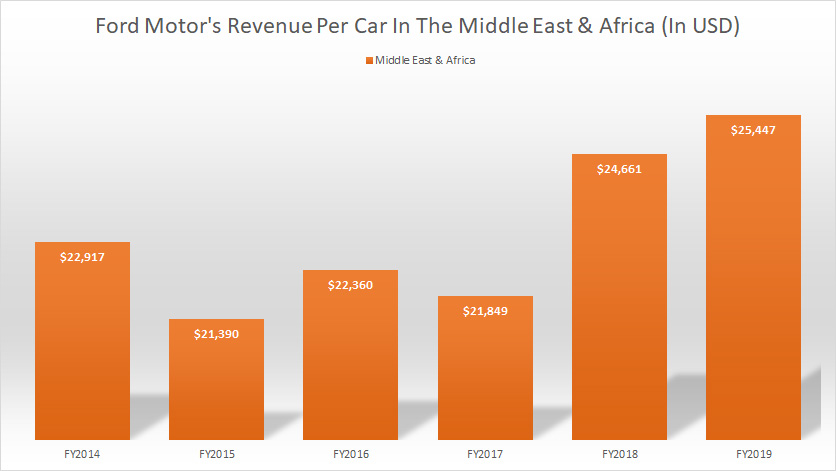
Ford’s revenue per car in the Middle East & Africa (MEA) is calculated as the amount of MEA automotive revenue divided by MEA vehicle wholesale excluding unconsolidated affiliates.
The data from the MEA region is only available up to fiscal 2019 because Ford has stopped publishing the data in this region after 2019.
That said, Ford Motor’s revenue per car in the Middle East and Africa regions topped $25,000 in fiscal 2019, up slightly from 2018.
Between 2014 and 2019, Ford’s revenue per car had increased by 11% in the Middle East and Africa regions.
Revenue Per Car – China
Ford-Motor-revenue-per-car-China
(click image to expand)
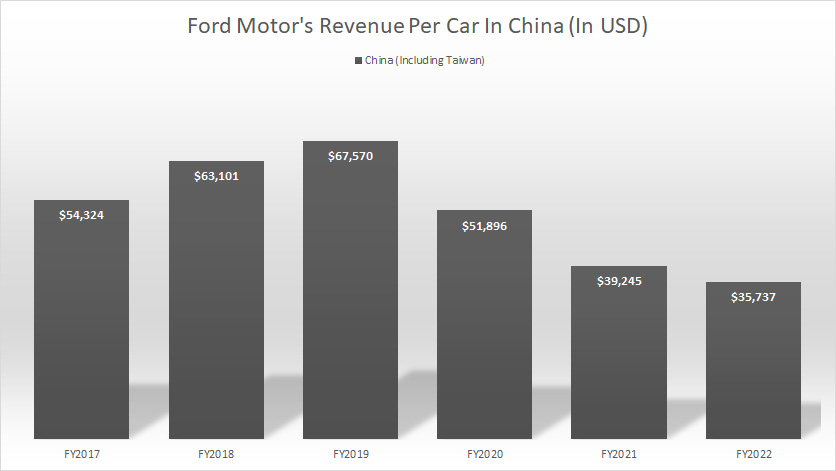
Ford’s revenue per car in China is calculated as the amount of China automotive revenue divided by China vehicle wholesale excluding unconsolidated affiliates.
The number of vehicle wholesale from unconsolidated affiliates in China is estimated at 90% of the total vehicle wholesale in this country.
That said, Ford’s revenue per car in China is probably the only region that sees a decline.
As of fiscal 2022, Ford earned revenue per car of $35,700 in China compared to $39,200 in fiscal 2021, down roughly 9% year-over-year.
Ford’s revenue per vehicle in China hit $67,500 in fiscal 2019, the highest figure ever measured since 2017.
Between 2017 and 2022, Ford’s revenue per car in China declined by 34% and is probably the only country that sees a decline in revenue per vehicle.
Revenue Per Car – Asia Pacific
Ford-Motor-revenue-per-car-Asia-Pacific
(click image to expand)
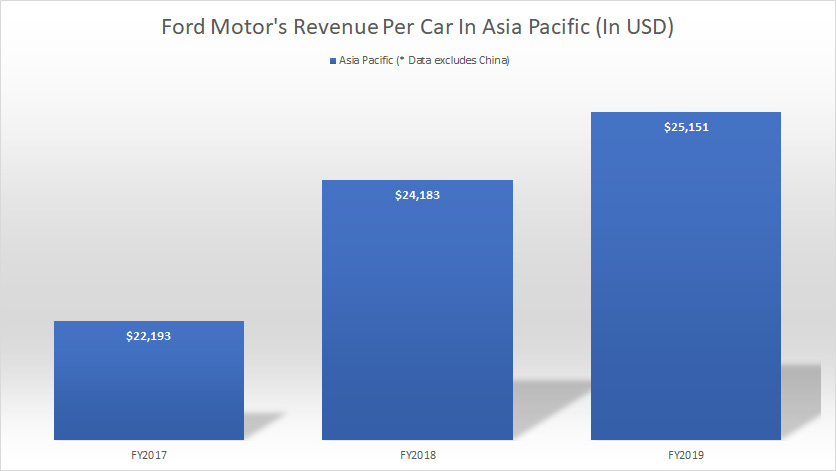
Ford’s revenue per car in Asia Pacific is calculated as the amount of Asia Pacific automotive revenue divided by Asia Pacific vehicle wholesale excluding unconsolidated affiliates.
The revenue per car data for the Asia Pacific region is up to only fiscal 2019 because Ford has stopped breaking up the data after 2019.
All said, Ford managed to earn revenue per car of $25,000 in fiscal 2019, up slightly from 2018.
The Asia Pacific revenue per car also increased from $22,000 in 2017 to $25,000 in 2019.
Nevertheless, Ford’s revenue per car in the Asia Pacific, excluding China, is one of the lowest among all regions in comparison.
Revenue Per Car – IMG
Ford-Motor-revenue-per-car-IMG
(click image to expand)
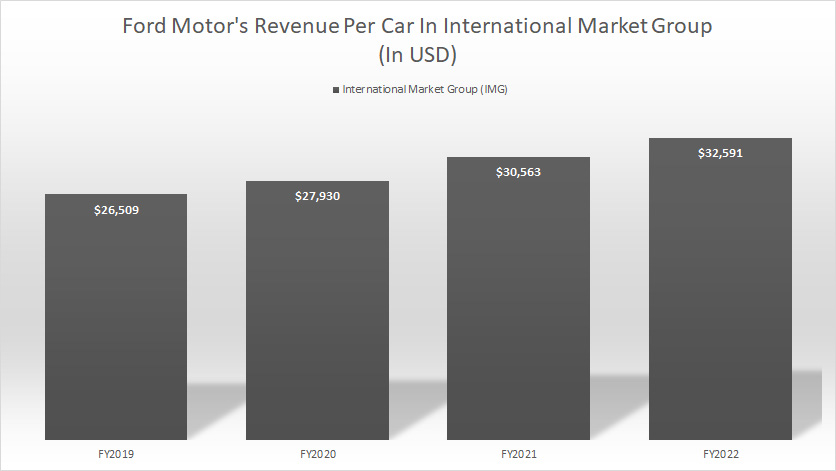
Ford’s revenue per car in the International Market Group (IMG) is calculated as the amount of IMG automotive revenue divided by IMG vehicle wholesale excluding unconsolidated affiliates.
The IMG covers all regions or countries not presented separately.
Ford earned roughly $32,600 in revenue per car within the IMG in fiscal 2022, up 7% from 2021.
Conclusion
Ford earned the lowest revenue per car in the Middle East and the Asia Pacific, but that was in 2019.
Ford had the highest revenue per car in North America among all regions in Ford’s market.
Ford’s revenue per car rises in most regions except China.
Ford’s rising revenue per car can be attributed to a couple of reasons, one of which is inflation.
The other reason for Ford’s rising revenue per car can be due to the sales of more advanced and bigger vehicles such as trucks and SUVs.
References and Credits
1. All financial figures presented in this article were obtained and referenced from Ford’s SEC filings, earning releases, quarterly and annual reports, investor presentations, etc., which are available in the following location: Ford shareholders page.
2. Pixabay Images.
Disclosure
References and examples such as tables, charts, and diagrams are constantly reviewed to avoid errors, but we cannot warrant the full correctness of all content.
The content in this article is for informational purposes only and is neither a recommendation nor a piece of financial advice to purchase a stock.
If you find the information in this article helpful, please consider sharing it on social media and also provide a link back to this article from any website so that more articles like this one can be created in the future.
Thank you!

