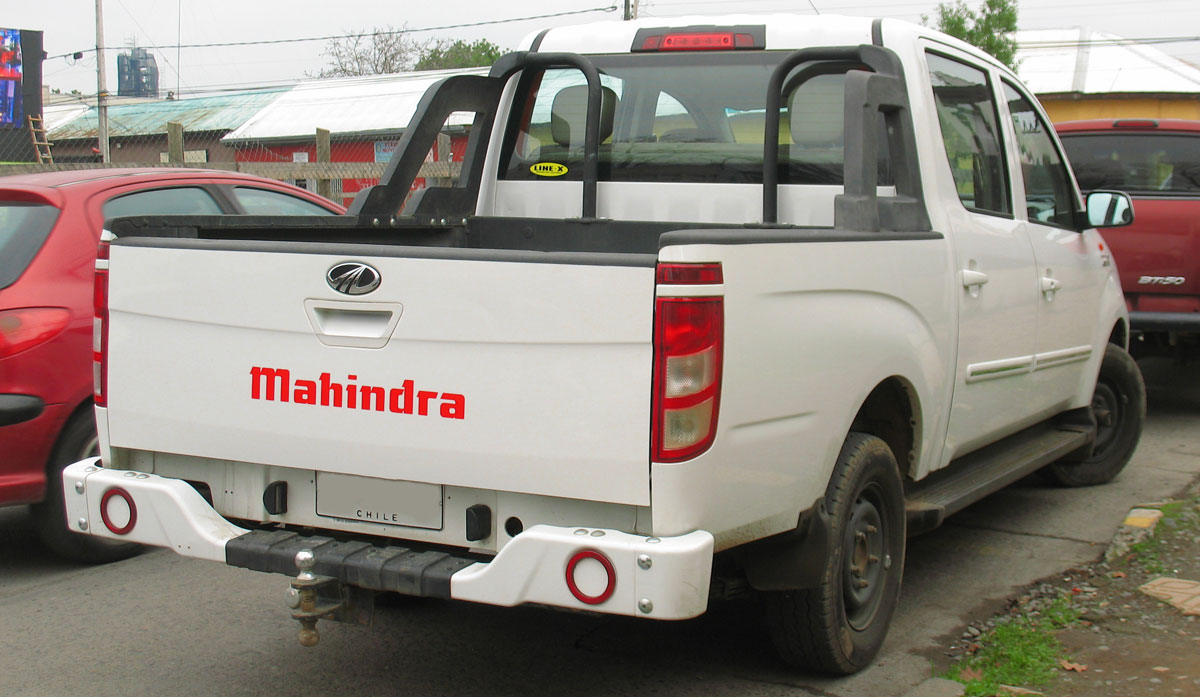
Mahindra Genio 2.2 CRDe 4×4. Flickr Image.
Mahindra or M&M Limited is one of the biggest automakers in India.
Some of the firm’s largest rivals include Tata Motors and Maruti Suzuki.
While Mahindra is publicly traded on the BSE and NSE, it is actually a wholly-owned subsidiary of the Mahindra Group.
Mahindra is particularly well-known for its commercial vehicles and tractors in India.
In addition, Mahindra has also been gaining progress in the passenger vehicle market, especially in the utility vehicle market.
All told, in this article, we will look specifically at Mahindra’s market share in the domestic market of India.
Aside from the total market share, we also will look at the market share breakdown based on segments which include the commercial and passenger vehicle segments.
Since Mahindra also has sizable tractor sales in India, the market share of the firm’s farm equipment sector also will be looked upon in this article.
That said, let’s head out to see the numbers!
Table Of Contents
Consolidated Results
Commercial Vehicle Results
B1. Commercial Vehicle Market Share
B2. Commercial Vehicle Market Share By Segment
Passenger Vehicle Results
C1. Passenger Vehicle Market Share
C2. Passenger Vehicle Market Share By Segment
3-Wheelers Results
D1. 3-Wheeler Total Market Share
D2. Electric 3-Wheeler Market Share
Farm Equipment Sector
Conclusion And Reference
S1. Conclusion
S2. References and Credits
S3. Disclosure
Total Market Share
Mahindra’s domestic market share
(click image to expand)
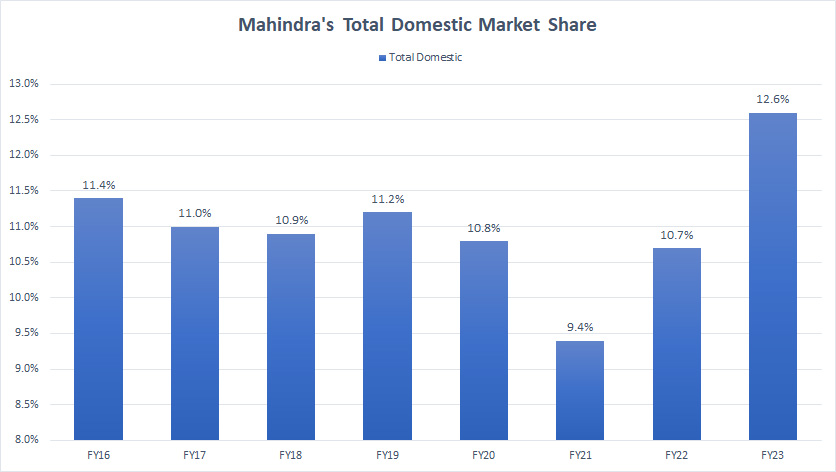
M&M’s domestic market share is defined as the company’s total sales divided by the total industry volume.
That said, according to the chart above, Mahindra’s total market share in India has greatly improved in post-pandemic periods.
As seen, Mahindra’s total market share in India has increased from 9.4% in FY21 to as much as 12.6% as of FY23.
Prior to FY21, Mahindra’s domestic market share averaged only 11% and this figure dropped considerably in FY21, due largely to the disruption triggered by the COVID-19 pandemic.
In FY23, Mahindra sold 666,349 vehicles compared to 423,143 vehicles registered in FY22 in the domestic market of India, up 54% year on year.
Commercial Vehicle Market Share
Mahindra’s commercial vehicle market share
(click image to expand)
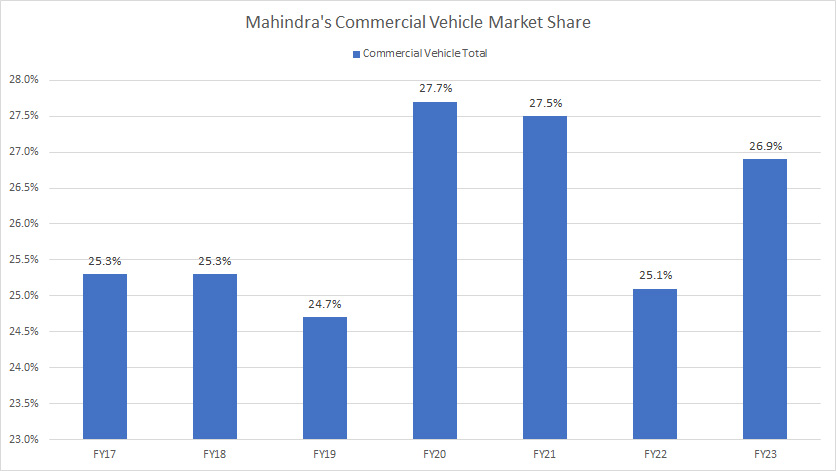
Mahindra’s commercial vehicle market share improved modestly in FY23 to 26.9% compared to 25.1% reported in FY22.
Mahindra sold a total of 248,000 commercial vehicles in FY23 compared to 177,000 reported in FY22, an increase of 40% year over year.
Commercial Vehicle Market Share By Segment
Mahindra’s commercial vehicle market share breakdown
(click image to expand)
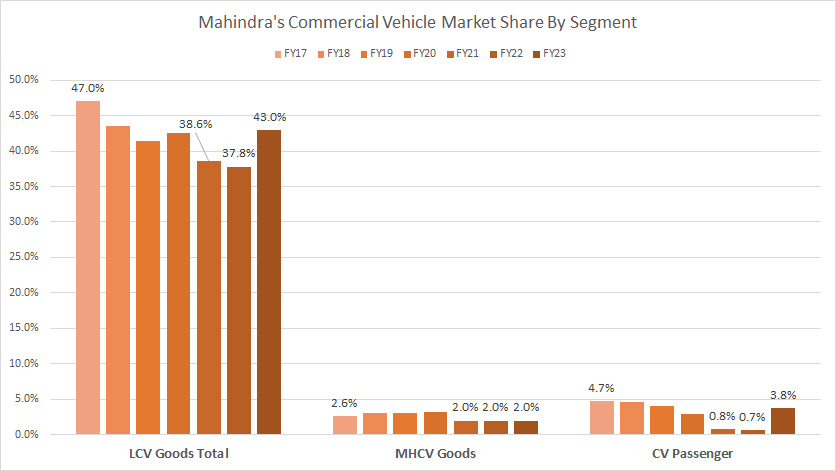
Mahindra’s commercial vehicles market share is broken down into 3 major segments, namely LCV Goods Total, MHCV Goods, and CV Passenger.
Of all commercial vehicles sold by Mahindra, the LCV Goods Total commands the highest market share for the company, well above 40% in FY23.
Prior to FY23, Mahindra’s market share in the LCV segment had declined below 40% but this figure had remarkably recovered in post-pandemic times.
For your information, Mahindra delivered slightly more than 240,000 commercial vehicles within the LCV segment in FY23, representing a year-over-year increase of 40%.
In other commercial vehicle segments which include the MHCV Goods and CV Passenger, Mahindra had very little market share and sold very few vehicles under these segments.
For example, Mahindra’s market share for MHCV Goods was only 2.0% in FY23 while the market share of CV Passenger came in at only 3.8% in the same period.
A trend worth mentioning is that Mahindra’s market share within the LCV Goods segment has considerably declined over the years while those of the MHCV and CV Passenger segments have largely remained flat even in post-pandemic periods.
Passenger Vehicle Market Share
Mahindra’s passenger vehicle market share
(click image to expand)
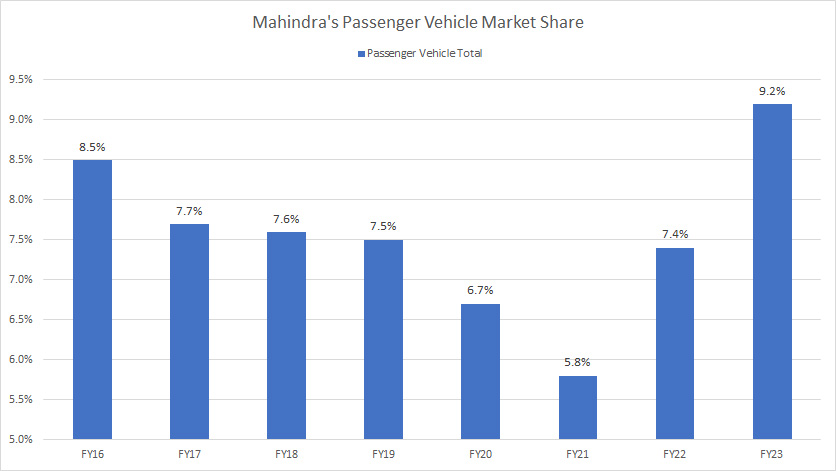
Although Mahindra achieves massive success in the commercial vehicle segment, this is not the case in the passenger vehicle segment.
As seen in the chart above, Mahindra’s total market share in the passenger vehicle segment totaled only 9.2% as of FY23, only about one-third of the figure in the commercial vehicle sector.
Despite the underachievement in the passenger vehicle segment, Mahindra’s market share has significantly improved in post-pandemic times and the latest result even surpasses the pre-pandemic levels.
As seen, Mahindra’s 9.2% market share in the passenger vehicle sector was a record figure over the past 8 years.
For your information, Mahindra shipped slightly over 359,000 passenger vehicles in FY23 compared to 226,000 vehicles reported in FY22, about 59% higher year-on-year.
Passenger Vehicle Market Share By Segment
Mahindra’s passenger vehicle market share breakdown
(click image to expand)
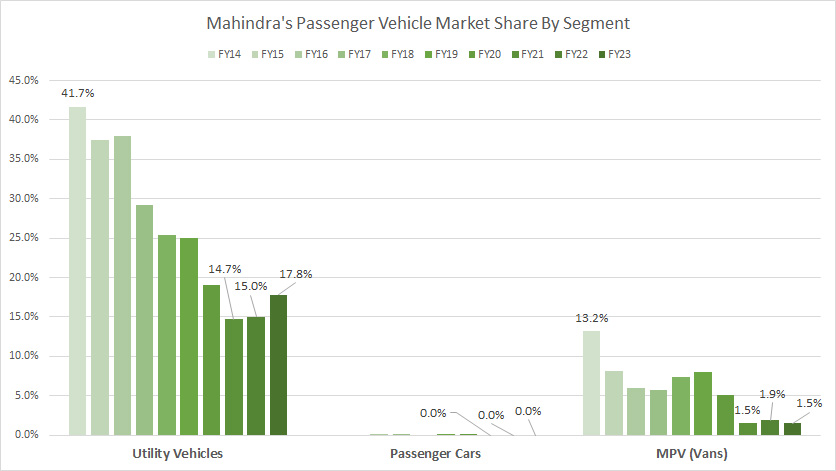
Mahindra’s passenger vehicle segment is categorized into 3 segments and they are utility vehicles, passenger cars, and MPVs (vans).
Of all the passenger vehicle segments, the utility vehicle segment commands the highest market share in India for the company, reportedly at 18% as of FY23.
Despite the considerably higher utility vehicle market share in FY23, the latest result was less than half of that reported back in FY14.
Therefore, in a span of 10 years, Mahindra’s market share in the utility vehicle segment has declined from 41.7% to only 17.8%.
For other passenger vehicle sectors, Mahindra has an even lower market share.
For example, Mahindra literally has zero market share in the passenger car segment while the market share for MPVs totaled only 1.5% as of FY23.
3-Wheeler Total Market Share
Mahindra’s 3 wheeler market share
(click image to expand)
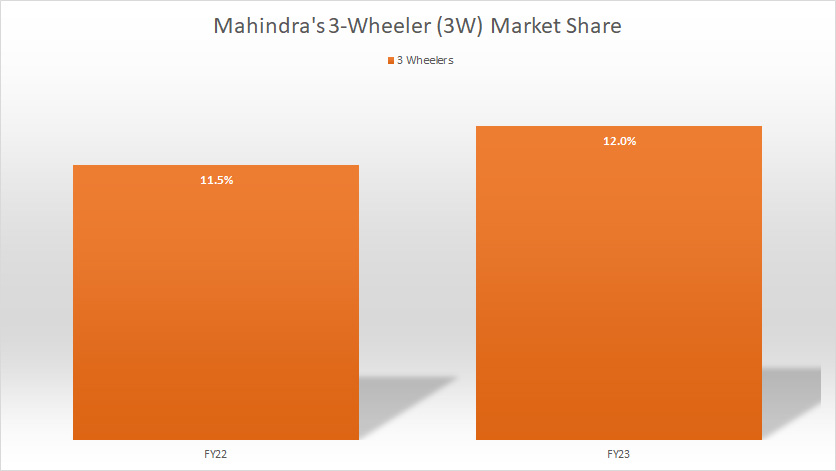
Mahindra claimed to have a 12% market share for 3-wheelers in India in FY23 compared to the 11.5% reported in FY22.
The following quote is extracted from the company’s FY23 annual report regarding its 3-wheeler market share in India:
-
“In the Last Mile Mobility (LMM) segment, your Company sold 58,626 passenger and goods three-wheelers, a growth of 94%, with a market share of 12% in F23 vs 11.5% in F22.
Your Company has a wide range of offerings inclusive of electric, CNG, diesel, and petrol products with the latest addition being the all-new cargo electric three-wheeler Zor Grand electric.
The Zor Grand is superior in performance, mileage, and overall earning potential, and has been widely accepted by customers across the country.”
Apparently, the 3-wheeler market share figure covers all types of 3-wheelers that run on electric batteries, compressed natural gas (CNG), diesel, and gasoline.
Electric 3-Wheeler Market Share
Mahindra’s electric 3 wheeler market share
(click image to expand)
For the electric version of the 3-wheelers, Mahindra has an even higher market share.
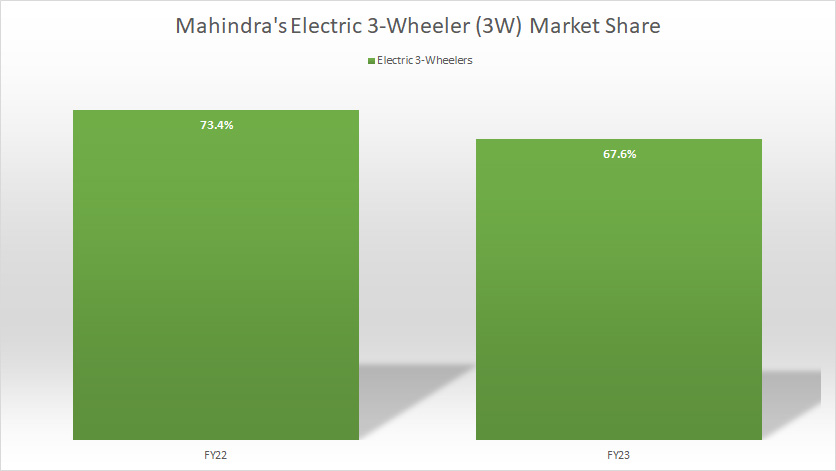
As seen in the chart above, Mahindra claimed to have a market share of as much as 67.6% in FY23 for the electric 3-wheeler in India.
Prior to FY23, Mahindra’s market share for the electric 3-wheeler in India was even higher at 73.4%.
This figure shows that Mahindra had successfully commanded nearly three-quarters of the electric 3-wheeler market in India.
Despite the high market share, the figure dropped slightly to 67.6% as of FY23.
Tractor Market Share
Mahindra’s domestic tractor market share
(click image to expand)
Mahindra commands a high market share in the farm equipment sector.
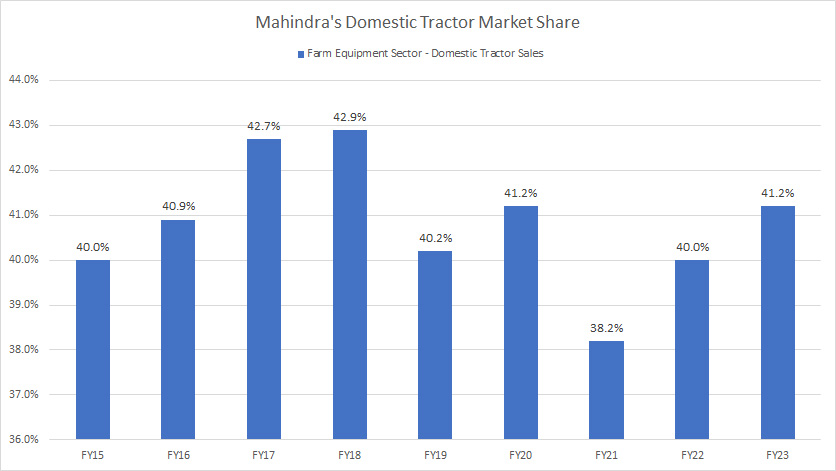
That said, Mahindra’s market share for tractors in India totaled as much as 41.2% in FY23, a rise of 1.2 percentage points over FY22.
This market share figure was achieved across a variety of brands such as Mahindra, Swaraj, and Trakstar.
This figure has remained roughly unchanged over the years, illustrating the solid competitive position of Mahindra within the farm equipment sector in India.
According to the FY23 annual report, Mahindra has continued to remain the number 1 leader in India in the farm equipment sector at a 41.2% market share.
Moreover, Mahindra has retained its market leadership position in the farm equipment sector in India for the 40th consecutive year as of FY23.
That said, Mahindra sold slightly over 389,000 tractors in India in FY23 compared to 337,000 units sold in the prior year, an increase of about 15% year-on-year.
In the same fiscal year, Mahindra exported 18,000 tractors, up 2% over a year ago.
Conclusion
In conclusion, Mahindra seems to have had a good year in FY23, with market share figures reaching record highs across most vehicle segments.
Credits And References
1. All financial data presented in this article was obtained and referenced from Mahindra’s earnings releases, annual reports, investors letters, presentations, news releases, etc., which are available in M&M’s Investor Relation.
2. Featured images in this article are used under Creative Commons licenses and sourced from the following websites: Mahindra Genio 2.2 CRDe 4×4 and Mahindra Moto GP bike.
Disclosure
References and examples such as tables, charts, and diagrams are constantly reviewed to avoid errors, but we cannot warrant the full correctness of all content.
The content in this article is for informational purposes only and is neither a recommendation nor a piece of financial advice to purchase a stock.
If you find the information in this article helpful, please consider sharing it on social media and also provide a link back to this article from any website so that more articles like this one can be created in the future.
Thank you!

