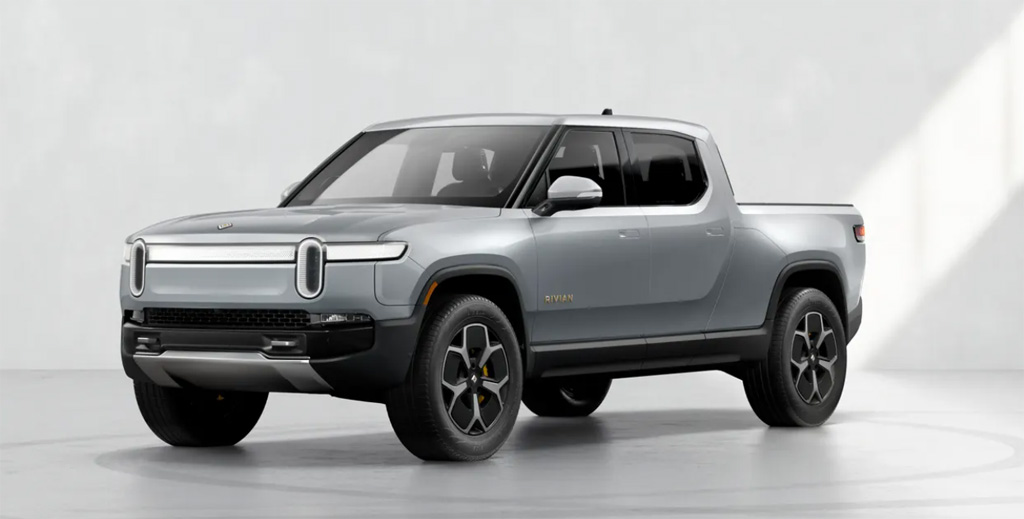
Rivian R1T. Image By Rivian
Rivian Automotive (RIVN) is a U.S. automobile company specializing in the design, development, and manufacture of electric trucks, SUVs, and commercial vans.
Rivian’s products include not only the vehicles but also the software and accessories, as well as value-added services that directly address the vehicle’s entire lifecycle.
Rivian’s products for the consumer market include the R1 electric truck and R1 utility vehicle. On the other hand, Rivian’s products for the commercial market include electric delivery vans, which the company has agreed to produce up to 100,000 units for Amazon.
As of the end of 2023, Rivian’s sales to Amazon represented 19% of the company’s total revenue.
Rivian’s current vehicles are based on the R1 manufacturing platform. The company is making progress to launch the R2 platform in 2026, which is intended to be more sophisticated but cost less to produce.
For your information, the R2 will be Rivian’s first high-volume manufacturing platform in Georgia, a separate location from the existing R1 platform in Normal, Illinois. Rivian said that the R2 will be a game changer for the company as the R2 vehicles will be the company’s first mass-market products.
This article looks at several statistics which include Rivian’s sales and production, revenue per car, outlook, and growth rates.
Let’s get started.
Please use the table of contents to navigate this page.
Table Of Contents
Definitions And Overview
O2. How Does Rivian Distribute Its Vehicles?
Vehicle Production, Sales, And Outlook
A1. Vehicles Production, Sales, And 2025 Outlook
Vehicle Pricing
Conclusion And Reference
S1. Summary
S2. References and Credits
S3. Disclosure
Definitions
To help readers understand the content better, the following terms and glossaries have been provided.
Revenue Per Vehicle: Revenue per vehicle is a financial metric often used in industries where businesses generate income by selling or leasing vehicles.
It measures the average revenue generated from each vehicle in a given period. This metric is particularly relevant in the automotive industry, car rental services, and companies involved in leasing vehicles. It provides insight into the profitability and efficiency of a company’s sales and leasing strategies.
Calculating revenue per vehicle involves dividing the total revenue earned from vehicles by the number of vehicles sold or leased in the same period. This indicator helps businesses assess their performance, make informed pricing and inventory decisions, and strategize to improve profitability.
How Does Rivian Distribute Its Vehicles?
Rivian, unlike traditional automakers, adopts a direct-to-consumer sales model, meaning they sell vehicles directly to customers without relying on independent dealerships. This approach is similar to what other electric vehicle manufacturers, such as Tesla, have implemented. Here’s a breakdown of how Rivian distributes its vehicles:
1. **Online Sales**: Customers can order vehicles directly from Rivian’s website. Before placing an order, this process allows for vehicle customization, including model type, color, and additional features.
2. **Rivian Showrooms and Experience Centers**: Rivian is also opening physical locations where potential buyers can view models, ask questions, and take test drives. These centers are strategically placed in high-traffic areas to increase brand visibility and customer engagement. However, the purchase process is completed online, even in these physical locations.
3. **Delivery**: Rivian coordinates the delivery of the new vehicle directly to the customer’s preferred address after purchasing a vehicle. This direct delivery method enhances the customer experience by making the process more personal and convenient.
4. **Service Centers and Mobile Service**: Rivian is establishing a network of service centers for maintenance and service. Additionally, they offer mobile service, where technicians come to the vehicle’s location, reducing the need for owners to visit a service center.
This distribution approach allows Rivian to maintain control over the sales process, provide a consistent brand experience, and potentially reduce costs associated with traditional dealership networks.
Direct sales models in the automotive industry are somewhat controversial and face legal challenges in some states in the U.S., where laws traditionally favor the dealership model.
However, Rivian, like other EV manufacturers, is navigating these challenges by advocating for changes to these laws and finding innovative ways to reach customers within the current legal framework.
Vehicles Production, Sales, And 2025 Outlook
Rivian-vehicle-production-and-sales-figures
(click image to expand)
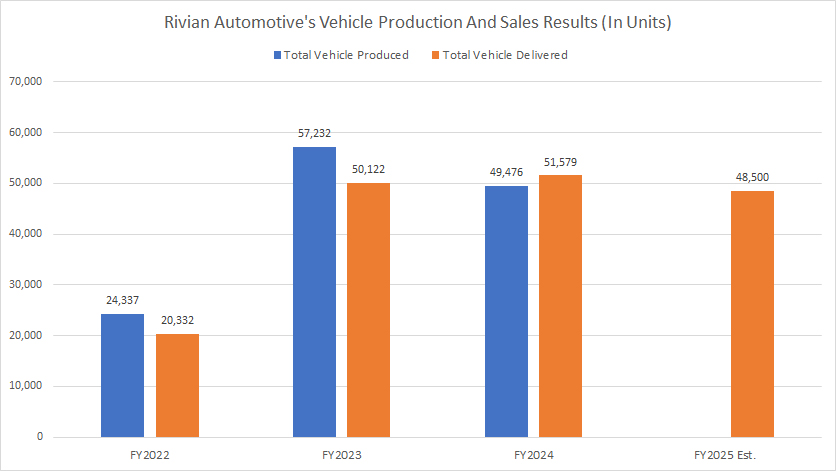
Rivian produced 49,500 vehicles in fiscal year 2024, representing a 13% decrease from the 57,200 vehicles produced in fiscal year 2023.
Despite the decline in vehicle production for 2024, it marked a significant increase from the 24,300 vehicles produced in fiscal year 2022. Over the span of just two years, Rivian’s vehicle production has more than doubled, reflecting substantial growth.
Looking ahead, Rivian anticipates that vehicle production will remain steady in fiscal year 2025, projecting an outlook for vehicle sales at approximately 48,500 units at the midpoint.
In terms of sales, Rivian sold 51,600 vehicles in fiscal year 2024, a modest 3% increase from the 50,100 vehicles delivered in fiscal year 2023. Although vehicle sales were relatively flat in 2024, the numbers were more than double the 20,300 units sold in fiscal year 2022.
Rivian projects that vehicle sales will reach around 48,500 units for fiscal year 2025, maintaining consistency with the previous year’s production and sales forecast.
Overall, Rivian’s trajectory shows substantial growth from 2022 to 2024, despite the fluctuations in production and sales. Moving forward, the company expects stable production and sales volumes, indicative of a cautious yet steady approach to navigating the evolving market landscape.
Revenue Per Vehicle
Rivian-revenue-per-vehicle
(click image to expand)
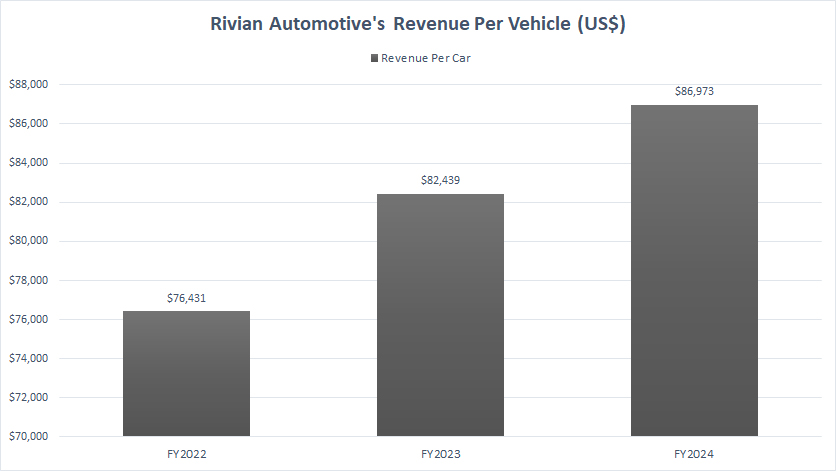
The revenue per vehicle is calculated as total automotive revenue earned divided by the number of vehicles delivered.
The definition of Rivian’s revenue per vehicle is available here: revenue per vehicle.
Rivian’s revenue per vehicle has shown remarkable growth since 2022, reaching a significant milestone of $87,000 by the end of fiscal year 2024. This represents a record figure since 2022 and reflects the company’s strategy in enhancing its revenue streams.
When compared to fiscal year 2023, where Rivian earned approximately $82,400 in revenue per vehicle, the 2024 result signifies a 6% increase. Moreover, it marks a notable 14% rise from the $76,400 of revenue per vehicle earned in fiscal year 2022. These figures highlight Rivian’s strong performance and upward trajectory in terms of revenue generation per vehicle.
Rivian’s revenue per vehicle is higher than most automobile companies, as detailed in this article: revenue per vehicle of major automobile companies. For instance, Tesla earned revenue per vehicle of only $53,000.
Chinese automakers reported much lower figures, as outlined in this comparison article: Tesla versus Chinese EV: revenue per car.
Despite these impressive revenue figures, Rivian faces the challenge of bringing its vehicle selling price down to target the mass EV market. This strategic adjustment could enable Rivian to capture a larger share of the growing electric vehicle market, which is becoming increasingly competitive.
By offering more affordable options, Rivian could potentially attract a broader customer base, thereby driving higher volumes in both production and sales.
Overall, while Rivian’s current revenue per vehicle is commendable, the company may need to balance between maintaining high revenue per vehicle and expanding its reach in the mass market segment. Such strategic considerations will be crucial for Rivian’s long-term success and sustainability in the dynamic automotive industry.
Conclusion
In summary, Rivian anticipates that vehicle production will remain steady in fiscal year 2025, with an expected sales volume of around 48,500 units. This projection suggests a cautious approach to navigating market dynamics while maintaining stable production and sales volumes.
Additionally, Rivian’s focus on enhancing its revenue per vehicle and expanding its product offerings, such as the upcoming R2 platform, positions the company well for future growth.
Overall, Rivian’s trajectory shows substantial growth in production and sales, coupled with a strong revenue per vehicle. The company’s strategic initiatives and market positioning indicate a promising outlook for continued success in the competitive electric vehicle market.
References and Credits
1. All financial figures presented were obtained and referenced from Rivian Automotive, Inc.’s annual and quarterly reports published on the company’s investor relations page: Rivian Investor Relations.
2. Images were obtained from Rivian R1S.
Disclosure
We may use the assistance of artificial intelligence (AI) tools to produce some of the text in this article. However, the data is directly obtained from original sources and meticulously cross-checked by our editors multiple times to ensure its accuracy and reliability.
If you find the information in this article helpful, please consider sharing it on social media. Additionally, providing a link back to this article from any website can help us create more content like this in the future.
Thank you for your support and engagement! Your involvement helps us continue to provide high-quality, reliable content.


