Tesla Gigafactory Nevada
This article presents the vehicle average selling price (ASP) of major automakers that are based primarily in the U.S. and globally.
As the name implies, the vehicle ASP measures the average sales price per vehicle sold by an automobile company.
The average sales price normally includes all vehicles delivered or sold by a company and the vehicles include trucks, cars, SUVs, as well as commercial vehicles.
In this article, the vehicle ASP is calculated based on the automotive revenue earned in a given period of time and the respective number of vehicles delivered or sold for that period.
During the ASP measurement, revenue or sales that are not related, ie. leasing revenue, regulatory credits, services, etc., are stripped off.
In addition, some vehicles are delivered on a wholesale basis and these data may include the numbers that come from unconsolidated affiliates.
For your information, vehicles delivered by unconsolidated affiliates are not recognized as revenue or sales in the income or profit and loss statements according to most accounting rules, such as the GAAP and IFRS.
Therefore, these numbers are also stripped off during the ASP measurement.
That said, let’s start with the following topics.
Vehicle Average Sales Price Topics
1. Vehicle ASP In 2022
2. Vehicle ASP By Year From 2020 To 2022
3. Growth Rates Of Vehicle ASP From 2020 To 2022
4. Vehicle ASP By Year From 2014 To 2022
5. Vehicle ASP By TTM From 2014 To 2022
6. Conclusion
7. References and Credits
8. Disclosure
Vehicle Average Selling Price 2022
Vehicle ASP 2022
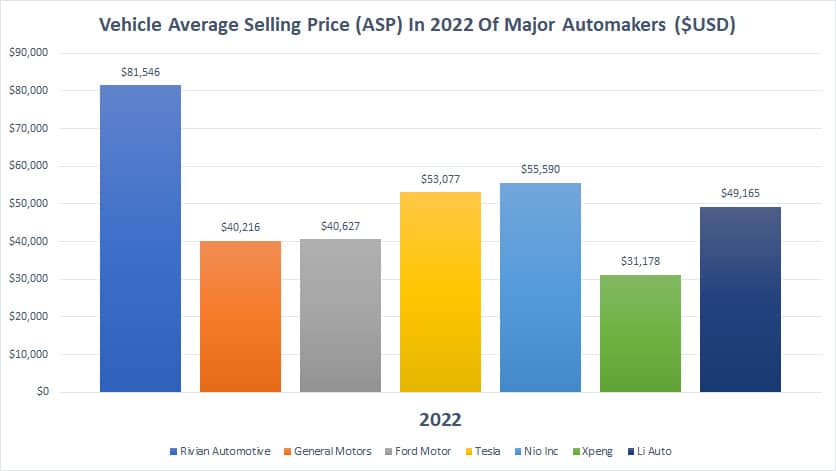
The chart above shows only the 2022 vehicle average selling price (ASP) of major automakers.
As shown, Rivian Automotive tops the chart with an ASP of roughly $81,000 per vehicle as of 2022, the highest among all major automakers.
Nio Inc. comes in second at an ASP of roughly $55,000 per car sold in 2022.
While the vehicle ASP of Nio Inc. is among the highest, the gap between Nio Inc and Rivian is huge, with roughly a $26,000 difference.
The difference shows that Rivian’s vehicle ASP is so much higher and it leads the pack by a very wide margin.
On the other hand, Tesla claims the 3rd spot, with a vehicle price tag that averaged around $53,000 in 2022 and was only slightly below that of Nio Inc.
The fourth place goes to Li Auto, a Chinese automaker, at $49,000 per car delivered.
Both Ford Motor and General Motors have roughly the same vehicle ASP as of 2022, at $40,000 per vehicle on average.
Xpeng, another Chinese automaker, has the lowest ASP among all major automakers shown in the chart, notably at only $31,000 per car sold as of 2022.
Therefore, the average vehicle price tag of Xpeng is only one-third of that of Rivian and is nearly half of that of Nio and Tesla.
Vehicle ASP By Year From 2020 To 2022
Vehicle ASP From 2020 To 2022
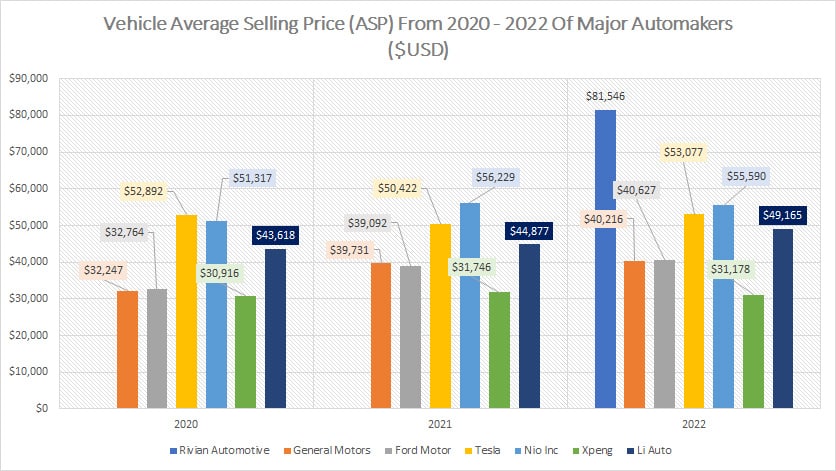
The chart above shows the vehicle average selling price (ASP) between 2020 and 2022 of major automakers.
From the chart, we can find out how the vehicle ASP of most automakers has changed in the last 3 years.
As seen, a large number of automakers have significantly increased their vehicle ASP in the last 3 years from 2020 to 2022.
For example, both Ford Motor and General Motors have significantly boosted their vehicle ASP in the last 3 years, notably from $32,000 per vehicle sold in 2020 to a massive $40,000 per vehicle sold in 2022.
While Tesla’s vehicle ASP declined to $50,000 per car sold in 2021, it significantly rose in 2022 to $53,000 per car sold.
Most Chinese automakers also are not spared from having their ASP risen.
For example, Nio Inc. grew its vehicle ASP by a massive $5,000 USD in 2021 to $56,000 per car sold and maintained at roughly this level in 2022.
Li Auto also has grown its vehicle ASP consecutively 3 years in a row from 2020 to 2022, rising from $43,000 to nearly $50,000 per vehicle delivered.
Xpeng seems like the only Chinese car company that has only been minimally impacted in terms of a rising vehicle ASP.
For instance, Xpeng’s vehicle average sales price rose only slightly from $30,900 in 2020 to $31,200 in 2022.
Growth Rates Of Vehicle ASP From 2020 To 2022
Vehicle ASP Growth Rates From 2020 To 2022
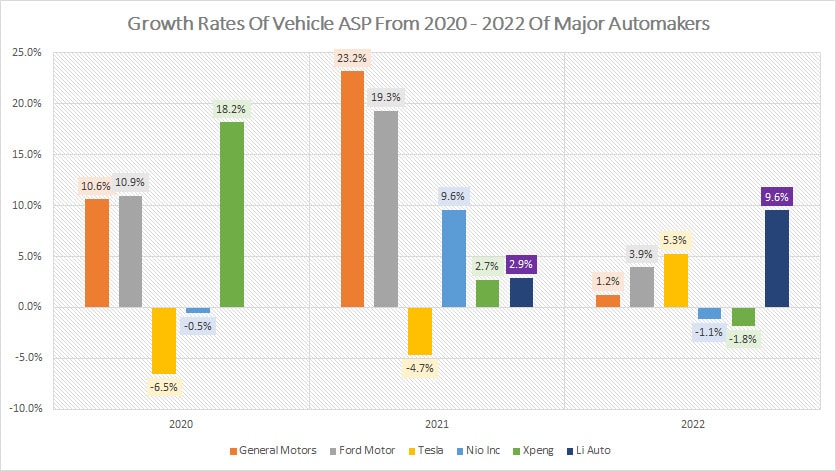
From the perspective of growth rates, both GM and Ford Motor have grown their vehicle ASP quite significantly since 2020.
For example, GM and Ford Motor’s vehicle average sales prices grew in high double digits in 2020 and 2021, notably at a minimum of 10% and 20%, respectively.
The growth of vehicle ASP seems unstoppable for both Ford and GM as it continued to grow in 2022, albeit at low single digits.
While the vehicle ASP of Tesla subsided in 2020 and 2021, it went up by 5% in 2022, illustrating that the company has no choice but to raise prices driven primarily by inflation.
Li Auto raised its vehicle ASP the most in 2022 among all major automakers, at nearly 10% on a year-over-year basis.
In short, most automakers have raised their vehicle sales prices between 2020 and 2020, driven primarily by the rising costs of raw materials and supplies.
Vehicle ASP By Year From 2014 To 2022
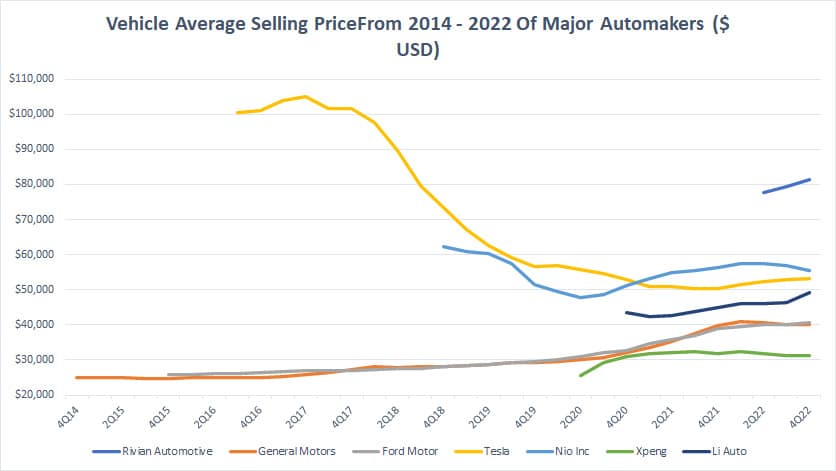
Vehicle ASP By Year From 2014 To 2022
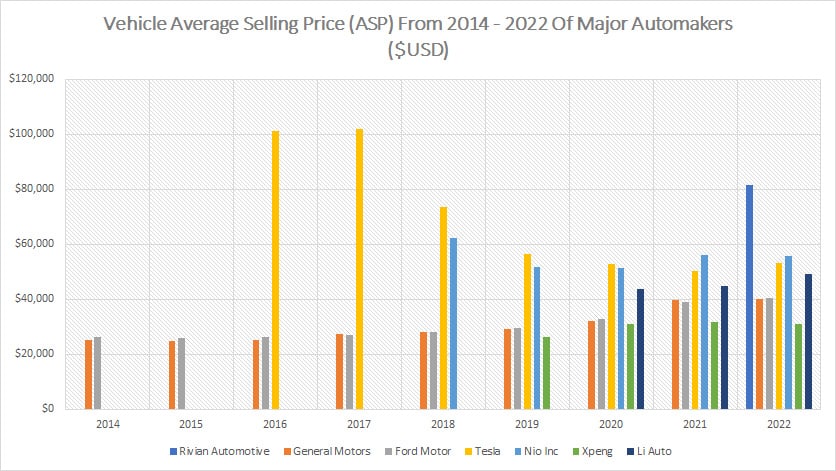
While the vehicle ASP of most automakers has risen since 2020, it had not been the case on a long-term basis.
A very obvious example would be the vehicle ASP of Tesla.
As shown, Tesla’s vehicle average selling price has been on a decline since 2016.
Back in 2016, Tesla’s vehicle ASP topped more than $100,000 per car, the highest among all major automakers.
In a period of just 7 years, Tesla managed to bring its vehicle sales price down by more than 50% and reached the $53,000 price tag as of 2022.
The declining trend of vehicle ASP also applies to Nio Inc.
For example, Nio Inc.’s vehicle ASP has gone to only $56,000 US per car as of 2022, a significant reduction from the $60,000 price tag reported in 2018.
However, not all major automakers have their vehicle ASP reduced between 2014 and 2022.
For instance, both Ford and GM have seen their vehicle ASP increases over the years and reached record highs as of 2022 at $40,000 per car.
A similar trend also can be seen in Li Auto, a popular Chinese automaker.
As mentioned, Li Auto’s vehicle ASP has increased from $43,000 per vehicle in 2020 to a record high of $49,000 per vehicle as of 2022.
While both GM and Ford Motor have their vehicle average sales prices growing since 2014, the numbers are still some of the lowest among all major automakers.
As shown in the chart, the vehicle ASP of both GM and Ford Motor has only been slightly higher than that of Xpeng all these years and is below that of most automakers.
The reason for the lower vehicle ASP for both Ford Motor and GM can be attributed to the fact that their business models are based on a wholesale basis rather than on a retail basis and this explains the lower vehicle ASP.
Vehicle ASP By TTM From 2014 To 2022
Vehicle ASP By TTM From 2014 To 2022
The vehicle ASP shown in the chart above is based on a TTM basis and is more refined than the annual plot which we saw in prior discussions.
As seen, the TTM plot shows a much clearer trend of the vehicle average selling price of most automakers.
For example, Tesla’s vehicle ASP is showing a very obvious declining trend between 2016 and 2022 and was the 3rd highest after Rivian and Nio Inc.
Nio Inc.’s vehicle ASP also has declined considerably since 2018 but has grown quite a bit in recent years, possibly driven by higher costs of raw materials and labor.
On the flipped side, Rivian’s vehicle ASP has been at the top of the chart since 2Q 2022 and has trended higher in the last 3 quarters.
Both Ford and GM have been sitting nearly at the bottom of the chart since 2014 but the vehicle ASP has clearly trended higher in recent years, also driven in part by higher inflation.
Despite the significant rise in GM and Ford’s vehicle sales price in the last few years, it was still among the lowest and was considerably lower than the figure of most automakers.
Even the low-cost Chinese automaker Xpeng has raised prices in recent years but was still the lowest among all major automakers.
Conclusion
In summary, Rivian Automotive is by far the automaker with the highest vehicle ASP as of 2022, at $81,500 per vehicle delivered.
In addition, we have seen that most automakers such as Tesla, Ford Motor, GM, Nio Inc, and Li Auto have raised their vehicle ASP between 2020 and 2022, driven in large part by higher costs of sales.
However, on a long-term basis, some automakers, especially those producing EVs, have lowered their vehicle ASP over the years, in a bid to make their vehicles more affordable and accessible to consumers.
References and Credits
1. All financial figures in this article were obtained and referenced from the respective annual reports, earnings releases, quarterly statements, etc., available in the following links:
a. Rivian Investor Relations
b. Ford Motor Investor Relations
c. GM Investor Relations
d. Tesla Investor Relations
e. Nio Inc. Investor Relations
f. Xpeng Investor Relations
g. Li Auto Investor Relations
2. Images were obtained from Tesla 4Q 2022 Update Letter.
Disclosure
The content in this article is for informational purposes only and is neither a recommendation nor a piece of financial advice to purchase a stock.
If you find the information in this article helpful, please consider sharing it on social media and also provide a link back to this article from any website so that more articles like this one can be created in the future.
Thank you for the support!
