A combustion engine. Pexels Image.
Tata Motors is an Indian multinational automotive manufacturing company headquartered in Mumbai, India. It is part of the Tata Group, one of India’s largest conglomerates.
Tata Motors produces a wide range of vehicles, including:
- Passenger Cars: Known for models like the Tata Nexon, Tata Harrier, and Tata Altroz.
- Commercial Vehicles: This includes trucks, buses, and light commercial vehicles.
- Electric Vehicles (EVs): Tata Motors is investing heavily in electric mobility solutions with models like the Tata Nexon EV.
That said, this article presents only the wholesale volume of Tata Motors’ passenger vehicles. The passenger vehicle volumes presented exclude those from Jaguar Land Rover (JLR).
Tata Motors’ passenger vehicle wholesale volumes are obtained from the company’s monthly flash figure reports. This figure may differ slightly from those reported in the annual report due to final adjustment.
The difference between wholesale-based and retail-based vehicle sales volume is that wholesale-based vehicle sales volume generally correlates with revenue presented in the company’s profit and loss statements, while retail-based vehicle sales volume does not.
Let’s take a look!
Investors interested in Tata Motors and Jaguar Land Rover (JLR)’s vehicle sales may find more information on these page: Tata Motors global sales and Jaguar Land Rover car sales.
Please use the table of contents to navigate this page.
Table Of Contents
Definitions And Overview
Consolidated Results
A1. Total Passenger Vehicle Sales
A2. Percentage Of Passenger Vehicle Sales To Total Volume
Results By Vehicle Type
B1. Sales Of Utility Vehicles And Passenger Cars
B2. Sales Of Utility Vehicles And Passenger Cars In Percentage
Growth Rates
C1. Passenger Vehicle Sales Growth Rates
Summary And Reference
S1. Conclusion
S2. References and Credits
S3. Disclosure
Definitions
To help readers understand the content better, the following terms and glossaries have been provided.
Passenger Vehicles: Tata Motors’ passenger vehicle product portfolio includes utility vehicles (SUV), passenger cars, and electric vehicles.
Utility vehicles (SUV) include models such as Tata Nexon, Tata Harrier, Tata Safari, and Tata Punch.
Passenger cars include models such as Tata Tiago, Tata Altroz, and Tata Tigor.
Electric cars include models such as Tata Nexon EV, Tata Tigor EV, and Tata Tiago EV.
Total Passenger Vehicle Sales
Tata-Motors-passenger-vehicle-sales
(click image to expand)
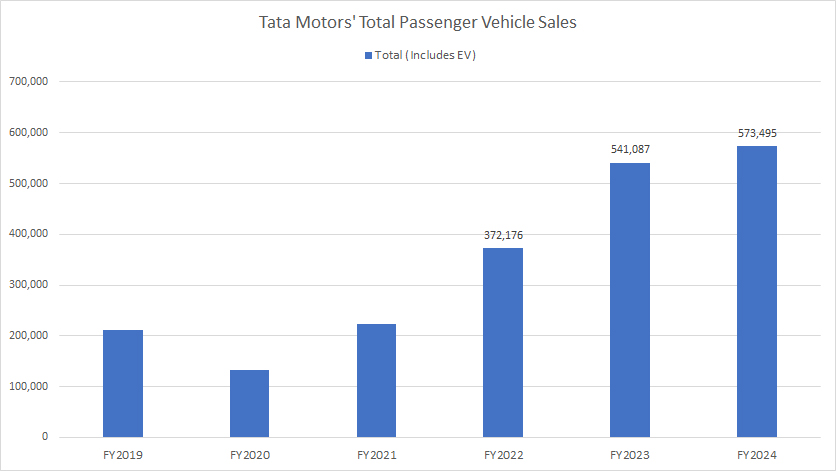
Tata Motors sold slightly over 573 thousand passenger vehicles by the end of fiscal year 2024, about 6% or 32 thousand vehicles higher than the one delivered in fiscal year 2023.
In fiscal year 2023, Tata Motors delivered 541 thousand passenger vehicles, and in fiscal year 2022, the passenger vehicle sales came in at just 372 thousand units.
Percentage Of Passenger Vehicle Sales To Total Volume
Tata-Motors-passenger-vehicle-sales-to-total-sales-volume
(click image to expand)
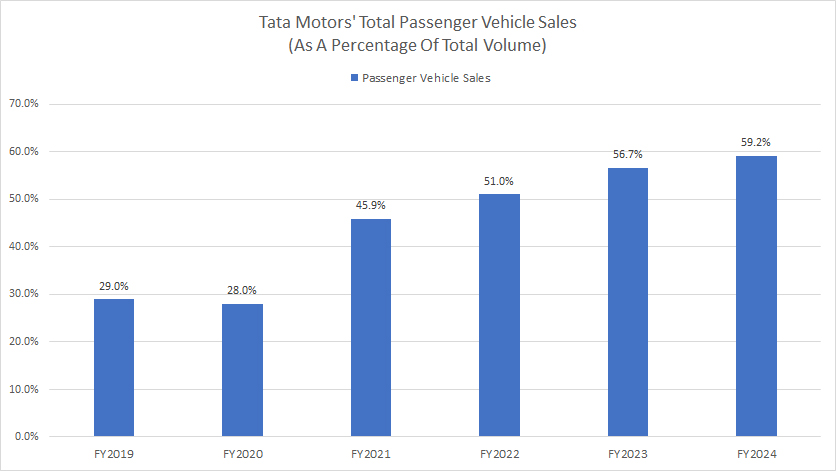
With respect to Tata Motors’ total sales volume, the sales of passenger vehicles represents about 59% of the total volume for fiscal year 2024.
A significant trend is that the sales percentage has significantly risen since fiscal year 2019, as shown in the chart above, from 29% in FY2019 to 59% as of FY2024.
The increasing sales contribution from Tata Motors’ passenger vehicles illustrates the growing dominance of this vehicle segment within the company.
Therefore, as of fiscal year 2024, Tata Motors’ passenger vehicles already made up more than half of the company’s total sales volume. This trend may continue to increase in the future.
Sales Of Utility Vehicles And Passenger Cars
Tata-Motors-utility-vehicle-and-sedan-sales
(click image to expand)
Tata Motors’ passenger vehicle segment consists of utility vehicles (SUV) and passenger cars (sedan). The respective car models are available here: passenger vehicles.
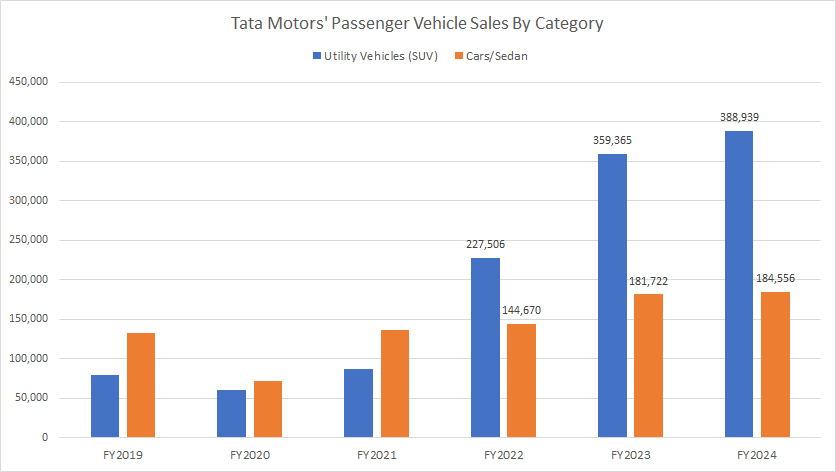
Tata Motors used to sell a much higher number of passenger cars than utiliti vehicles, as shown in the chart above. For example, between fiscal year 2019 and 2021, Tata Motors’ sales of passenger cars have averaged 113 thousand units annually versus 76 thousand units for utility vehicles during the same period.
Since fiscal year 2022, Tata Motors’ sales of utility vehicles have soared, surging to an average figure of 325 thousand units annually versus 170 thousand units of passenger cars.
As of fiscal year 2024, Tata Motors’ sales of utility vehicles were already more than twice the number of passenger cars, reaching 389 thousand units, as shown in the chart above. In the same period, Tata Motors delivered just 185 thousand passenger cars.
Sales Of Utility Vehicles And Passenger Cars In Percentage
Tata-Motors-utility-vehicle-and-sedan-sales-in-percentage
(click image to expand)
Tata Motors’ passenger vehicle segment consists of utility vehicles (SUV) and passenger cars (sedan). The respective car models are available here: passenger vehicles.
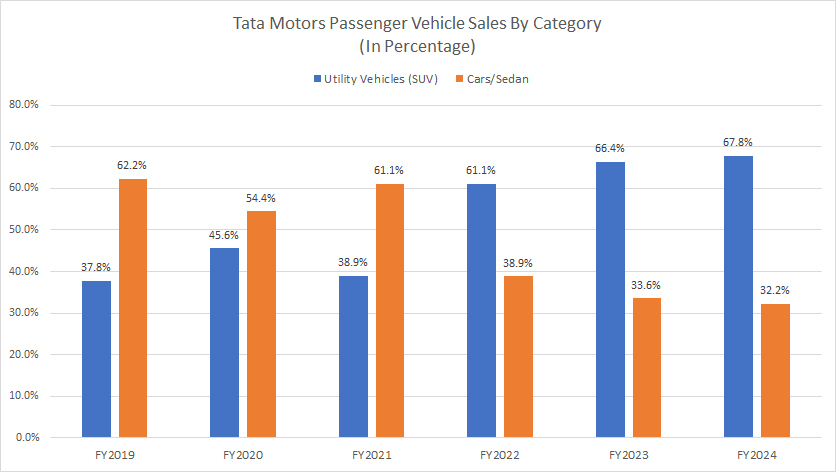
From the perspective of percentage, Tata Motors’ sales of utility vehicles in fiscal year 2024 made up 68% of its total passenger vehicle volume, while passenger cars made up only 32%.
You can see from the chart above that the sales contribution from the utility vehicle segment has significantly increased since fiscal year 2019, from 38% in 2019 to 68% as of 2024.
On the other hand, Tata Motors’ sales contribution from the passenger car category has decreased from 62% in 2019 to 32% as of 2024.
Passenger Vehicle Sales Growth Rates
Tata-Motors-passenger-vehicle-sales-growth-rates
(click image to expand)
Tata Motors’ passenger vehicle segment consists of utility vehicles (SUV) and passenger cars (sedan). The respective car models are available here: passenger vehicles.
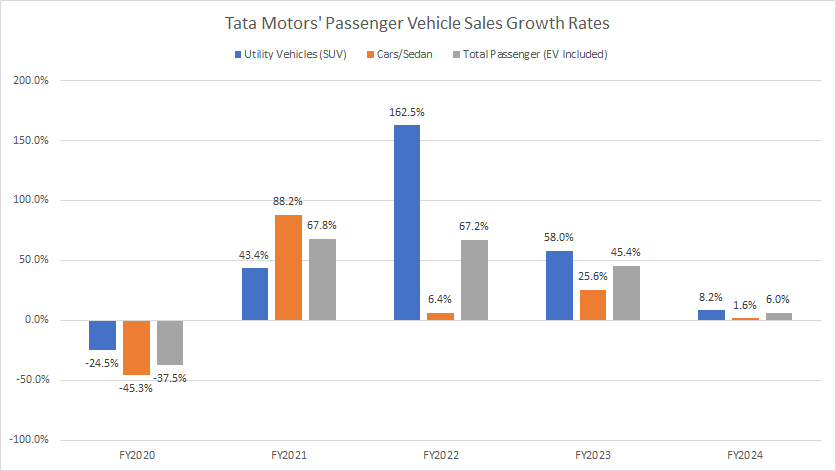
Between fiscal year 2020 and 2024, Tata Motors has only experienced a single sales decline within the passenger vehicle segment, and that was in fiscal year 2020. In subsequent years, Tata Motors’ vehicles sales in all passenger vehicle segments have significantly grown, as shown in the chart above.
However, Tata Motors’ passenger vehicle sales growth has slowed in recent years, and topped just 6% year-over-year in fiscal year 2024 for the total passenger vehicle volume. In fiscal year 2024, Tata Motors’ sales of utility vehicles grew just 8% while passenger cars grew only 1.6%.
On average, the average growth rate of Tata Motors’ utility vehicle sales was 76% between fiscal year 2022 and 2024 versus 11% for the sedan segment. On a consolidated basis, Tata Motors’ sales growth has averaged 40% in the last three fiscal years.
Conclusion
To recap, Tata Motors’ sales of passenger vehicles have grown significantly over the last several years, reaching over 573 thousand units in fiscal year 2024. This figure made up 59% of the company’s total vehicle volume.
Within the passenger vehicle segment, Tata Motors’ sales of utility vehicles have overtaken that of sedan cars. In fiscal year 2024, the utility vehicle sales contributed to 68% of the total passenger vehicle volume, while sedan cars made up 32%.
Credits And References
1. All sales data presented in this article were obtained and referenced from Tata Motors Group’s car sales reports which are available in Tata Investor Relation.
2. Pexels Images.
Disclosure
References and examples such as tables, charts, and diagrams are constantly reviewed to avoid errors, but we cannot warrant the full correctness of all content.
The content in this article is for informational purposes only and is neither a recommendation nor a piece of financial advice to purchase a stock.
If you find the information in this article helpful, please consider sharing it on social media and also provide a link back to this article from any website so that more articles like this one can be created in the future.
Thank you!

