
Research And Development. Source: Flickr Image
Research and development is a big part of social media companies such as Meta (NASDAQ:META), Twitter (NYSE:TWTR), Snap (NYSE:SNAP), and Pinterest (NYSE:PINS) due to the extremely competitive nature of their businesses.
These companies rely heavily on research and development to create the next generation of products or to improve the existing ones for growth.
Without research and development, they will not go very far ahead as social media users will easily switch to other platforms if they find the existing ones outdated or no longer relevant to their needs.
Therefore, Meta, Twitter, Snap, and Pinterest will need to constantly innovate and bring out new products in order to keep their users hooked and spend as much time as possible on their platforms.
Social media companies spend a lot of resources on R&D not only for product development but also for advertising technology.
For example, Snap Inc. stated in its financial reports that it constantly develops and expands its advertising products and technology in order to provide a strong and scalable return on investment to advertisers.
These improvements include advertisement delivery methodology, measurement capabilities, and self-serve tools.
In addition to software, social media companies also spend heavily on hardware.
For example, Snap Inc. spends considerable resources and investment on architecture that powers its products, such as optimizing the delivery of billions of videos to millions of people around the world every day.
Meta, Twitter, and Pinterest are no exception.
In this article, we will look at and compare the research and development (R&D) spending of several social media companies, including Meta, Twitter, Snap, and Pinterest.
Other than the R&D spending itself, we also will look at other R&D-related metrics, including the R&D spending to revenue ratio, R&D spending to total expenditure ratio as well as the R&D spending as share-based compensation ratio.
Therefore, let’s keep going!
Social Media Companies R&D Spending Topics
1. R&D Spending (With Meta)
2. R&D Spending (Without Meta)
3. R&D Spending Growth Rates
4. R&D Spending To Revenue Ratio
5. R&D Spending To Costs And Expenses Ratio
6. Percentage Of Shared-Based Compensation Expenses In R&D Spending
7. Conclusion
8. References and Credits
9. Disclosure
Research & Development Spending (Including Meta)
Social media companies’ R&D spending
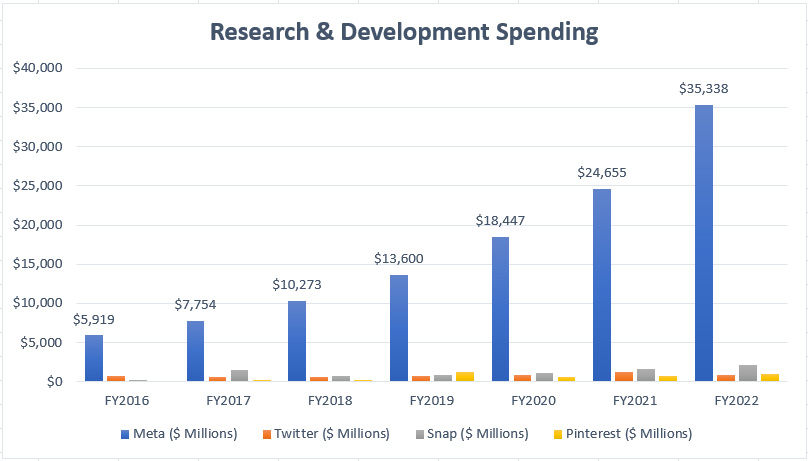
When we put the R&D spending of all social media companies into a single chart shown above, Meta Platforms’ R&D spending seems to be far exceeding that of other social media companies.
For other social media players, their R&D spending pales in comparison with that of Meta.
For example, Twitter, Snap and Pinterest’s R&D expenditure is still far below the $5 billion threshold as shown in the chart above.
On the contrary, Meta’s R&D cost reached a massive $35 billion in fiscal 2022, a figure that is nearly 18X higher than the nearest contender.
Not only is Meta’s research and development expense huge but it also has been on a rise, growing well above 30% on average since 2020.
In short, Meta takes its R&D activity seriously and will not hesitate to spend a huge number of resources on R&D to beat its competitors in the social media space.
Research & Development Spending (Without Meta)
Twitter, Snap and Pinterest’s R&D spending
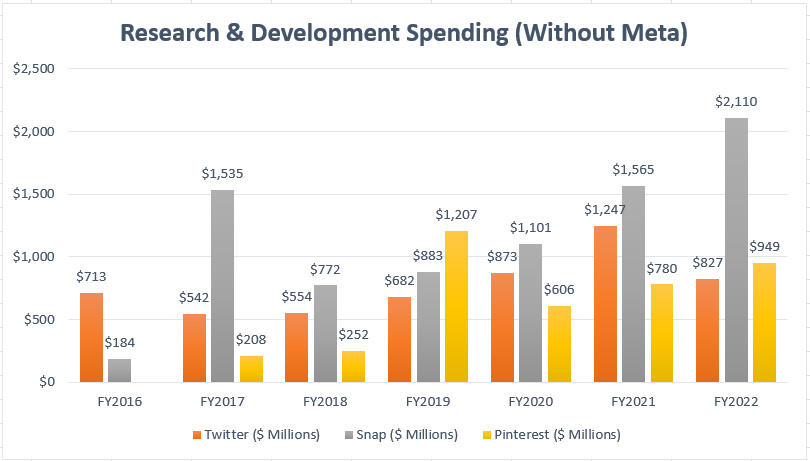
Without Meta included in the chart, we can see a much clearer picture of the R&D spending of smaller social media players such as Twitter, Snapchat, and Pinterest.
These companies’ R&D spendings are quite equal in terms of monetary value.
However, in 2022, the research and development spending of Snap Inc. seems to be the fastest-growing and has far exceeded that of other social media platforms such as Pinterest and Twitter.
For example, Snap Inc.’s R&D cost in 2022 topped more than $2 billion USD, which was way above that of other social media platforms.
While Snap’s R&D expense tops $2 billion, nearly half of that was actually in the form of stock-based compensation expenses that did not require cash outflow.
In other words, Snap uses a large number of stocks or equities to compensate its employees and these expenses are recognized as part of the research and development cost.
This ratio is shown in the next discussion.
For Pinterest, its R&D figure came in at $949 million in 2022, only about half of the amount of Snap Inc.
Twitter’s R&D cost totaled only $827 million for the 6 months that ended on June 30, 2022, as the data was only up to Q2 2022 after it was taken private in Q3 2022.
On a yearly basis, this figure may easily exceed $1.6 billion.
While Twitter’s research and development spending is far ahead of that of Pinterest, it is still below that of Snap Inc.
However, Twitter also grew its R&D expenditure quite significantly in 2022 and the growth rate is the highest among Meta, Pinterest, and Snap.
Research & Development Year-On-Year Growth Rates
R&D spending growth rates
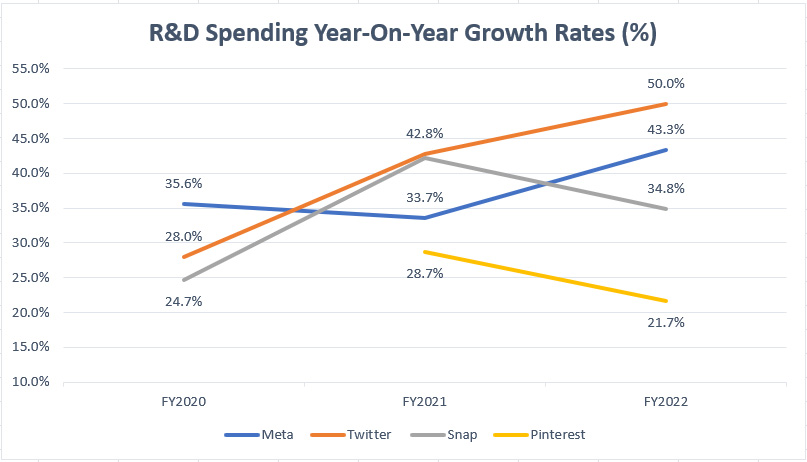
As the chart above shows, Twitter’s R&D growth rates are among the highest, reportedly at 50% in 2022, which was far ahead of that of Meta Platforms, Pinterest, and Snap Inc.
Facebook’s research and development budget grew 43% in 2022 while that of Snapchat grew 35% during the same fiscal year.
Pinterest’s research and development budget grew the slowest in 2022, reportedly at only 21.7% and this figure has declined from the 28% reported in 2021.
A notable trend worth mentioning is the rising R&D growth rates of most social media platforms in the last 3 years.
For example, R&D growth rates in 2020 were mostly in the 30% range.
This figure has already exceeded 40% as of 2022 for most social media platforms, illustrating the growing research and development spending of Meta, Pinterest, Snap Inc, and Twitter.
Research & Development Spending To Revenue Ratio
R&D spending to revenue ratio
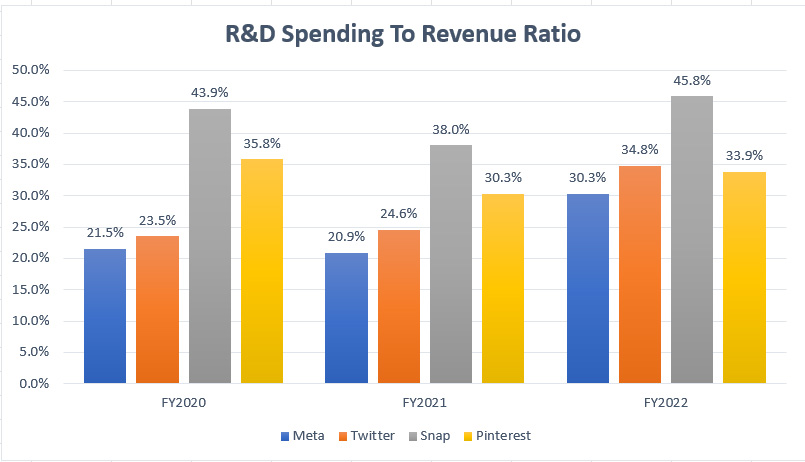
The ratio of R&D spending to revenue measures the intensity of the research and development activities with respect to sales.
The higher the ratio, the more intense the R&D is for the company.
That said, according to the chart, Meta had been ranked the lowest when it comes to the ratio of R&D to revenue.
As seen, between fiscal 2020 and 2022, Meta’s ratio logged only 24% on average, the lowest among all social media companies.
Snap Inc.’s ratio came in at 46% as of 2022 and averages 43% since 2020, the highest among all social media platforms.
Pinterest’s R&D to revenue ratio of 34% reported in 2022 was about the same as that of Twitter.
Therefore, Snap has the most intense research and development activities compared to other social media companies, at 46% of total revenue as of 2022.
Research & Development Spending To Total Costs And Expenses Ratio
R&D spending to costs and expenses ratio
R&D spending is actually part of a company’s costs and expenses of doing business.
Therefore, it’s worth finding out how much costs and expenses are being spent on R&D activities.
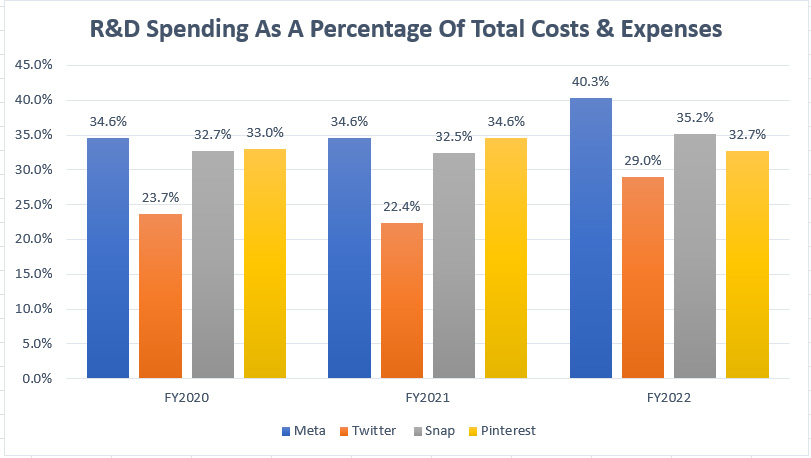
The ratio of R&D spending with respect to total costs and expenses is exactly what we need to measure the percentage or the portion of a company’s total costs and expenses that goes into research and development.
Basically, this ratio measures how optimized a company’s costs and expenses are for research and development.
Therefore, the higher the ratio, the more optimized a company’s costs and expenses are for research and development as a higher portion of costs and expenses are being channeled into R&D activities.
According to the chart, it’s interesting to see that Meta actually has the highest ratio of R&D spending with respect to total costs and expenses among all social media companies despite having the lowest R&D spending to revenue ratio which we saw earlier.
For example, Meta’s ratio of R&D spending to total costs and expenses logged 37% on average since fiscal 2020 and the figure came in at a massive 40% in 2022, the highest among all companies in the same fiscal year.
Also, Meta’s ratio of R&D to cost and expenses has been on a rise in the last 3 years, illustrating the effort the company has taken to optimize its research and development activity.
In short, Meta invests a large portion of its cost and expenses into research and development.
For other social media companies, Snap Inc and Pinterest spend nearly the same portion of cost and expenses on R&D, notably at around 33% on average since 2020.
On the contrary, Twitter invests the least amount of cost and expenses on R&D, topping only 25% on average since 2020.
In other words, Twitter is the least optimized social media platform in terms of R&D spending to total cost and expenses.
Percentage Of Shared-Based Compensation Expenses In R&D Spending
Stock-based compensation expenses included in R&D spending
It’s a normal practice for tech companies such as Facebook, Twitter, Snap, and Pinterest to reward their employees with company stocks.
Therefore, it’s worthwhile to take a quick look at the percentage of the R&D spending that comes from stock-based compensation.
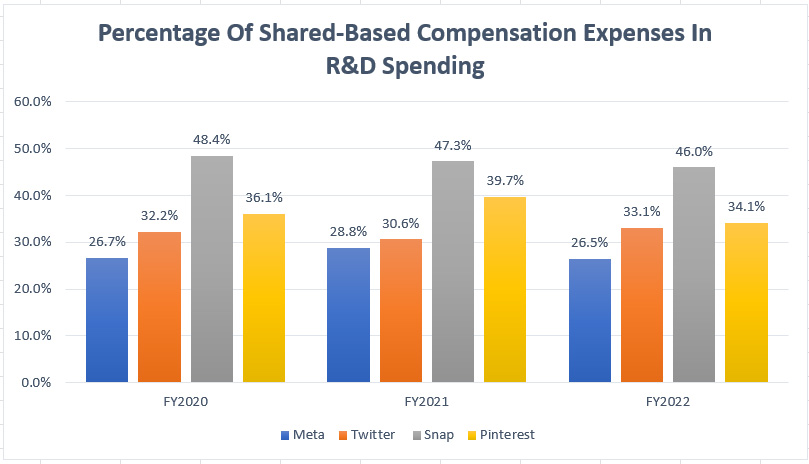
In this case, the chart above shows the percentage of R&D spending that comes from share-based compensation expenses.
According to the chart, Snap Inc. leads the packs at nearly 50% on average since 2020, which was way above the ratio of other social media platforms.
In other words, nearly 50% of Snap Inc.’s R&D budget was from stock-based compensation expenses.
In 2022, about 46% of Snap Inc.’s R&D spending came from stock-based compensation, also a much higher ratio compared to Meta, Pinterest, and Twitter.
On the contrary, only about 27% of Meta’s R&D expenditure came from stock-based compensation, the lowest ratio among Snap, Pinterest, and Twitter.
In 2022, Meta’s ratio reached only 27%, also the lowest among all social media platforms.
Pinterest’s stock-based compensation expenses as a percentage of the R&D budget were slightly higher than that of Twitter, averaging around 37% compared to Twitter’s figure of 32%.
While some of these tech giants have been less inclined to use stock-based compensation as a form of reward to employees, the percentage is still very high for most companies.
As a reminder, stock-based compensation is a non-cash expense and will only dilute the shares outstanding after shares are vested to employees.
Therefore, the company that awards the most stocks to employees as part of its R&D cost will see its shares outstanding increase the most.
Conclusion
To recap, Meta Platforms is the leading social media company when it comes to R&D budget.
As of fiscal 2022, Meta Platforms spent a whopping $35 billion on research and development, far ahead of the R&D spending of Twitter, Pinterest, and Snap Inc.
However, Meta was ranked at the bottom in terms of R&D spending to revenue ratio, illustrating the low R&D activity with respect to revenue.
The company reported an R&D spending-to-revenue ratio of only 30% in fiscal 2022 compared to the much higher ratio of 46% for Snap Inc. and the 35% ratio for Twitter in the same fiscal year.
While Meta invests the least in R&D activity from the perspective of sales, its R&D budget leads other social media companies from the perspective of total cost and expenses.
For example, with respect to total cost and expenses, Meta’s R&D ratio logged 40% in 2022 while Snap Inc’s ratio came in at only 35% whereas the ratio for Pinterest and Twitter was much lower in the same fiscal year.
Therefore, Meta Platforms has the most optimized research and development expenditure with respect to total cost and expenses.
In terms of the percentage of stock-based compensation expenses to R&D cost, Snap Inc. leads the pack.
In this regard, nearly half of Snap’s R&D spending was paid by non-cash stock options in fiscal 2022, making it a top social media company that rewarded its employees with the company’s stocks.
In contrast, Meta’s share-based compensation expenses made up only 26.5% of the company’s total R&D spending as of fiscal 2022, only about half of Snapchat’s ratio.
References and Credits
1. Financial figures in this article were obtained and referenced from earnings releases and reports which are available in the following pages:
a) Facebook Investor Relations
b) Pinterest Investor Relations
c) Twitter Investor Relations
d) Snap Investor Relations
2. Featured images in this article are used under Creative Commons License and sourced from the following pages: Department of Computer Science NTNU and Department of Computer Science NTNU.
Disclosure
If you find the information in this article helpful, please consider sharing it on social media and also provide a link back to this article from any website so that more articles like this one can be created in the future.
Thank you for the help!











Very good analysis
Thanks, I will share this web link to our invest study group.
you are so good.
Nurofusion BE user. MASKUN