An underground coal mine. Flickr Image.
You may not love coal but you definitely love coal stocks.
Over the last 5 years, stock prices of most coal-mining companies, including Peabody Energy (NYSE:BTU), Arch Resources (NYSE:ARCH), Alpha Metallurgical Resources (NYSE:AMR), etc., have shot through the roofs.
Not only are coal-related companies seeing their share prices booming, but also are companies that relate to other basic materials such as lithium, copper, silver, titanium, etc.
Therefore, a commodity boom is coming back and is coming at a much stronger cycle than the previous one.
In this article, we will look at some statistics of Peabody Energy (NYSE:BTU).
Specifically, we will look at Peabody Energy’s coal margins and profitability on a per-ton basis.
Some of the per-ton metrics include the coal revenue per ton, coal adjusted EBITDA per ton, and adjusted EBITDA margin per ton.
For your information, Peabody Energy is one of the biggest coal miners in the U.S. by revenue and by market cap.
The company owns not only some of the largest coal mines in North America but also in other parts of the world, including Australia.
Let’s start with the following topics!
Peabody Coal Revenue, Margins And Profitability Per Ton Topics
Results Of U.S. Mining Operations
A1. U.S. Thermal Coal Revenue Per Ton
A2. U.S. Thermal Coal Adjusted EBITDA Per Ton
A3. U.S. Thermal Coal Adjusted EBITDA Margin Per Ton
Results Of Overseas Mining Operations
B1. Seaborne Coal Revenue Per Ton
B2. Seaborne Coal Adjusted EBITDA Per Ton
B3. Seaborne Coal Adjusted EBITDA Margin Per Ton
Conclusion And Reference
S1. Conclusion
S2. References and Credits
S3. Disclosure
Peabody’s U.S. Thermal Coal Revenue Per Ton
Peabody U.S. thermal coal revenue per ton
(click image to enlarge)
The revenue per ton results measure the average realized price of coal per ton delivered.
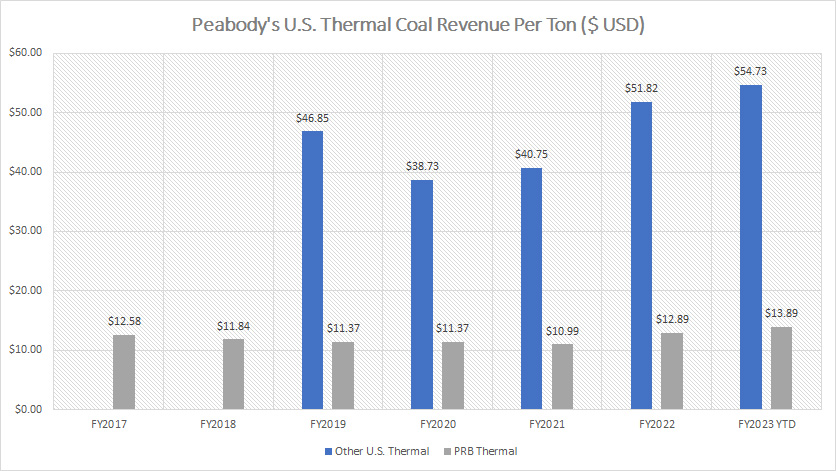
That said, Peabody achieved an average realized price of $54.73 USD per ton for other U.S. thermal coal as of fiscal 2023 Q1, a record high since 2019.
This figure is nearly 4X higher than that of Powder River Basin (PRB) thermal coal, indicating that other U.S. thermal coal fetches much better pricing than those coming from the PRB.
Nevertheless, the average realized price of Peabody’s PRB thermal coal totaled $13.89 USD per ton as of 1Q 2023, also a new high since 2017.
A trend worth mentioning is the growing revenue per ton for both other U.S. thermal and PRB thermal over the years.
As of 2023, Peabody shipped its other U.S. and PRB thermal coal at record revenue per ton.
While revenue per ton has been on the rise, it does not necessarily mean that Peabody has been making record profits.
For profitability per ton, we will look at the margin which we will cover in later discussions.
Peabody’s U.S. Thermal Coal Adjusted EBITDA Per Ton
Peabody U.S. thermal coal EBITDA per ton
(click image to enlarge)
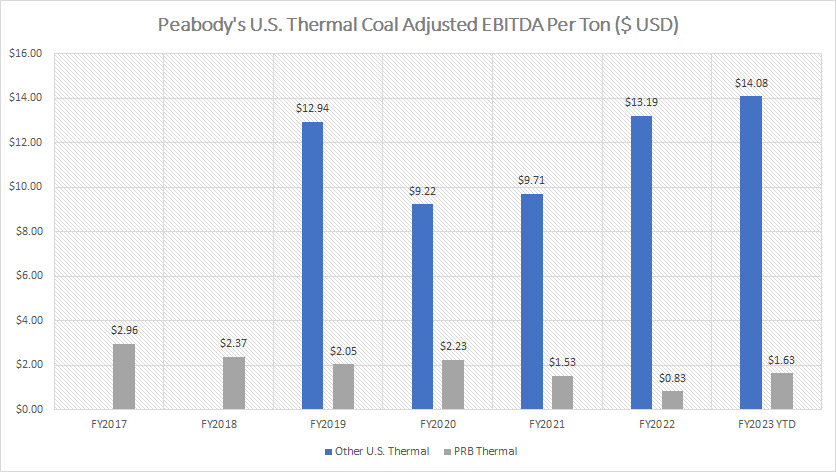
For profitability, we look at the adjusted EBITDA per ton which is presented in the chart above.
That said, Peabody’s coal profitability has only been on the rise for other U.S. thermal while that of PRB thermal seems to have been on the decline.
As seen, the adjusted EBITDA for other U.S. thermal has significantly risen but it has not been the case for coal obtained from the PRB region.
Nevertheless, Peabody’s adjusted EBITDA for PRB thermal has only managed to rise to $1.63 USD per ton as of 2023 1Q.
Prior to 2023, Peabody’s profitability decreased to a record low of $0.83 USD of adjusted EBITDA per ton in 2022 and the downtrend actually has persisted in the last several years since 2017.
Also worth mentioning is that the coal mined in the PRB region has significantly low profitability compared to other U.S. thermal coal on a per-ton basis.
For example, the EBITDA per ton for PRB thermal comes to only slightly more than $1.00 USD per ton while other U.S. thermal managed to fetch more than $10.00 USD per ton.
Therefore, Peabody’s other U.S. thermal coal is much more profitable than PRB thermal coal on a per-ton basis based on the 2022 adjusted EBITDA results.
Peabody’s U.S. Thermal Coal Adjusted EBITDA Margin Per Ton
Peabody U.S. thermal coal EBITDA margin per ton
(click image to enlarge)
The EBITDA margin measures the profitability of Peabody’s coal revenue per ton excluding certain items adjusted by the company.
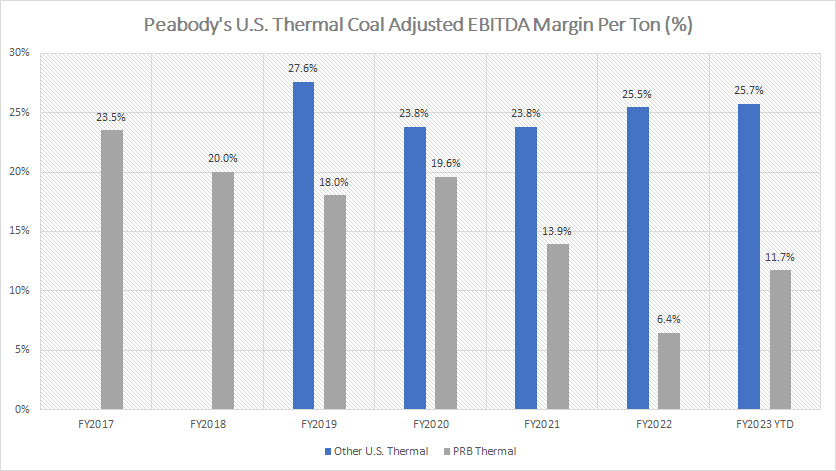
From the chart above, we can see that Peabody’s other U.S. thermal has much better margins than Powder River Basin (PRB) thermal on a per-ton basis, illustrating the higher profitability of coal obtained from other U.S. thermal compared to those obtained from the PRB region.
For example, in fiscal 2022, Peabody’s other U.S. thermal adjusted EBITDA margin per ton of 25.5% was more than 4X higher than PRB thermal adjusted EBITDA margin per ton of only 6.4%.
Far from over, Peabody has been having an increasing adjusted EBITDA margin per ton for other U.S. thermal coal over the last several years.
Other the other hand, Peabody’s PRB thermal adjusted EBITDA margin per ton has been on a decline and tumbled to its lowest number of 6.4% in 2022, indicating the declining profitability of coal mined in the PRB region.
Again, Peabody’s other U.S. thermal coal is much more profitable than those obtained from the PRB region from the perspective of margin.
Peabody’s Seaborner Coal Revenue Per Ton
Peabody seaborne coal revenue per ton
(click image to enlarge)
Seaborne coal is coal mined outside of the U.S.
The coal mined overseas can be exported to other countries or for domestic consumption.
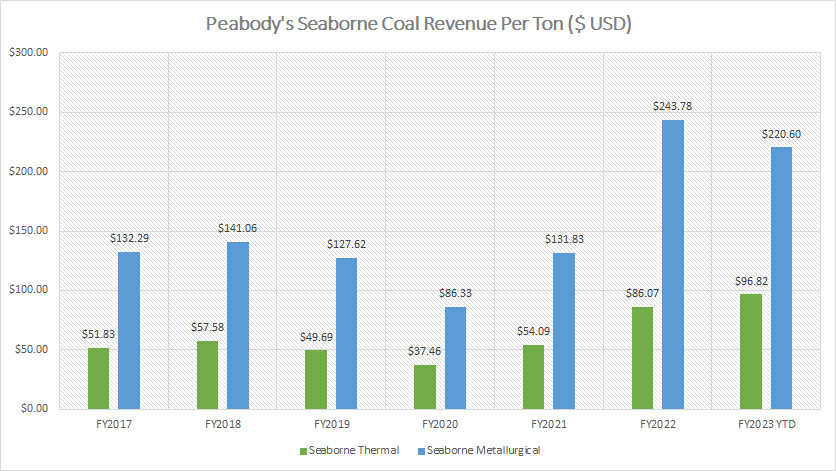
That said, Peabody’s seaborne metallurgical coal has much better pricing than seaborne thermal coal as shown in the chart, and the average realized price of seaborne metallurgical coal is more than double that of seaborne thermal coal.
Nevertheless, Peabody’s seaborne revenue per ton for both thermal and metallurgical coals has slowly climbed and reached record highs as of Q1 2023.
In fiscal 2022, the revenue per ton figures were $243.78 USD and $86.07 USD for seaborne thermal and metallurgical coals, respectively.
As of fiscal 1Q 2023, Peabody delivered its coal volume at an average realized price of $220.60 USD and $96.82 USD for seaborne thermal and metallurgical coals, respectively.
Again, the higher revenue per ton does not necessarily mean that Peabody was making record profits from seaborne coal.
We need to look at the profitability and margin per ton figures which will be covered in later discussions.
Peabody’s Seaborne Coal Adjusted EBITDA Per Ton
Peabody seaborne coal EBITDA per ton
(click image to enlarge)
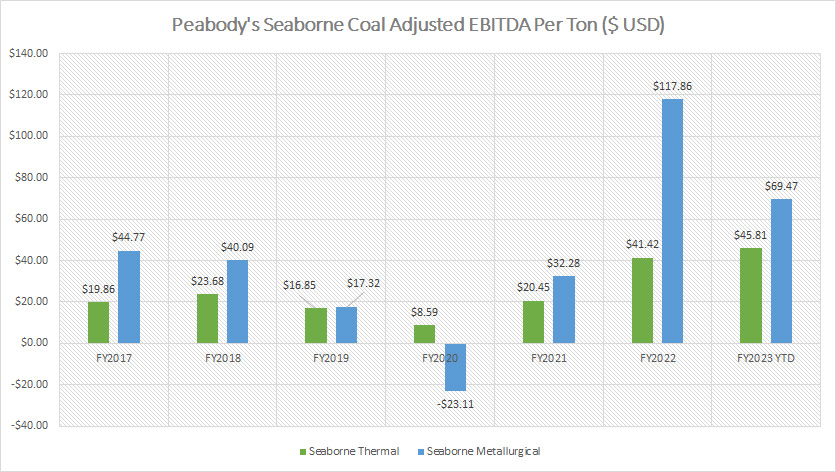
On a per-ton basis, Peabody’s seaborne metallurgical coal is much more profitable than seaborne thermal.
For example, in fiscal 2022, the adjusted EBITDA per ton for seaborne metallurgical coal was $117.86 USD whereas the figure was only $41.42 USD for seaborne thermal coal, which was less than half of that of seaborne metallurgical coal.
A trend worth pointing out is the recovery of the adjusted EBITDA per ton for both seaborne metallurgical and thermal coal since fiscal 2020 when profitability hit record lows.
Since 2020, Peabody’s adjusted EBITDA per ton in both seaborne metallurgical and thermal coals has been on the rise, illustrating the growing profitability of its overseas mining operations.
Peabody’s Seaborne Coal Adjusted EBITDA Margin Per Ton
Peabody seaborne coal EBITDA margin per ton
(click image to enlarge)
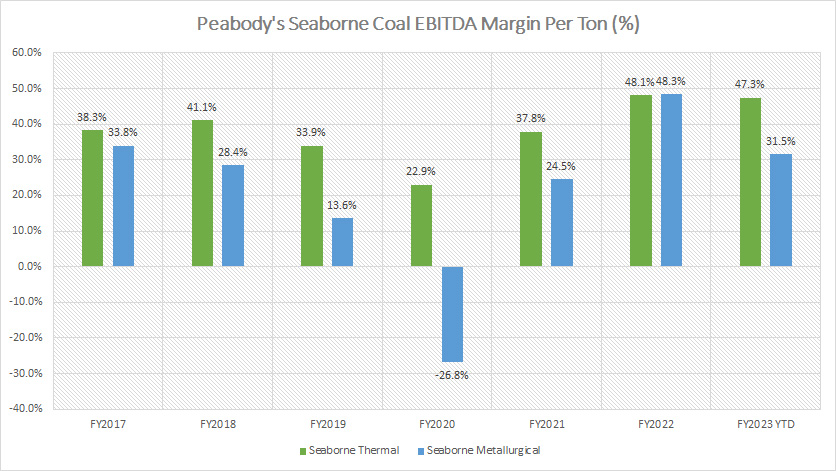
From the perspective of margin per ton, Peabody’s seaborne thermal coal is a much more profitable operation compared to seaborne metallurgical coal.
This trend is in contrast with that of the adjusted EBITDA per ton which we saw in prior discussions.
Nevertheless, in fiscal 2022, Peabody’s adjusted EBITDA margin per ton for both seaborne thermal and metallurgical coal was about the same, at 48%.
However, as of 1Q 2023, Peabody was able to maintain the margin per ton for seaborne thermal coal but the profitability of seaborne metallurgical coal dived to only 31.5% in terms of the adjusted EBITDA margin per ton.
Also, in prior years, Peabody’s seaborne thermal coal was much more profitable than seaborne metallurgical coal due to the higher adjusted EBITDA margin per ton.
In fiscal 2020, Peabdoy actually made a loss in seaborne metallurgical coal when the respective adjusted EBITDA margin per ton dived to -26.8%.
Summary
To recap, Peabody’s other U.S. thermal coal has much better pricing than Powder River Basin (PRB) coal.
Also, Peabody’s other U.S. thermal has better profitability than PRB thermal given the higher EBITDA and EBITDA margin per ton for other U.S. thermal mining operations.
Therefore, Peabody’s other U.S. thermal is a much more profitable mining operation compared to PRB thermal.
For overseas mining operations, Peabody’s seaborne metallurgical has much better pricing than seaborne thermal coal.
In terms of profitability per ton, Peabody’s seaborne metallurgical coal is far more profitable than seaborne thermal coal given the far higher adjusted EBITDA per ton for seaborne metallurgical coal.
However, from the perspective of margin per ton, Peabody’s seaborne thermal coal has better profitability than seaborne metallurgical coal as the adjusted EBITDA margin per ton for seaborne thermal coal is slightly higher than that of seaborne metallurgical coal.
References and Credits
1. All financial figures in this article were obtained and referenced from Peabody’s earnings reports, SEC filings, and other statements which are available in Peabody Investor Center.
2. Featured images in this article are used under Creative Common Licenses and obtained from Coal Mining and Underground Coal Mine.
Disclosure
References and examples such as tables, charts, and diagrams are constantly reviewed to avoid errors, but we cannot warrant the full correctness of all content.
The content in this article is for informational purposes only and is neither a recommendation nor a piece of financial advice to purchase a stock.
If you find the information in this article helpful, please consider sharing it on social media and also provide a link back to this article from any website so that more articles like this one can be created in the future.
Thank you!

